Wimbledon Heights Airbnb Market Analysis 2025: Short Term Rental Data & Vacation Rental Statistics in Victoria, Australia
Is Airbnb profitable in Wimbledon Heights in 2025? Explore comprehensive Airbnb analytics for Wimbledon Heights, Victoria, Australia to uncover income potential. This 2025 STR market report for Wimbledon Heights, based on AirROI data from April 2024 to March 2025, reveals key trends in the niche market of 30 active listings.
Whether you're considering an Airbnb investment in Wimbledon Heights, optimizing your existing vacation rental, or exploring rental arbitrage opportunities, understanding the Wimbledon Heights Airbnb data is crucial. Leveraging the low regulation environment is key to maximizing your short term rental income potential. Let's dive into the specifics.
Key Wimbledon Heights Airbnb Performance Metrics Overview
Monthly Airbnb Revenue Variations & Income Potential in Wimbledon Heights (2025)
Understanding the monthly revenue variations for Airbnb listings in Wimbledon Heights is key to maximizing your short term rental income potential. Seasonality significantly impacts earnings. Our analysis, based on data from the past 12 months, shows that the peak revenue month for STRs in Wimbledon Heights is typically January, while August often presents the lowest earnings, highlighting opportunities for strategic pricing adjustments during shoulder and low seasons. Explore the typical Airbnb income in Wimbledon Heights across different performance tiers:
- Best-in-class properties (Top 10%) achieve $4,252+ monthly, often utilizing dynamic pricing and superior guest experiences.
- Strong performing properties (Top 25%) earn $2,909 or more, indicating effective management and desirable locations/amenities.
- Typical properties (Median) generate around $1,654 per month, representing the average market performance.
- Entry-level properties (Bottom 25%) see earnings around $1,061, often with potential for optimization.
Average Monthly Airbnb Earnings Trend in Wimbledon Heights
Wimbledon Heights Airbnb Occupancy Rate Trends (2025)
Maximize your bookings by understanding the Wimbledon Heights STR occupancy trends. Seasonal demand shifts significantly influence how often properties are booked. Typically, Januarysees the highest demand (peak season occupancy), while May experiences the lowest (low season). Effective strategies, like adjusting minimum stays or offering promotions, can boost occupancy during slower periods. Here's how different property tiers perform in Wimbledon Heights:
- Best-in-class properties (Top 10%) achieve 74%+ occupancy, indicating high desirability and potentially optimized availability.
- Strong performing properties (Top 25%) maintain 59% or higher occupancy, suggesting good market fit and guest satisfaction.
- Typical properties (Median) have an occupancy rate around 37%.
- Entry-level properties (Bottom 25%) average 19% occupancy, potentially facing higher vacancy.
Average Monthly Occupancy Rate Trend in Wimbledon Heights
Average Daily Rate (ADR) Airbnb Trends in Wimbledon Heights (2025)
Effective short term rental pricing strategy in Wimbledon Heights involves understanding monthly ADR fluctuations. The Average Daily Rate (ADR) for Airbnb in Wimbledon Heights typically peaks in January and dips lowest during May. Leveraging Airbnb dynamic pricing tools or strategies based on this seasonality can significantly boost revenue. Here's a look at the typical nightly rates achieved:
- Best-in-class properties (Top 10%) command rates of $260+ per night, often due to premium features or locations.
- Strong performing properties (Top 25%) achieve nightly rates of $214 or more.
- Typical properties (Median) charge around $145 per night.
- Entry-level properties (Bottom 25%) earn around $110 per night.
Average Daily Rate (ADR) Trend by Month in Wimbledon Heights
Get Live Wimbledon Heights Market Intelligence 👇

Explore Real-time Analytics
Airbnb Seasonality Analysis & Trends in Wimbledon Heights (2025)
Peak Season (January, December, April)
- Revenue averages $2,944 per month
- Occupancy rates average 47.8%
- Daily rates average $182
Shoulder Season
- Revenue averages $1,973 per month
- Occupancy maintains around 39.7%
- Daily rates hold near $159
Low Season (July, August, September)
- Revenue drops to average $1,439 per month
- Occupancy decreases to average 35.6%
- Daily rates adjust to average $149
Seasonality Insights for Wimbledon Heights
- The Airbnb seasonality in Wimbledon Heights shows highly seasonal trends requiring careful strategy. While the sections above show seasonal averages, it's also insightful to look at the extremes:
- During the high season, the absolute peak month showcases Wimbledon Heights's highest earning potential, with monthly revenues capable of climbing to $3,326, occupancy reaching a high of 56.2%, and ADRs peaking at $205.
- Conversely, the slowest single month of the year, typically falling within the low season, marks the market's lowest point. In this month, revenue might dip to $1,362, occupancy could drop to 32.0%, and ADRs may adjust down to $146.
- Understanding both the seasonal averages and these monthly peaks and troughs in revenue, occupancy, and ADR is crucial for maximizing your Airbnb profit potential in Wimbledon Heights.
Seasonal Strategies for Maximizing Profit
- Peak Season: Maximize revenue through premium pricing and potentially longer minimum stays. Ensure high availability.
- Low Season: Offer competitive pricing, special promotions (e.g., extended stay discounts), and flexible cancellation policies. Target off-season travelers like remote workers or budget-conscious guests.
- Shoulder Seasons: Implement dynamic pricing that balances peak and low rates. Target weekend travelers or specific events. Offer slightly more flexible terms than peak season.
- Regularly analyze your own performance against these Wimbledon Heights seasonality benchmarks and adjust your pricing and availability strategy accordingly.
Best Areas for Airbnb Investment in Wimbledon Heights (2025)
Exploring the top neighborhoods for short-term rentals in Wimbledon Heights? This section highlights key areas, outlining why they are attractive for hosts and guests, along with notable local attractions. Consider these locations based on your target guest profile and investment strategy.
| Neighborhood / Area | Why Host Here? (Target Guests & Appeal) | Key Attractions & Landmarks |
|---|---|---|
| Wimbledon Park | A beautiful location with lush green parks and recreational facilities, popular among families and visitors looking for a peaceful stay close to nature. | Wimbledon Park, Wimbledon Common, The All England Lawn Tennis Club, Wimbledon Tennis Museum, Merton Abbey Mills |
| South Wimbledon | A vibrant suburb with a mix of residential and entertainment options, appealing to young professionals and travelers seeking a lively atmosphere. | South Wimbledon Tube Station, Local cafes and restaurants, Wimbledon Broadway, Wimbledon Theatre, Parkside School |
| Wimbledon Village | Charming village atmosphere with boutique shops, cafes, and historic sites, ideal for guests looking for a quaint and upscale experience. | Wimbledon Village, Wimbledon Common, The Dog & Fox Pub, Local artisan shops, Wimbledon Windmill |
| Raynes Park | A family-friendly neighborhood with excellent transport links to central London, making it a great base for tourists exploring the city. | Raynes Park Station, Kingston Road, Local parks, Wimbledon Lawn Tennis Museum, Wimbledon Tennis Championships |
| Colliers Wood | A culturally diverse area with a range of dining options and close proximity to the Tube for easy access to London, attracting budget and family travelers. | Colliers Wood Tube Station, Tooting High Street, Local markets, Mitcham Common, Wandle Park |
| Merton | Combining urban amenities with residential comfort, Merton is ideal for long-term stays and features various parks and leisure activities. | Merton Abbey Mills, Local parks, Wimbledon Football Club, Morden Hall Park, Merton Civic Centre |
| West Wimbledon | A quieter residential area with green spaces, appealing to travelers looking for a peaceful retreat while still being close to town. | Wimbledon Chase Station, Local parks, Richmond Park, Wimbledon Tennis Courts, Green spaces |
| North Wimbledon | A mix of residential and commercial areas, offering a good balance for visitors looking for convenience and access to local amenities. | North Wimbledon Tube Station, Local shopping areas, Wimbledon Park, Cafes and restaurants, Close to major transport links |
Understanding Airbnb License Requirements & STR Laws in Wimbledon Heights (2025)
While Wimbledon Heights, Victoria, Australia currently shows low STR regulations, specific Airbnb license requirements might still exist or change. Always verify the latest short term rental regulations and Airbnb license requirements directly with local government authorities for Wimbledon Heights to ensure full compliance before hosting.
(Source: AirROI data, 2025, finding no licensed listings among those analyzed)
Top Performing Airbnb Properties in Wimbledon Heights (2025)
Benchmark your potential! Explore examples of top-performing Airbnb properties in Wimbledon Heightsbased on Trailing Twelve Month (TTM) revenue. Analyze their characteristics, revenue, occupancy rate, and ADR to understand what drives success in this market.
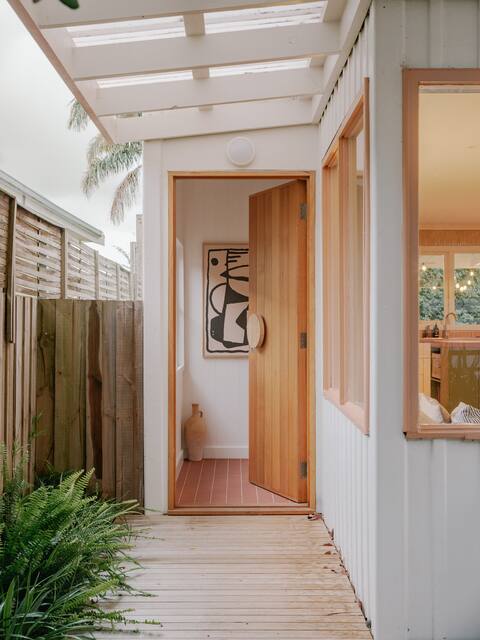
Las Olas Shack, Phillip Island
Entire Place • 2 bedrooms
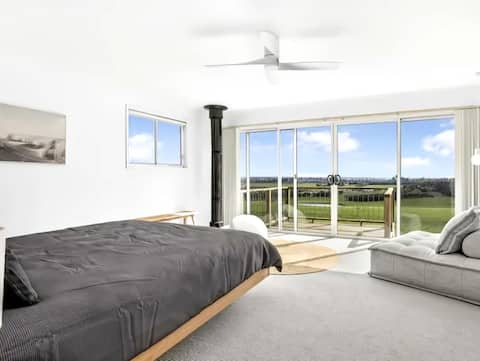
Peaceful with Bay Views
Entire Place • 3 bedrooms
Castlebay
Entire Place • 4 bedrooms
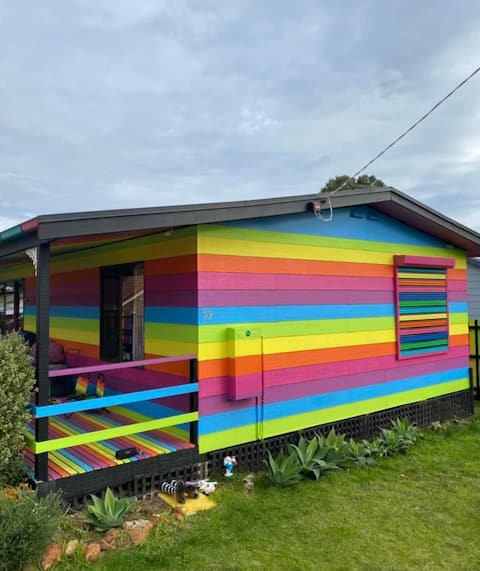
Rainbow Retreat Phillip Island
Entire Place • 3 bedrooms
Harvest Moon - Phillip Island
Entire Place • 3 bedrooms

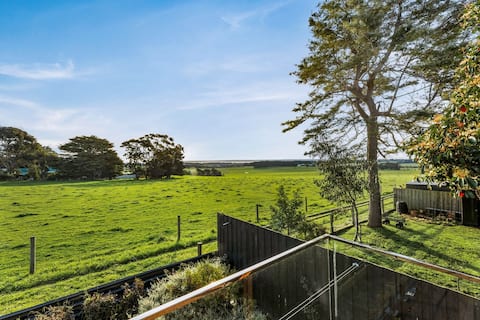
Spectacular Views - Quiet Location - Outdoor Spa
Entire Place • 3 bedrooms
Note: Performance varies based on location, size, amenities, seasonality, and management quality. Data reflects the past 12 months.
Top Performing Airbnb Hosts in Wimbledon Heights (2025)
Learn from the best! This table showcases top-performing Airbnb hosts in Wimbledon Heights based on the number of properties managed and estimated total revenue over the past year. Analyze their scale and performance metrics.
| Host Name | Properties | Grossing Revenue | Stay Reviews | Avg Rating |
|---|---|---|---|---|
| Joel & Caleb | 2 | $62,645 | 44 | 4.96/5.0 |
| Aura | 1 | $50,039 | 20 | 5.00/5.0 |
| Josh | 1 | $47,731 | 61 | 4.75/5.0 |
| Deanna | 2 | $40,110 | 70 | 4.95/5.0 |
| Mykey | 1 | $36,448 | 77 | 4.92/5.0 |
| Sandra | 2 | $35,742 | 120 | 4.70/5.0 |
| Stephen | 1 | $34,560 | 181 | 4.94/5.0 |
| Bronwyn | 1 | $32,679 | 75 | 4.87/5.0 |
| Fiona | 1 | $30,316 | 122 | 4.87/5.0 |
| Tiahn | 1 | $25,644 | 14 | 4.71/5.0 |
Analyzing the strategies of top hosts, such as their property selection, pricing, and guest communication, can offer valuable lessons for optimizing your own Airbnb operations in Wimbledon Heights.
Dive Deeper: Advanced Wimbledon Heights STR Market Data (2025)
Ready to unlock more insights? AirROI provides access to advanced metrics and comprehensive Airbnb data for Wimbledon Heights. Explore detailed analytics beyond this report to refine your investment strategy, optimize pricing, and maximize your vacation rental profits.
Explore Advanced MetricsWimbledon Heights Short-Term Rental Market Composition (2025): Property & Room Types
Room Type Distribution
Property Type Distribution
Market Composition Insights for Wimbledon Heights
- The Wimbledon Heights Airbnb market composition is heavily skewed towards Entire Home/Apt listings, which make up 100% of the 30 active rentals. This indicates strong guest preference for privacy and space.
- Looking at the property type distribution in Wimbledon Heights, House properties are the most common (86.7%), reflecting the local real estate landscape.
- Houses represent a significant 86.7% portion, catering likely to families or larger groups.
- The presence of 10% Hotel/Boutique listings indicates integration with traditional hospitality.
- Smaller segments like others (combined 3.3%) offer potential for unique stay experiences.
Wimbledon Heights Airbnb Room Capacity Analysis (2025): Bedroom Distribution
Distribution of Listings by Number of Bedrooms
Room Capacity Insights for Wimbledon Heights
- The dominant room capacity in Wimbledon Heights is 3 bedrooms listings, making up 50% of the market. This suggests a strong demand for properties suitable for families or small groups.
- Together, 3 bedrooms and 2 bedrooms properties represent 66.7% of the active Airbnb listings in Wimbledon Heights, indicating a high concentration in these sizes.
- A significant 70.0% of listings offer 3+ bedrooms, catering to larger groups and families seeking more space in Wimbledon Heights.
Wimbledon Heights Vacation Rental Guest Capacity Trends (2025)
Distribution of Listings by Guest Capacity
Guest Capacity Insights for Wimbledon Heights
- The most common guest capacity trend in Wimbledon Heights vacation rentals is listings accommodating 8+ guests (30%). This suggests the primary traveler segment is likely larger groups.
- Properties designed for 8+ guests and 5 guests dominate the Wimbledon Heights STR market, accounting for 53.3% of listings.
- 50.0% of properties accommodate 6+ guests, serving the market segment for larger families or group travel in Wimbledon Heights.
- On average, properties in Wimbledon Heights are equipped to host 5.7 guests.
Wimbledon Heights Airbnb Booking Patterns (2025): Available vs. Booked Days
Available Days Distribution
Booked Days Distribution
Booking Pattern Insights for Wimbledon Heights
- The most common availability pattern in Wimbledon Heights falls within the 271-366 days range, representing 43.3% of listings. This suggests many properties have significant open periods on their calendars.
- Approximately 70.0% of listings show high availability (181+ days open annually), indicating potential for increased bookings or specific owner usage patterns.
- For booked days, the 91-180 days range is most frequent in Wimbledon Heights (30%), reflecting common guest stay durations or potential owner blocking patterns.
- A notable 30.0% of properties secure long booking periods (181+ days booked per year), highlighting successful long-term rental strategies or significant owner usage.
Wimbledon Heights Airbnb Minimum Stay Requirements Analysis
Distribution of Listings by Minimum Night Requirement
1 Night
6 listings
20.7% of total
2 Nights
6 listings
20.7% of total
3 Nights
3 listings
10.3% of total
30+ Nights
14 listings
48.3% of total
Key Insights
- The most prevalent minimum stay requirement in Wimbledon Heights is 30+ Nights, adopted by 48.3% of listings. This highlights the market's preference for longer commitments.
- A significant segment (48.3%) caters to monthly stays (30+ nights) in Wimbledon Heights, pointing to opportunities in the extended-stay market.
Recommendations
- Align with the market by considering a 30+ Nights minimum stay, as 48.3% of Wimbledon Heights hosts use this setting.
- If feasible, allowing 1-night stays, especially midweek or during low season, could capture last-minute bookings, as only 20.7% currently do.
- Explore offering discounts for stays of 30+ nights to attract the 48.3% of the market seeking extended stays.
- Adjust minimum nights based on seasonality – potentially shorter during low season and longer during peak demand periods in Wimbledon Heights.
Wimbledon Heights Airbnb Cancellation Policy Trends Analysis (2025)
Flexible
3 listings
11.5% of total
Moderate
7 listings
26.9% of total
Firm
7 listings
26.9% of total
Strict
9 listings
34.6% of total
Cancellation Policy Insights for Wimbledon Heights
- The prevailing Airbnb cancellation policy trend in Wimbledon Heights is Strict, used by 34.6% of listings.
- A majority (61.5%) of hosts in Wimbledon Heights utilize Firm or Strict policies, indicating a market where hosts prioritize booking security.
Recommendations for Hosts
- Consider adopting a Strict policy to align with the 34.6% market standard in Wimbledon Heights.
- With 34.6% using Strict terms, this is a viable option in Wimbledon Heights, particularly for high-value properties or during peak demand periods.
- Regularly review your cancellation policy against competitors and market demand shifts in Wimbledon Heights.
Wimbledon Heights STR Booking Lead Time Analysis (2025)
Average Booking Lead Time by Month
Booking Lead Time Insights for Wimbledon Heights
- The overall average booking lead time for vacation rentals in Wimbledon Heights is 55 days.
- Guests book furthest in advance for stays during January (average 77 days), likely coinciding with peak travel demand or local events.
- The shortest booking windows occur for stays in September (average 38 days), indicating more last-minute travel plans during this time.
- Seasonally, Winter (72 days avg.) sees the longest lead times, while Spring (52 days avg.) has the shortest, reflecting typical travel planning cycles.
Recommendations for Hosts
- Use the overall average lead time (55 days) as a baseline for your pricing and availability strategy in Wimbledon Heights.
- For January stays, consider implementing length-of-stay discounts or slightly higher rates for bookings made less than 77 days out to capitalize on advance planning.
- Target marketing efforts for the Winter season well in advance (at least 72 days) to capture early planners.
- Monitor your own booking lead times against these Wimbledon Heights averages to identify opportunities for dynamic pricing adjustments.
Popular & Essential Airbnb Amenities in Wimbledon Heights (2025)
Amenity Prevalence
Amenity Insights for Wimbledon Heights
- Essential amenities in Wimbledon Heights that guests expect include: Heating, Kitchen, Refrigerator, TV, Free parking on premises, Washer, Smoke alarm. Lacking these (any) could significantly impact bookings.
- Popular amenities like Air conditioning, Hot water, Microwave are common but not universal. Offering these can provide a competitive edge.
Recommendations for Hosts
- Ensure your listing includes all essential amenities for Wimbledon Heights: Heating, Kitchen, Refrigerator, TV, Free parking on premises, Washer, Smoke alarm.
- Prioritize adding missing essentials: Free parking on premises, Washer, Smoke alarm.
- Consider adding popular differentiators like Air conditioning or Hot water to increase appeal.
- Highlight unique or less common amenities you offer (e.g., hot tub, dedicated workspace, EV charger) in your listing description and photos.
- Regularly check competitor amenities in Wimbledon Heights to stay competitive.
Wimbledon Heights Airbnb Guest Demographics & Profile Analysis (2025)
Guest Profile Summary for Wimbledon Heights
- The typical guest profile for Airbnb in Wimbledon Heights consists of primarily domestic travelers (81%), often arriving from nearby Melbourne, typically belonging to the Post-2000s (Gen Z/Alpha) group (50%), primarily speaking English or Chinese.
- Domestic travelers account for 80.9% of guests.
- Key international markets include Australia (80.9%) and Singapore (5.4%).
- Top languages spoken are English (58%) followed by Chinese (10.1%).
- A significant demographic segment is the Post-2000s (Gen Z/Alpha) group, representing 50% of guests.
Recommendations for Hosts
- Target domestic marketing efforts towards travelers from Melbourne and Victoria.
- Tailor amenities and listing descriptions to appeal to the dominant Post-2000s (Gen Z/Alpha) demographic (e.g., highlight fast WiFi, smart home features, local guides).
- Highlight unique local experiences or amenities relevant to the primary guest profile.
- Consider seasonal promotions aligned with peak travel times for key origin markets.
Nearby Short-Term Rental Market Comparison
How does the Wimbledon Heights Airbnb market stack up against its neighbors? Compare key performance metrics like average monthly revenue, ADR, and occupancy rates in surrounding areas to understand the broader regional STR landscape.
| Market | Active Properties | Monthly Revenue | Daily Rate | Avg. Occupancy |
|---|---|---|---|---|
| Lancefield | 18 | $4,069 | $343.64 | 49% |
| Howqua Inlet | 13 | $3,634 | $322.01 | 37% |
| Leopold | 12 | $3,496 | $429.65 | 41% |
| Yanakie | 16 | $3,473 | $212.73 | 54% |
| Trentham | 52 | $3,455 | $269.84 | 41% |
| Lyonville | 10 | $3,441 | $349.65 | 35% |
| Shire of Mansfield | 89 | $3,347 | $392.77 | 34% |
| Jamieson | 37 | $3,138 | $283.80 | 33% |
| Shire of Hepburn | 283 | $3,120 | $298.86 | 36% |
| Shire of Murrindindi | 70 | $3,061 | $268.84 | 40% |