Warrnambool Airbnb Market Analysis 2025: Short Term Rental Data & Vacation Rental Statistics in Victoria, Australia
Is Airbnb profitable in Warrnambool in 2025? Explore comprehensive Airbnb analytics for Warrnambool, Victoria, Australia to uncover income potential. This 2025 STR market report for Warrnambool, based on AirROI data from April 2024 to March 2025, reveals key trends in the market of 263 active listings.
Whether you're considering an Airbnb investment in Warrnambool, optimizing your existing vacation rental, or exploring rental arbitrage opportunities, understanding the Warrnambool Airbnb data is crucial. Leveraging the low regulation environment is key to maximizing your short term rental income potential. Let's dive into the specifics.
Key Warrnambool Airbnb Performance Metrics Overview
Monthly Airbnb Revenue Variations & Income Potential in Warrnambool (2025)
Understanding the monthly revenue variations for Airbnb listings in Warrnambool is key to maximizing your short term rental income potential. Seasonality significantly impacts earnings. Our analysis, based on data from the past 12 months, shows that the peak revenue month for STRs in Warrnambool is typically January, while August often presents the lowest earnings, highlighting opportunities for strategic pricing adjustments during shoulder and low seasons. Explore the typical Airbnb income in Warrnambool across different performance tiers:
- Best-in-class properties (Top 10%) achieve $5,514+ monthly, often utilizing dynamic pricing and superior guest experiences.
- Strong performing properties (Top 25%) earn $3,645 or more, indicating effective management and desirable locations/amenities.
- Typical properties (Median) generate around $2,214 per month, representing the average market performance.
- Entry-level properties (Bottom 25%) see earnings around $1,147, often with potential for optimization.
Average Monthly Airbnb Earnings Trend in Warrnambool
Warrnambool Airbnb Occupancy Rate Trends (2025)
Maximize your bookings by understanding the Warrnambool STR occupancy trends. Seasonal demand shifts significantly influence how often properties are booked. Typically, Januarysees the highest demand (peak season occupancy), while June experiences the lowest (low season). Effective strategies, like adjusting minimum stays or offering promotions, can boost occupancy during slower periods. Here's how different property tiers perform in Warrnambool:
- Best-in-class properties (Top 10%) achieve 82%+ occupancy, indicating high desirability and potentially optimized availability.
- Strong performing properties (Top 25%) maintain 66% or higher occupancy, suggesting good market fit and guest satisfaction.
- Typical properties (Median) have an occupancy rate around 43%.
- Entry-level properties (Bottom 25%) average 21% occupancy, potentially facing higher vacancy.
Average Monthly Occupancy Rate Trend in Warrnambool
Average Daily Rate (ADR) Airbnb Trends in Warrnambool (2025)
Effective short term rental pricing strategy in Warrnambool involves understanding monthly ADR fluctuations. The Average Daily Rate (ADR) for Airbnb in Warrnambool typically peaks in January and dips lowest during August. Leveraging Airbnb dynamic pricing tools or strategies based on this seasonality can significantly boost revenue. Here's a look at the typical nightly rates achieved:
- Best-in-class properties (Top 10%) command rates of $348+ per night, often due to premium features or locations.
- Strong performing properties (Top 25%) achieve nightly rates of $251 or more.
- Typical properties (Median) charge around $172 per night.
- Entry-level properties (Bottom 25%) earn around $121 per night.
Average Daily Rate (ADR) Trend by Month in Warrnambool
Get Live Warrnambool Market Intelligence 👇

Explore Real-time Analytics
Airbnb Seasonality Analysis & Trends in Warrnambool (2025)
Peak Season (January, December, April)
- Revenue averages $3,880 per month
- Occupancy rates average 51.2%
- Daily rates average $229
Shoulder Season
- Revenue averages $2,601 per month
- Occupancy maintains around 42.6%
- Daily rates hold near $197
Low Season (February, August, September)
- Revenue drops to average $2,234 per month
- Occupancy decreases to average 42.5%
- Daily rates adjust to average $194
Seasonality Insights for Warrnambool
- The Airbnb seasonality in Warrnambool shows highly seasonal trends requiring careful strategy. While the sections above show seasonal averages, it's also insightful to look at the extremes:
- During the high season, the absolute peak month showcases Warrnambool's highest earning potential, with monthly revenues capable of climbing to $4,520, occupancy reaching a high of 57.5%, and ADRs peaking at $258.
- Conversely, the slowest single month of the year, typically falling within the low season, marks the market's lowest point. In this month, revenue might dip to $2,064, occupancy could drop to 35.2%, and ADRs may adjust down to $184.
- Understanding both the seasonal averages and these monthly peaks and troughs in revenue, occupancy, and ADR is crucial for maximizing your Airbnb profit potential in Warrnambool.
Seasonal Strategies for Maximizing Profit
- Peak Season: Maximize revenue through premium pricing and potentially longer minimum stays. Ensure high availability.
- Low Season: Offer competitive pricing, special promotions (e.g., extended stay discounts), and flexible cancellation policies. Target off-season travelers like remote workers or budget-conscious guests.
- Shoulder Seasons: Implement dynamic pricing that balances peak and low rates. Target weekend travelers or specific events. Offer slightly more flexible terms than peak season.
- Regularly analyze your own performance against these Warrnambool seasonality benchmarks and adjust your pricing and availability strategy accordingly.
Best Areas for Airbnb Investment in Warrnambool (2025)
Exploring the top neighborhoods for short-term rentals in Warrnambool? This section highlights key areas, outlining why they are attractive for hosts and guests, along with notable local attractions. Consider these locations based on your target guest profile and investment strategy.
| Neighborhood / Area | Why Host Here? (Target Guests & Appeal) | Key Attractions & Landmarks |
|---|---|---|
| Flagstaff Hill | A popular tourist destination featuring the historical maritime village and the famous Flagstaff Hill Maritime Museum. Ideal for visitors interested in local history and culture. | Flagstaff Hill Maritime Village, 12 Apostles, Warrnambool Botanic Gardens, Warrnambool Beach, Middle Island and The Little Penguin Parade |
| Warrnambool Beach | A stunning stretch of coastline that attracts beachgoers and water sports enthusiasts. Perfect for families and groups looking for fun in the sun. | Warrnambool Beach, Thunder Point Coastal Reserve, Merri Marine Sanctuary, Pickering Point, The Breakwater |
| Hopkins River | Scenic views and excellent fishing spots make the Hopkins River area a favorite among nature lovers and tourists looking for a relaxing getaway. | Hopkins Falls, Fishing spots, River cruises, Walking trails, Picnic areas |
| Botanic Gardens | A beautiful, lush area providing a peaceful retreat for nature enthusiasts and a great spot for families with well-maintained gardens and a children’s play area. | Warrnambool Botanic Gardens, Lake Pertobe Activity Park, Historic trees, Walking paths |
| Central Warrnambool | The heart of Warrnambool with shopping, dining, and entertainment options. Convenient for visitors who want to explore the city's vibrant urban life. | Warrnambool Art Gallery, Civic Green, Shopping precincts, Cafés and restaurants |
| The 12 Apostles | A world-renowned natural landmark just a short drive away, attracting tourists from all over the globe. A must-visit for all visitors to the region. | The 12 Apostles, Loch Ard Gorge, Great Ocean Road, Scenic helicopter flights |
| Merri River Mouth | A picturesque location where the Merri River meets the ocean, ideal for fishing, swimming, and enjoying stunning sunsets. | Merri River mouth, Fishing areas, Surfing spots, Walking trails |
| Lake Pertobe | A family-friendly area featuring a large playground, lake activities, and picnic facilities, popular among locals and tourists alike. | Lake Pertobe, Playgrounds, BBQ areas, Walking trails, Water activities |
Understanding Airbnb License Requirements & STR Laws in Warrnambool (2025)
While Warrnambool, Victoria, Australia currently shows low STR regulations, specific Airbnb license requirements might still exist or change. Always verify the latest short term rental regulations and Airbnb license requirements directly with local government authorities for Warrnambool to ensure full compliance before hosting.
(Source: AirROI data, 2025, finding no licensed listings among those analyzed)
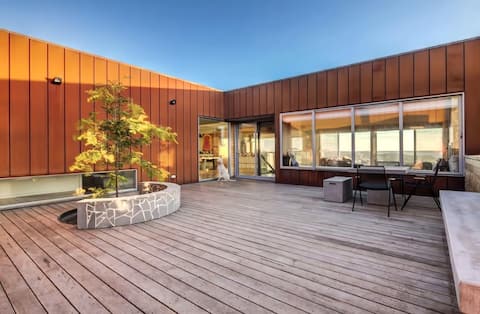
Top Performing Airbnb Properties in Warrnambool (2025)
Benchmark your potential! Explore examples of top-performing Airbnb properties in Warrnamboolbased on Trailing Twelve Month (TTM) revenue. Analyze their characteristics, revenue, occupancy rate, and ADR to understand what drives success in this market.

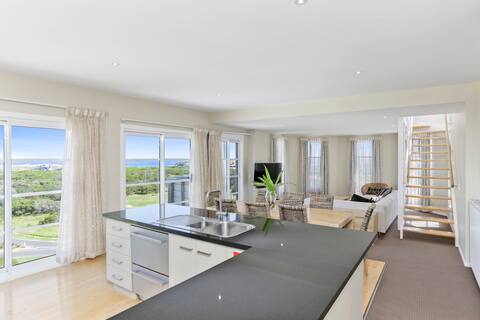
'house by the sea' Warrnambool
Entire Place • 6 bedrooms
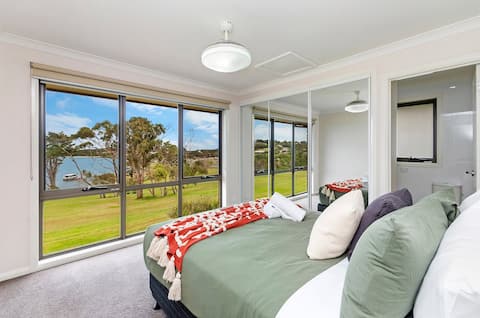
4 Bedroom Ocean View Penthouse
Private Room • 4 bedrooms
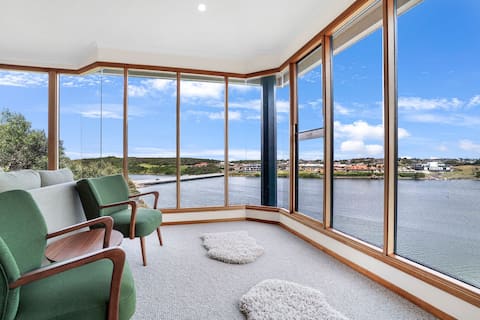
Serendipity
Entire Place • 4 bedrooms
Hopkins View Holiday Home
Entire Place • 4 bedrooms
Riverview
Entire Place • 3 bedrooms
Logans Beach Apartments - BeachHouse
Entire Place • 5 bedrooms
Note: Performance varies based on location, size, amenities, seasonality, and management quality. Data reflects the past 12 months.
Top Performing Airbnb Hosts in Warrnambool (2025)
Learn from the best! This table showcases top-performing Airbnb hosts in Warrnambool based on the number of properties managed and estimated total revenue over the past year. Analyze their scale and performance metrics.
| Host Name | Properties | Grossing Revenue | Stay Reviews | Avg Rating |
|---|---|---|---|---|
| Stephanie | 20 | $596,119 | 408 | 4.32/5.0 |
| Langleys Accommodation | 10 | $359,611 | 248 | 4.83/5.0 |
| Jayde | 4 | $322,330 | 177 | 4.63/5.0 |
| Lorraine | 6 | $284,953 | 890 | 4.78/5.0 |
| Kylie | 1 | $280,358 | 25 | 5.00/5.0 |
| Host #444381069 | 15 | $276,206 | 74 | 2.89/5.0 |
| Alison | 10 | $261,751 | 1435 | 4.74/5.0 |
| The Deep Blue | 4 | $169,750 | 99 | 4.61/5.0 |
| Raj | 7 | $129,132 | 214 | 4.80/5.0 |
| Alison | 2 | $118,371 | 259 | 4.99/5.0 |
Analyzing the strategies of top hosts, such as their property selection, pricing, and guest communication, can offer valuable lessons for optimizing your own Airbnb operations in Warrnambool.
Dive Deeper: Advanced Warrnambool STR Market Data (2025)
Ready to unlock more insights? AirROI provides access to advanced metrics and comprehensive Airbnb data for Warrnambool. Explore detailed analytics beyond this report to refine your investment strategy, optimize pricing, and maximize your vacation rental profits.
Explore Advanced MetricsWarrnambool Short-Term Rental Market Composition (2025): Property & Room Types
Room Type Distribution
Property Type Distribution
Market Composition Insights for Warrnambool
- The Warrnambool Airbnb market composition is heavily skewed towards Entire Home/Apt listings, which make up 92% of the 263 active rentals. This indicates strong guest preference for privacy and space.
- Looking at the property type distribution in Warrnambool, House properties are the most common (58.6%), reflecting the local real estate landscape.
- Houses represent a significant 58.6% portion, catering likely to families or larger groups.
- The presence of 9.9% Hotel/Boutique listings indicates integration with traditional hospitality.
- Smaller segments like others, outdoor/unique (combined 6.0%) offer potential for unique stay experiences.
Warrnambool Airbnb Room Capacity Analysis (2025): Bedroom Distribution
Distribution of Listings by Number of Bedrooms
Room Capacity Insights for Warrnambool
- The dominant room capacity in Warrnambool is 3 bedrooms listings, making up 29.3% of the market. This suggests a strong demand for properties suitable for families or small groups.
- Together, 3 bedrooms and 1 bedroom properties represent 55.2% of the active Airbnb listings in Warrnambool, indicating a high concentration in these sizes.
- A significant 46.0% of listings offer 3+ bedrooms, catering to larger groups and families seeking more space in Warrnambool.
Warrnambool Vacation Rental Guest Capacity Trends (2025)
Distribution of Listings by Guest Capacity
Guest Capacity Insights for Warrnambool
- The most common guest capacity trend in Warrnambool vacation rentals is listings accommodating 6 guests (24.7%). This suggests the primary traveler segment is likely larger groups.
- Properties designed for 6 guests and 2 guests dominate the Warrnambool STR market, accounting for 45.2% of listings.
- 47.9% of properties accommodate 6+ guests, serving the market segment for larger families or group travel in Warrnambool.
- On average, properties in Warrnambool are equipped to host 4.9 guests.
Warrnambool Airbnb Booking Patterns (2025): Available vs. Booked Days
Available Days Distribution
Booked Days Distribution
Booking Pattern Insights for Warrnambool
- The most common availability pattern in Warrnambool falls within the 271-366 days range, representing 33.1% of listings. This suggests many properties have significant open periods on their calendars.
- Approximately 64.7% of listings show high availability (181+ days open annually), indicating potential for increased bookings or specific owner usage patterns.
- For booked days, the 91-180 days range is most frequent in Warrnambool (30.8%), reflecting common guest stay durations or potential owner blocking patterns.
- A notable 37.6% of properties secure long booking periods (181+ days booked per year), highlighting successful long-term rental strategies or significant owner usage.
Warrnambool Airbnb Minimum Stay Requirements Analysis
Distribution of Listings by Minimum Night Requirement
1 Night
60 listings
25.1% of total
2 Nights
57 listings
23.8% of total
3 Nights
12 listings
5% of total
4-6 Nights
11 listings
4.6% of total
7-29 Nights
1 listings
0.4% of total
30+ Nights
98 listings
41% of total
Key Insights
- The most prevalent minimum stay requirement in Warrnambool is 30+ Nights, adopted by 41% of listings. This highlights the market's preference for longer commitments.
- A significant segment (41%) caters to monthly stays (30+ nights) in Warrnambool, pointing to opportunities in the extended-stay market.
Recommendations
- Align with the market by considering a 30+ Nights minimum stay, as 41% of Warrnambool hosts use this setting.
- If feasible, allowing 1-night stays, especially midweek or during low season, could capture last-minute bookings, as only 25.1% currently do.
- Explore offering discounts for stays of 30+ nights to attract the 41% of the market seeking extended stays.
- Adjust minimum nights based on seasonality – potentially shorter during low season and longer during peak demand periods in Warrnambool.
Warrnambool Airbnb Cancellation Policy Trends Analysis (2025)
Super Strict 30 Days
3 listings
1.3% of total
Flexible
76 listings
32.1% of total
Moderate
63 listings
26.6% of total
Firm
42 listings
17.7% of total
Strict
53 listings
22.4% of total
Cancellation Policy Insights for Warrnambool
- The prevailing Airbnb cancellation policy trend in Warrnambool is Flexible, used by 32.1% of listings.
- There's a relatively balanced mix between guest-friendly (58.7%) and stricter (40.1%) policies, offering choices for different guest needs.
Recommendations for Hosts
- Consider adopting a Flexible policy to align with the 32.1% market standard in Warrnambool.
- Regularly review your cancellation policy against competitors and market demand shifts in Warrnambool.
Warrnambool STR Booking Lead Time Analysis (2025)
Average Booking Lead Time by Month
Booking Lead Time Insights for Warrnambool
- The overall average booking lead time for vacation rentals in Warrnambool is 59 days.
- Guests book furthest in advance for stays during April (average 79 days), likely coinciding with peak travel demand or local events.
- The shortest booking windows occur for stays in August (average 32 days), indicating more last-minute travel plans during this time.
- Seasonally, Spring (76 days avg.) sees the longest lead times, while Summer (35 days avg.) has the shortest, reflecting typical travel planning cycles.
Recommendations for Hosts
- Use the overall average lead time (59 days) as a baseline for your pricing and availability strategy in Warrnambool.
- For April stays, consider implementing length-of-stay discounts or slightly higher rates for bookings made less than 79 days out to capitalize on advance planning.
- Target marketing efforts for the Spring season well in advance (at least 76 days) to capture early planners.
- Monitor your own booking lead times against these Warrnambool averages to identify opportunities for dynamic pricing adjustments.
Popular & Essential Airbnb Amenities in Warrnambool (2025)
Amenity Prevalence
Amenity Insights for Warrnambool
- Essential amenities in Warrnambool that guests expect include: TV, Heating, Smoke alarm. Lacking these (any) could significantly impact bookings.
- Popular amenities like Hot water, Free parking on premises, Essentials are common but not universal. Offering these can provide a competitive edge.
- Warning: Wifi is not universally provided but is considered essential globally. Ensure reliable Wifi is offered.
Recommendations for Hosts
- Ensure your listing includes all essential amenities for Warrnambool: TV, Heating, Smoke alarm.
- Prioritize adding missing essentials: TV, Heating, Smoke alarm.
- Consider adding popular differentiators like Hot water or Free parking on premises to increase appeal.
- Highlight unique or less common amenities you offer (e.g., hot tub, dedicated workspace, EV charger) in your listing description and photos.
- Regularly check competitor amenities in Warrnambool to stay competitive.
Warrnambool Airbnb Guest Demographics & Profile Analysis (2025)
Guest Profile Summary for Warrnambool
- The typical guest profile for Airbnb in Warrnambool consists of primarily domestic travelers (84%), often arriving from nearby Melbourne, typically belonging to the Post-2000s (Gen Z/Alpha) group (50%), primarily speaking English or Chinese.
- Domestic travelers account for 83.9% of guests.
- Key international markets include Australia (83.9%) and Singapore (3.7%).
- Top languages spoken are English (63.4%) followed by Chinese (10.3%).
- A significant demographic segment is the Post-2000s (Gen Z/Alpha) group, representing 50% of guests.
Recommendations for Hosts
- Target domestic marketing efforts towards travelers from Melbourne and Victoria.
- Tailor amenities and listing descriptions to appeal to the dominant Post-2000s (Gen Z/Alpha) demographic (e.g., highlight fast WiFi, smart home features, local guides).
- Highlight unique local experiences or amenities relevant to the primary guest profile.
- Consider seasonal promotions aligned with peak travel times for key origin markets.
Nearby Short-Term Rental Market Comparison
How does the Warrnambool Airbnb market stack up against its neighbors? Compare key performance metrics like average monthly revenue, ADR, and occupancy rates in surrounding areas to understand the broader regional STR landscape.
| Market | Active Properties | Monthly Revenue | Daily Rate | Avg. Occupancy |
|---|---|---|---|---|
| King Island Council | 11 | $5,231 | $550.50 | 37% |
| Shire of Colac Otway | 372 | $2,948 | $292.68 | 38% |
| Buninyong | 12 | $2,872 | $169.56 | 48% |
| Lorne | 365 | $2,801 | $395.21 | 33% |
| Port Campbell | 123 | $2,763 | $243.95 | 39% |
| Halls Gap | 184 | $2,669 | $191.17 | 45% |
| Forrest | 31 | $2,567 | $174.06 | 47% |
| Timboon | 16 | $2,525 | $184.54 | 41% |
| Apollo Bay | 412 | $2,511 | $261.55 | 37% |
| Shire of Moyne | 52 | $2,390 | $227.32 | 40% |