Wandiligong Airbnb Market Analysis 2025: Short Term Rental Data & Vacation Rental Statistics in Victoria, Australia
Is Airbnb profitable in Wandiligong in 2025? Explore comprehensive Airbnb analytics for Wandiligong, Victoria, Australia to uncover income potential. This 2025 STR market report for Wandiligong, based on AirROI data from April 2024 to March 2025, reveals key trends in the niche market of 20 active listings.
Whether you're considering an Airbnb investment in Wandiligong, optimizing your existing vacation rental, or exploring rental arbitrage opportunities, understanding the Wandiligong Airbnb data is crucial. Leveraging the low regulation environment is key to maximizing your short term rental income potential. Let's dive into the specifics.
Key Wandiligong Airbnb Performance Metrics Overview
Monthly Airbnb Revenue Variations & Income Potential in Wandiligong (2025)
Understanding the monthly revenue variations for Airbnb listings in Wandiligong is key to maximizing your short term rental income potential. Seasonality significantly impacts earnings. Our analysis, based on data from the past 12 months, shows that the peak revenue month for STRs in Wandiligong is typically July, while February often presents the lowest earnings, highlighting opportunities for strategic pricing adjustments during shoulder and low seasons. Explore the typical Airbnb income in Wandiligong across different performance tiers:
- Best-in-class properties (Top 10%) achieve $6,121+ monthly, often utilizing dynamic pricing and superior guest experiences.
- Strong performing properties (Top 25%) earn $4,333 or more, indicating effective management and desirable locations/amenities.
- Typical properties (Median) generate around $2,986 per month, representing the average market performance.
- Entry-level properties (Bottom 25%) see earnings around $1,818, often with potential for optimization.
Average Monthly Airbnb Earnings Trend in Wandiligong
Wandiligong Airbnb Occupancy Rate Trends (2025)
Maximize your bookings by understanding the Wandiligong STR occupancy trends. Seasonal demand shifts significantly influence how often properties are booked. Typically, Julysees the highest demand (peak season occupancy), while May experiences the lowest (low season). Effective strategies, like adjusting minimum stays or offering promotions, can boost occupancy during slower periods. Here's how different property tiers perform in Wandiligong:
- Best-in-class properties (Top 10%) achieve 78%+ occupancy, indicating high desirability and potentially optimized availability.
- Strong performing properties (Top 25%) maintain 58% or higher occupancy, suggesting good market fit and guest satisfaction.
- Typical properties (Median) have an occupancy rate around 33%.
- Entry-level properties (Bottom 25%) average 22% occupancy, potentially facing higher vacancy.
Average Monthly Occupancy Rate Trend in Wandiligong
Average Daily Rate (ADR) Airbnb Trends in Wandiligong (2025)
Effective short term rental pricing strategy in Wandiligong involves understanding monthly ADR fluctuations. The Average Daily Rate (ADR) for Airbnb in Wandiligong typically peaks in January and dips lowest during May. Leveraging Airbnb dynamic pricing tools or strategies based on this seasonality can significantly boost revenue. Here's a look at the typical nightly rates achieved:
- Best-in-class properties (Top 10%) command rates of $369+ per night, often due to premium features or locations.
- Strong performing properties (Top 25%) achieve nightly rates of $315 or more.
- Typical properties (Median) charge around $245 per night.
- Entry-level properties (Bottom 25%) earn around $170 per night.
Average Daily Rate (ADR) Trend by Month in Wandiligong
Get Live Wandiligong Market Intelligence 👇
Explore Real-time Analytics
Airbnb Seasonality Analysis & Trends in Wandiligong (2025)
Peak Season (July, April, January)
- Revenue averages $4,270 per month
- Occupancy rates average 51.6%
- Daily rates average $261
Shoulder Season
- Revenue averages $3,310 per month
- Occupancy maintains around 39.1%
- Daily rates hold near $256
Low Season (February, September, October)
- Revenue drops to average $2,420 per month
- Occupancy decreases to average 32.8%
- Daily rates adjust to average $250
Seasonality Insights for Wandiligong
- The Airbnb seasonality in Wandiligong shows highly seasonal trends requiring careful strategy. While the sections above show seasonal averages, it's also insightful to look at the extremes:
- During the high season, the absolute peak month showcases Wandiligong's highest earning potential, with monthly revenues capable of climbing to $4,695, occupancy reaching a high of 56.1%, and ADRs peaking at $277.
- Conversely, the slowest single month of the year, typically falling within the low season, marks the market's lowest point. In this month, revenue might dip to $1,909, occupancy could drop to 32.4%, and ADRs may adjust down to $243.
- Understanding both the seasonal averages and these monthly peaks and troughs in revenue, occupancy, and ADR is crucial for maximizing your Airbnb profit potential in Wandiligong.
Seasonal Strategies for Maximizing Profit
- Peak Season: Maximize revenue through premium pricing and potentially longer minimum stays. Ensure high availability.
- Low Season: Offer competitive pricing, special promotions (e.g., extended stay discounts), and flexible cancellation policies. Target off-season travelers like remote workers or budget-conscious guests.
- Shoulder Seasons: Implement dynamic pricing that balances peak and low rates. Target weekend travelers or specific events. Offer slightly more flexible terms than peak season.
- Regularly analyze your own performance against these Wandiligong seasonality benchmarks and adjust your pricing and availability strategy accordingly.
Best Areas for Airbnb Investment in Wandiligong (2025)
Exploring the top neighborhoods for short-term rentals in Wandiligong? This section highlights key areas, outlining why they are attractive for hosts and guests, along with notable local attractions. Consider these locations based on your target guest profile and investment strategy.
| Neighborhood / Area | Why Host Here? (Target Guests & Appeal) | Key Attractions & Landmarks |
|---|---|---|
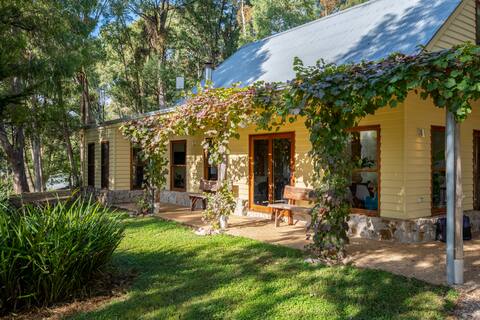
| Wandiligong Village | A picturesque village surrounded by the Great Alpine National Park, perfect for nature lovers and those seeking a tranquil escape. Ideal for families and outdoor enthusiasts looking for hiking, biking, and seasonal festivals. | Wandiligong Nut Festival, Mansfield Zoo, Great Alpine Road, Hotham Alpine Resort, Wandiligong Heritage Trail, Wandiligong River |
| Mount Buffalo | Famous for its stunning national park and breathtaking views. A hotspot for outdoor adventure seekers, particularly in summer and winter seasons. Attracts tourists for hiking, climbing, and snow sports. | Mount Buffalo National Park, The Horn, Buffalo Plateau, Pound Bend, Gorge Scenic Drive, Lake Catani |
| Bright | A vibrant town known for its scenic beauty and outdoor activities, particularly during autumn when the leaves change colors. A popular destination for tourists and families looking for adventure and relaxation. | Bright Brewery, Bright Splash Park, Canyon Walk, Mount Buffalo, Wandiligong Nut Festival, Bright Market |
| Lake Hume | Major recreational lake known for its water sports and picturesque surroundings. Appeals to families and individuals looking for a relaxing lakeside getaway with activities like fishing, boating, and picnicking. | Lake Hume Resort, Boat ramp access, Fishing spots, Hume Weir, Hume Dam, Cycle trails |
| Dederang | A quaint town perfect for a peaceful rural retreat. Known for its farming community and proximity to the Alpine region, making it ideal for visitors seeking a true Australian countryside experience. | Dederang Hotel, Alpine View, Kiewa River, Dederang Cemetery, Rural landscapes |
| Porepunkah | Located near Bright and Mount Buffalo, this small town offers access to stunning scenery and outdoor activities. Appealing to tourists looking to explore the surrounding national parks and wineries. | Porepunkah Hotel, Ovens River, Mount Buffalo National Park, Walking trails, Local vineyards |
| Myrtleford | A charming town known for its rich agricultural heritage and beautiful surroundings. Attracts tourists for its vibrant community and access to outdoor adventures in the nearby mountains. | Myrtleford Butter Factory, Culinary experiences, Beechworth Trail, Murray to Mountains Rail Trail, Myrtleford Ski Club |
| Albury | A larger regional city offering urban amenities with access to the outdoors. Appeals to those looking for both city and nature experiences, making it ideal for travelers and business visitors alike. | Albury Botanic Gardens, Murray Art Museum, Albury Entertainment Centre, SS&A Club, Lake Hume |
Understanding Airbnb License Requirements & STR Laws in Wandiligong (2025)
While Wandiligong, Victoria, Australia currently shows low STR regulations, specific Airbnb license requirements might still exist or change. Always verify the latest short term rental regulations and Airbnb license requirements directly with local government authorities for Wandiligong to ensure full compliance before hosting.
(Source: AirROI data, 2025, finding no licensed listings among those analyzed)
Top Performing Airbnb Properties in Wandiligong (2025)
Benchmark your potential! Explore examples of top-performing Airbnb properties in Wandiligongbased on Trailing Twelve Month (TTM) revenue. Analyze their characteristics, revenue, occupancy rate, and ADR to understand what drives success in this market.
Tonga Park Retreat - Breathtaking views & style
Entire Place • 2 bedrooms
Edelweiss
Entire Place • 3 bedrooms
6 Beers Lane~Pet friendly
Entire Place • 2 bedrooms
Centenary Heights
Entire Place • 3 bedrooms
Tree View Cottage - Serenity and charm
Entire Place • 2 bedrooms
Cranmore Cottage - Pet friendly in beautiful Wandi
Entire Place • 3 bedrooms
Note: Performance varies based on location, size, amenities, seasonality, and management quality. Data reflects the past 12 months.
Top Performing Airbnb Hosts in Wandiligong (2025)
Learn from the best! This table showcases top-performing Airbnb hosts in Wandiligong based on the number of properties managed and estimated total revenue over the past year. Analyze their scale and performance metrics.
| Host Name | Properties | Grossing Revenue | Stay Reviews | Avg Rating |
|---|---|---|---|---|
| Emma : Alpine Valley Getaways | 6 | $247,305 | 193 | 4.96/5.0 |
| Bright | 3 | $140,906 | 76 | 4.81/5.0 |
| Sue | 2 | $63,277 | 32 | 4.99/5.0 |
| Matthew | 1 | $54,924 | 136 | 4.94/5.0 |
| Priscilla | 1 | $52,828 | 98 | 4.92/5.0 |
| Susan | 1 | $48,803 | 119 | 4.96/5.0 |
| Bright-Holidays | 2 | $41,933 | 26 | 4.22/5.0 |
| Cavell | 1 | $33,124 | 194 | 4.60/5.0 |
| Mariane | 1 | $27,381 | 46 | 4.96/5.0 |
| Marcus | 1 | $23,401 | 56 | 4.64/5.0 |
Analyzing the strategies of top hosts, such as their property selection, pricing, and guest communication, can offer valuable lessons for optimizing your own Airbnb operations in Wandiligong.
Dive Deeper: Advanced Wandiligong STR Market Data (2025)
Ready to unlock more insights? AirROI provides access to advanced metrics and comprehensive Airbnb data for Wandiligong. Explore detailed analytics beyond this report to refine your investment strategy, optimize pricing, and maximize your vacation rental profits.
Explore Advanced MetricsWandiligong Short-Term Rental Market Composition (2025): Property & Room Types
Room Type Distribution
Property Type Distribution
Market Composition Insights for Wandiligong
- The Wandiligong Airbnb market composition is heavily skewed towards Entire Home/Apt listings, which make up 100% of the 20 active rentals. This indicates strong guest preference for privacy and space.
- Looking at the property type distribution in Wandiligong, House properties are the most common (95%), reflecting the local real estate landscape.
- Houses represent a significant 95% portion, catering likely to families or larger groups.
Wandiligong Airbnb Room Capacity Analysis (2025): Bedroom Distribution
Distribution of Listings by Number of Bedrooms
Room Capacity Insights for Wandiligong
- The dominant room capacity in Wandiligong is 3 bedrooms listings, making up 50% of the market. This suggests a strong demand for properties suitable for families or small groups.
- Together, 3 bedrooms and 2 bedrooms properties represent 75.0% of the active Airbnb listings in Wandiligong, indicating a high concentration in these sizes.
- A significant 50.0% of listings offer 3+ bedrooms, catering to larger groups and families seeking more space in Wandiligong.
Wandiligong Vacation Rental Guest Capacity Trends (2025)
Distribution of Listings by Guest Capacity
Guest Capacity Insights for Wandiligong
- The most common guest capacity trend in Wandiligong vacation rentals is listings accommodating 4 guests (30%). This suggests the primary traveler segment is likely small families or groups.
- Properties designed for 4 guests and 6 guests dominate the Wandiligong STR market, accounting for 55.0% of listings.
- 50.0% of properties accommodate 6+ guests, serving the market segment for larger families or group travel in Wandiligong.
- On average, properties in Wandiligong are equipped to host 5.0 guests.
Wandiligong Airbnb Booking Patterns (2025): Available vs. Booked Days
Available Days Distribution
Booked Days Distribution
Booking Pattern Insights for Wandiligong
- The most common availability pattern in Wandiligong falls within the 181-270 days range, representing 45% of listings. This suggests many properties have significant open periods on their calendars.
- Approximately 70.0% of listings show high availability (181+ days open annually), indicating potential for increased bookings or specific owner usage patterns.
- For booked days, the 91-180 days range is most frequent in Wandiligong (50%), reflecting common guest stay durations or potential owner blocking patterns.
- A notable 30.0% of properties secure long booking periods (181+ days booked per year), highlighting successful long-term rental strategies or significant owner usage.
Wandiligong Airbnb Minimum Stay Requirements Analysis
Distribution of Listings by Minimum Night Requirement
1 Night
1 listings
5.3% of total
2 Nights
5 listings
26.3% of total
3 Nights
3 listings
15.8% of total
30+ Nights
10 listings
52.6% of total
Key Insights
- The most prevalent minimum stay requirement in Wandiligong is 30+ Nights, adopted by 52.6% of listings. This highlights the market's preference for longer commitments.
- A significant segment (52.6%) caters to monthly stays (30+ nights) in Wandiligong, pointing to opportunities in the extended-stay market.
Recommendations
- Align with the market by considering a 30+ Nights minimum stay, as 52.6% of Wandiligong hosts use this setting.
- If feasible, allowing 1-night stays, especially midweek or during low season, could capture last-minute bookings, as only 5.3% currently do.
- Explore offering discounts for stays of 30+ nights to attract the 52.6% of the market seeking extended stays.
- Adjust minimum nights based on seasonality – potentially shorter during low season and longer during peak demand periods in Wandiligong.
Wandiligong Airbnb Cancellation Policy Trends Analysis (2025)
Super Strict 30 Days
1 listings
5.3% of total
Flexible
2 listings
10.5% of total
Moderate
2 listings
10.5% of total
Firm
3 listings
15.8% of total
Strict
11 listings
57.9% of total
Cancellation Policy Insights for Wandiligong
- The prevailing Airbnb cancellation policy trend in Wandiligong is Strict, used by 57.9% of listings.
- A majority (73.7%) of hosts in Wandiligong utilize Firm or Strict policies, indicating a market where hosts prioritize booking security.
Recommendations for Hosts
- Consider adopting a Strict policy to align with the 57.9% market standard in Wandiligong.
- With 57.9% using Strict terms, this is a viable option in Wandiligong, particularly for high-value properties or during peak demand periods.
- Regularly review your cancellation policy against competitors and market demand shifts in Wandiligong.
Wandiligong STR Booking Lead Time Analysis (2025)
Average Booking Lead Time by Month
Booking Lead Time Insights for Wandiligong
- The overall average booking lead time for vacation rentals in Wandiligong is 57 days.
- Guests book furthest in advance for stays during November (average 102 days), likely coinciding with peak travel demand or local events.
- The shortest booking windows occur for stays in August (average 31 days), indicating more last-minute travel plans during this time.
- Seasonally, Fall (80 days avg.) sees the longest lead times, while Summer (41 days avg.) has the shortest, reflecting typical travel planning cycles.
Recommendations for Hosts
- Use the overall average lead time (57 days) as a baseline for your pricing and availability strategy in Wandiligong.
- For November stays, consider implementing length-of-stay discounts or slightly higher rates for bookings made less than 102 days out to capitalize on advance planning.
- Target marketing efforts for the Fall season well in advance (at least 80 days) to capture early planners.
- Monitor your own booking lead times against these Wandiligong averages to identify opportunities for dynamic pricing adjustments.
Popular & Essential Airbnb Amenities in Wandiligong (2025)
Amenity Prevalence
Amenity Insights for Wandiligong
- Essential amenities in Wandiligong that guests expect include: Heating, Kitchen, TV, Air conditioning, Washer. Lacking these (any) could significantly impact bookings.
- Popular amenities like Hot water, Free parking on premises, Cooking basics are common but not universal. Offering these can provide a competitive edge.
Recommendations for Hosts
- Ensure your listing includes all essential amenities for Wandiligong: Heating, Kitchen, TV, Air conditioning, Washer.
- Prioritize adding missing essentials: TV, Air conditioning, Washer.
- Consider adding popular differentiators like Hot water or Free parking on premises to increase appeal.
- Highlight unique or less common amenities you offer (e.g., hot tub, dedicated workspace, EV charger) in your listing description and photos.
- Regularly check competitor amenities in Wandiligong to stay competitive.
Wandiligong Airbnb Guest Demographics & Profile Analysis (2025)
Guest Profile Summary for Wandiligong
- The typical guest profile for Airbnb in Wandiligong consists of primarily domestic travelers (95%), often arriving from nearby Melbourne, typically belonging to the Post-2000s (Gen Z/Alpha) group (50%), primarily speaking English or Spanish.
- Domestic travelers account for 95.3% of guests.
- Key international markets include Australia (95.3%) and United Kingdom (2.3%).
- Top languages spoken are English (69.2%) followed by Spanish (6.5%).
- A significant demographic segment is the Post-2000s (Gen Z/Alpha) group, representing 50% of guests.
Recommendations for Hosts
- Target domestic marketing efforts towards travelers from Melbourne and Victoria.
- Tailor amenities and listing descriptions to appeal to the dominant Post-2000s (Gen Z/Alpha) demographic (e.g., highlight fast WiFi, smart home features, local guides).
- Highlight unique local experiences or amenities relevant to the primary guest profile.
- Consider seasonal promotions aligned with peak travel times for key origin markets.
Nearby Short-Term Rental Market Comparison
How does the Wandiligong Airbnb market stack up against its neighbors? Compare key performance metrics like average monthly revenue, ADR, and occupancy rates in surrounding areas to understand the broader regional STR landscape.
| Market | Active Properties | Monthly Revenue | Daily Rate | Avg. Occupancy |
|---|---|---|---|---|
| Howqua Inlet | 13 | $3,634 | $322.01 | 37% |
| Bright | 474 | $3,468 | $294.34 | 42% |
| Porepunkah | 40 | $3,397 | $328.54 | 37% |
| Nagambie | 33 | $3,381 | $300.42 | 40% |
| Shire of Mansfield | 89 | $3,347 | $392.77 | 34% |
| Shire of Strathbogie | 43 | $3,173 | $314.72 | 37% |
| Jamieson | 37 | $3,138 | $283.80 | 33% |
| Shire of Murrindindi | 70 | $3,061 | $268.84 | 40% |
| Beechworth | 110 | $3,056 | $251.89 | 41% |
| Sawmill Settlement | 92 | $3,033 | $408.14 | 32% |