Sunset Strip Airbnb Market Analysis 2025: Short Term Rental Data & Vacation Rental Statistics in Victoria, Australia
Is Airbnb profitable in Sunset Strip in 2025? Explore comprehensive Airbnb analytics for Sunset Strip, Victoria, Australia to uncover income potential. This 2025 STR market report for Sunset Strip, based on AirROI data from April 2024 to March 2025, reveals key trends in the niche market of 27 active listings.
Whether you're considering an Airbnb investment in Sunset Strip, optimizing your existing vacation rental, or exploring rental arbitrage opportunities, understanding the Sunset Strip Airbnb data is crucial. Leveraging the low regulation environment is key to maximizing your short term rental income potential. Let's dive into the specifics.
Key Sunset Strip Airbnb Performance Metrics Overview
Monthly Airbnb Revenue Variations & Income Potential in Sunset Strip (2025)
Understanding the monthly revenue variations for Airbnb listings in Sunset Strip is key to maximizing your short term rental income potential. Seasonality significantly impacts earnings. Our analysis, based on data from the past 12 months, shows that the peak revenue month for STRs in Sunset Strip is typically January, while August often presents the lowest earnings, highlighting opportunities for strategic pricing adjustments during shoulder and low seasons. Explore the typical Airbnb income in Sunset Strip across different performance tiers:
- Best-in-class properties (Top 10%) achieve $3,747+ monthly, often utilizing dynamic pricing and superior guest experiences.
- Strong performing properties (Top 25%) earn $2,896 or more, indicating effective management and desirable locations/amenities.
- Typical properties (Median) generate around $1,646 per month, representing the average market performance.
- Entry-level properties (Bottom 25%) see earnings around $889, often with potential for optimization.
Average Monthly Airbnb Earnings Trend in Sunset Strip
Sunset Strip Airbnb Occupancy Rate Trends (2025)
Maximize your bookings by understanding the Sunset Strip STR occupancy trends. Seasonal demand shifts significantly influence how often properties are booked. Typically, Januarysees the highest demand (peak season occupancy), while June experiences the lowest (low season). Effective strategies, like adjusting minimum stays or offering promotions, can boost occupancy during slower periods. Here's how different property tiers perform in Sunset Strip:
- Best-in-class properties (Top 10%) achieve 64%+ occupancy, indicating high desirability and potentially optimized availability.
- Strong performing properties (Top 25%) maintain 49% or higher occupancy, suggesting good market fit and guest satisfaction.
- Typical properties (Median) have an occupancy rate around 31%.
- Entry-level properties (Bottom 25%) average 17% occupancy, potentially facing higher vacancy.
Average Monthly Occupancy Rate Trend in Sunset Strip
Average Daily Rate (ADR) Airbnb Trends in Sunset Strip (2025)
Effective short term rental pricing strategy in Sunset Strip involves understanding monthly ADR fluctuations. The Average Daily Rate (ADR) for Airbnb in Sunset Strip typically peaks in January and dips lowest during March. Leveraging Airbnb dynamic pricing tools or strategies based on this seasonality can significantly boost revenue. Here's a look at the typical nightly rates achieved:
- Best-in-class properties (Top 10%) command rates of $356+ per night, often due to premium features or locations.
- Strong performing properties (Top 25%) achieve nightly rates of $245 or more.
- Typical properties (Median) charge around $187 per night.
- Entry-level properties (Bottom 25%) earn around $145 per night.
Average Daily Rate (ADR) Trend by Month in Sunset Strip
Get Live Sunset Strip Market Intelligence 👇

Explore Real-time Analytics
Airbnb Seasonality Analysis & Trends in Sunset Strip (2025)
Peak Season (January, December, October)
- Revenue averages $3,078 per month
- Occupancy rates average 45.8%
- Daily rates average $237
Shoulder Season
- Revenue averages $1,832 per month
- Occupancy maintains around 32.7%
- Daily rates hold near $203
Low Season (June, August, September)
- Revenue drops to average $1,368 per month
- Occupancy decreases to average 25.9%
- Daily rates adjust to average $202
Seasonality Insights for Sunset Strip
- The Airbnb seasonality in Sunset Strip shows highly seasonal trends requiring careful strategy. While the sections above show seasonal averages, it's also insightful to look at the extremes:
- During the high season, the absolute peak month showcases Sunset Strip's highest earning potential, with monthly revenues capable of climbing to $3,852, occupancy reaching a high of 57.4%, and ADRs peaking at $250.
- Conversely, the slowest single month of the year, typically falling within the low season, marks the market's lowest point. In this month, revenue might dip to $1,218, occupancy could drop to 22.3%, and ADRs may adjust down to $192.
- Understanding both the seasonal averages and these monthly peaks and troughs in revenue, occupancy, and ADR is crucial for maximizing your Airbnb profit potential in Sunset Strip.
Seasonal Strategies for Maximizing Profit
- Peak Season: Maximize revenue through premium pricing and potentially longer minimum stays. Ensure high availability.
- Low Season: Offer competitive pricing, special promotions (e.g., extended stay discounts), and flexible cancellation policies. Target off-season travelers like remote workers or budget-conscious guests.
- Shoulder Seasons: Implement dynamic pricing that balances peak and low rates. Target weekend travelers or specific events. Offer slightly more flexible terms than peak season.
- Regularly analyze your own performance against these Sunset Strip seasonality benchmarks and adjust your pricing and availability strategy accordingly.
Best Areas for Airbnb Investment in Sunset Strip (2025)
Exploring the top neighborhoods for short-term rentals in Sunset Strip? This section highlights key areas, outlining why they are attractive for hosts and guests, along with notable local attractions. Consider these locations based on your target guest profile and investment strategy.
| Neighborhood / Area | Why Host Here? (Target Guests & Appeal) | Key Attractions & Landmarks |
|---|---|---|
| Sunset Strip | A vibrant and trendy area known for its bustling nightlife and entertainment options. Popular with tourists seeking a lively atmosphere and close proximity to iconic attractions. | The Viper Room, Whisky a Go Go, Roxy Theatre, Sunset Plaza, Skybar at Mondrian, House of Blues |
| West Hollywood | Famous for its chic atmosphere and diverse dining and shopping options. Attracts a wide range of visitors, from celebrities to tourists looking for a glamorous experience. | Melrose Avenue, Sunset Boulevard, The Abbey, WeHo Pride Parade, Gamble House, West Hollywood Library |
| Beverly Hills | Known for luxury shopping and celebrity sightings. A prime destination for those wanting to experience the high life and Hollywood glamour. | Rodeo Drive, Beverly Hills Hotel, Greystone Mansion, Will Rogers Memorial Park, Beverly Gardens Park, Spadena House |
| Hollywood Hills | Offers stunning views and a quiet retreat while being close to the action of Hollywood. A favorite for travelers looking for a scenic and exclusive stay. | Runyon Canyon, Griffith Observatory, Hollywood Sign, Sunset Ranch Hollywood, The Magic Castle, Hollywood Walk of Fame |
| Universal City | Close to Universal Studios and other attractions, making it a great choice for families and entertainment enthusiasts. Offers a range of dining and shopping experiences. | Universal Studios Hollywood, CityWalk Hollywood, The Wizarding World of Harry Potter, Jaws Ride, Despicable Me Minion Mayhem, Kung Fu Panda Adventure |
| Silver Lake | Known for its artistic vibe and eclectic shops, this hip neighborhood attracts young creatives and offers a unique experience away from the typical tourist spots. | Silver Lake Reservoir, Griffith Park, Sunset Junction, Echo Park Lake, Neon Retro Arcade, Los Angeles River |
| Laurel Canyon | A historic area with a rich musical legacy and beautiful homes. Popular with those seeking a serene environment while still being close to the city. | Laurel Canyon Park, The Canyon, Woodland Drive, Old Laurel Canyon Road, Folk Music Hall of Fame, Morris’s Trail |
| The Grove | A popular outdoor shopping and entertainment complex offering a range of dining, shopping, and entertainment options. Suitable for all types of travelers. | The Grove Outdoor Mall, Farmers Market, TCL Chinese Theatre, Los Angeles Museum of the Holocaust, Melrose Trading Post, The Americana at Brand |
Understanding Airbnb License Requirements & STR Laws in Sunset Strip (2025)
While Sunset Strip, Victoria, Australia currently shows low STR regulations, specific Airbnb license requirements might still exist or change. Always verify the latest short term rental regulations and Airbnb license requirements directly with local government authorities for Sunset Strip to ensure full compliance before hosting.
(Source: AirROI data, 2025, finding no licensed listings among those analyzed)
Top Performing Airbnb Properties in Sunset Strip (2025)
Benchmark your potential! Explore examples of top-performing Airbnb properties in Sunset Stripbased on Trailing Twelve Month (TTM) revenue. Analyze their characteristics, revenue, occupancy rate, and ADR to understand what drives success in this market.
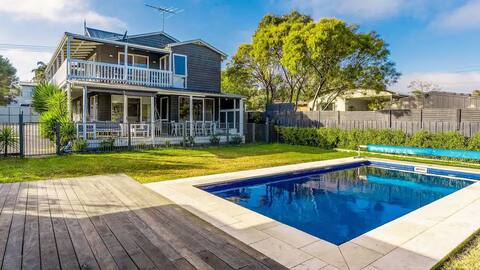
The Birkdale with Heated Pool by Ready Set Stay
Entire Place • 4 bedrooms

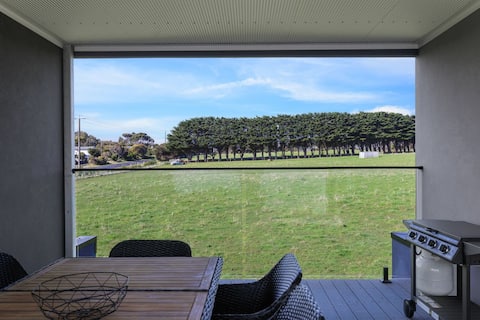
Yoga, Gym, Sauna and Ice Plunge- Recovery Retreat
Entire Place • 1 bedroom
Smiths Island Retreat
Entire Place • 4 bedrooms
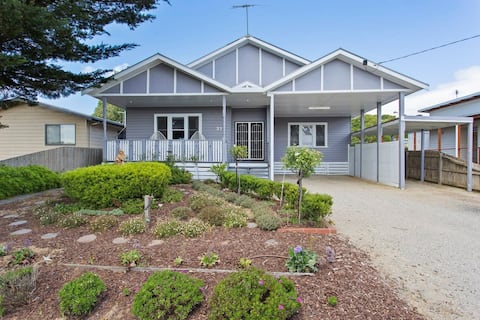
4-Bed 3-Bath Sunset Haven
Entire Place • 4 bedrooms
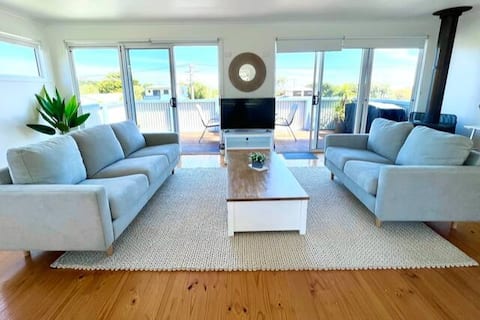
Light and bright 4 bedroom home, close to beach
Entire Place • 4 bedrooms

Tiny Home Experience
Entire Place • 1 bedroom
Note: Performance varies based on location, size, amenities, seasonality, and management quality. Data reflects the past 12 months.
Top Performing Airbnb Hosts in Sunset Strip (2025)
Learn from the best! This table showcases top-performing Airbnb hosts in Sunset Strip based on the number of properties managed and estimated total revenue over the past year. Analyze their scale and performance metrics.
| Host Name | Properties | Grossing Revenue | Stay Reviews | Avg Rating |
|---|---|---|---|---|
| Joel & Caleb | 3 | $56,678 | 23 | 4.42/5.0 |
| Ready Set Stay | 1 | $46,430 | 5 | 4.80/5.0 |
| Vic & Deb | 2 | $41,597 | 643 | 4.92/5.0 |
| Ashlea | 1 | $37,912 | 212 | 4.99/5.0 |
| Mathijs | 1 | $35,641 | 46 | 4.87/5.0 |
| Athanasia | 1 | $35,350 | 44 | 4.82/5.0 |
| Caitlin | 1 | $31,164 | 24 | 4.92/5.0 |
| Host Easy BnB | 1 | $29,490 | 11 | 4.73/5.0 |
| Sharon | 1 | $26,596 | 67 | 4.67/5.0 |
| Judy | 1 | $24,092 | 22 | 4.95/5.0 |
Analyzing the strategies of top hosts, such as their property selection, pricing, and guest communication, can offer valuable lessons for optimizing your own Airbnb operations in Sunset Strip.
Dive Deeper: Advanced Sunset Strip STR Market Data (2025)
Ready to unlock more insights? AirROI provides access to advanced metrics and comprehensive Airbnb data for Sunset Strip. Explore detailed analytics beyond this report to refine your investment strategy, optimize pricing, and maximize your vacation rental profits.
Explore Advanced MetricsSunset Strip Short-Term Rental Market Composition (2025): Property & Room Types
Room Type Distribution
Property Type Distribution
Market Composition Insights for Sunset Strip
- The Sunset Strip Airbnb market composition is heavily skewed towards Entire Home/Apt listings, which make up 96.3% of the 27 active rentals. This indicates strong guest preference for privacy and space.
- Looking at the property type distribution in Sunset Strip, House properties are the most common (81.5%), reflecting the local real estate landscape.
- Houses represent a significant 81.5% portion, catering likely to families or larger groups.
- The presence of 7.4% Hotel/Boutique listings indicates integration with traditional hospitality.
- Smaller segments like others, apartment/condo, unique stays (combined 11.1%) offer potential for unique stay experiences.
Sunset Strip Airbnb Room Capacity Analysis (2025): Bedroom Distribution
Distribution of Listings by Number of Bedrooms
Room Capacity Insights for Sunset Strip
- The dominant room capacity in Sunset Strip is 3 bedrooms listings, making up 37% of the market. This suggests a strong demand for properties suitable for families or small groups.
- Together, 3 bedrooms and 4 bedrooms properties represent 59.2% of the active Airbnb listings in Sunset Strip, indicating a high concentration in these sizes.
- A significant 66.6% of listings offer 3+ bedrooms, catering to larger groups and families seeking more space in Sunset Strip.
Sunset Strip Vacation Rental Guest Capacity Trends (2025)
Distribution of Listings by Guest Capacity
Guest Capacity Insights for Sunset Strip
- The most common guest capacity trend in Sunset Strip vacation rentals is listings accommodating 8+ guests (40.7%). This suggests the primary traveler segment is likely larger groups.
- Properties designed for 8+ guests and 6 guests dominate the Sunset Strip STR market, accounting for 59.2% of listings.
- 66.6% of properties accommodate 6+ guests, serving the market segment for larger families or group travel in Sunset Strip.
- On average, properties in Sunset Strip are equipped to host 5.9 guests.
Sunset Strip Airbnb Booking Patterns (2025): Available vs. Booked Days
Available Days Distribution
Booked Days Distribution
Booking Pattern Insights for Sunset Strip
- The most common availability pattern in Sunset Strip falls within the 181-270 days range, representing 48.1% of listings. This suggests many properties have significant open periods on their calendars.
- Approximately 88.8% of listings show high availability (181+ days open annually), indicating potential for increased bookings or specific owner usage patterns.
- For booked days, the 91-180 days range is most frequent in Sunset Strip (48.1%), reflecting common guest stay durations or potential owner blocking patterns.
- A notable 11.1% of properties secure long booking periods (181+ days booked per year), highlighting successful long-term rental strategies or significant owner usage.
Sunset Strip Airbnb Minimum Stay Requirements Analysis
Distribution of Listings by Minimum Night Requirement
1 Night
3 listings
11.5% of total
2 Nights
10 listings
38.5% of total
3 Nights
2 listings
7.7% of total
30+ Nights
11 listings
42.3% of total
Key Insights
- The most prevalent minimum stay requirement in Sunset Strip is 30+ Nights, adopted by 42.3% of listings. This highlights the market's preference for longer commitments.
- A significant segment (42.3%) caters to monthly stays (30+ nights) in Sunset Strip, pointing to opportunities in the extended-stay market.
Recommendations
- Align with the market by considering a 30+ Nights minimum stay, as 42.3% of Sunset Strip hosts use this setting.
- If feasible, allowing 1-night stays, especially midweek or during low season, could capture last-minute bookings, as only 11.5% currently do.
- A 2-night minimum appears standard (38.5%). Consider this for weekends or peak periods.
- Explore offering discounts for stays of 30+ nights to attract the 42.3% of the market seeking extended stays.
- Adjust minimum nights based on seasonality – potentially shorter during low season and longer during peak demand periods in Sunset Strip.
Sunset Strip Airbnb Cancellation Policy Trends Analysis (2025)
Super Strict 30 Days
1 listings
3.8% of total
Flexible
2 listings
7.7% of total
Moderate
9 listings
34.6% of total
Firm
5 listings
19.2% of total
Strict
9 listings
34.6% of total
Cancellation Policy Insights for Sunset Strip
- The prevailing Airbnb cancellation policy trend in Sunset Strip is Moderate, used by 34.6% of listings.
- A majority (53.8%) of hosts in Sunset Strip utilize Firm or Strict policies, indicating a market where hosts prioritize booking security.
Recommendations for Hosts
- Consider adopting a Moderate policy to align with the 34.6% market standard in Sunset Strip.
- With 34.6% using Strict terms, this is a viable option in Sunset Strip, particularly for high-value properties or during peak demand periods.
- Regularly review your cancellation policy against competitors and market demand shifts in Sunset Strip.
Sunset Strip STR Booking Lead Time Analysis (2025)
Average Booking Lead Time by Month
Booking Lead Time Insights for Sunset Strip
- The overall average booking lead time for vacation rentals in Sunset Strip is 40 days.
- Guests book furthest in advance for stays during October (average 95 days), likely coinciding with peak travel demand or local events.
- The shortest booking windows occur for stays in July (average 19 days), indicating more last-minute travel plans during this time.
- Seasonally, Fall (50 days avg.) sees the longest lead times, while Summer (20 days avg.) has the shortest, reflecting typical travel planning cycles.
Recommendations for Hosts
- Use the overall average lead time (40 days) as a baseline for your pricing and availability strategy in Sunset Strip.
- For October stays, consider implementing length-of-stay discounts or slightly higher rates for bookings made less than 95 days out to capitalize on advance planning.
- Target marketing efforts for the Fall season well in advance (at least 50 days) to capture early planners.
- Monitor your own booking lead times against these Sunset Strip averages to identify opportunities for dynamic pricing adjustments.
Popular & Essential Airbnb Amenities in Sunset Strip (2025)
Amenity Prevalence
Amenity Insights for Sunset Strip
- Essential amenities in Sunset Strip that guests expect include: Smoke alarm, Heating, TV, Refrigerator, Air conditioning, Free parking on premises, Wifi. Lacking these (any) could significantly impact bookings.
- Popular amenities like Microwave, Kitchen, Toaster are common but not universal. Offering these can provide a competitive edge.
Recommendations for Hosts
- Ensure your listing includes all essential amenities for Sunset Strip: Smoke alarm, Heating, TV, Refrigerator, Air conditioning, Free parking on premises, Wifi.
- Prioritize adding missing essentials: Refrigerator, Air conditioning, Free parking on premises, Wifi.
- Consider adding popular differentiators like Microwave or Kitchen to increase appeal.
- Highlight unique or less common amenities you offer (e.g., hot tub, dedicated workspace, EV charger) in your listing description and photos.
- Regularly check competitor amenities in Sunset Strip to stay competitive.
Sunset Strip Airbnb Guest Demographics & Profile Analysis (2025)
Guest Profile Summary for Sunset Strip
- The typical guest profile for Airbnb in Sunset Strip consists of primarily domestic travelers (81%), often arriving from nearby Melbourne, typically belonging to the Post-2000s (Gen Z/Alpha) group (50%), primarily speaking English or Chinese.
- Domestic travelers account for 81.3% of guests.
- Key international markets include Australia (81.3%) and United States (3.7%).
- Top languages spoken are English (65.3%) followed by Chinese (6.2%).
- A significant demographic segment is the Post-2000s (Gen Z/Alpha) group, representing 50% of guests.
Recommendations for Hosts
- Target domestic marketing efforts towards travelers from Melbourne and Victoria.
- Tailor amenities and listing descriptions to appeal to the dominant Post-2000s (Gen Z/Alpha) demographic (e.g., highlight fast WiFi, smart home features, local guides).
- Highlight unique local experiences or amenities relevant to the primary guest profile.
- Consider seasonal promotions aligned with peak travel times for key origin markets.
Nearby Short-Term Rental Market Comparison
How does the Sunset Strip Airbnb market stack up against its neighbors? Compare key performance metrics like average monthly revenue, ADR, and occupancy rates in surrounding areas to understand the broader regional STR landscape.
| Market | Active Properties | Monthly Revenue | Daily Rate | Avg. Occupancy |
|---|---|---|---|---|
| Lancefield | 18 | $4,069 | $343.64 | 49% |
| Howqua Inlet | 13 | $3,634 | $322.01 | 37% |
| Leopold | 12 | $3,496 | $429.65 | 41% |
| Yanakie | 16 | $3,473 | $212.73 | 54% |
| Trentham | 52 | $3,455 | $269.84 | 41% |
| Lyonville | 10 | $3,441 | $349.65 | 35% |
| Shire of Mansfield | 89 | $3,347 | $392.77 | 34% |
| Jamieson | 37 | $3,138 | $283.80 | 33% |
| Shire of Hepburn | 283 | $3,120 | $298.86 | 36% |
| Shire of Murrindindi | 70 | $3,061 | $268.84 | 40% |