Shire of Strathbogie Airbnb Market Analysis 2025: Short Term Rental Data & Vacation Rental Statistics in Victoria, Australia
Is Airbnb profitable in Shire of Strathbogie in 2025? Explore comprehensive Airbnb analytics for Shire of Strathbogie, Victoria, Australia to uncover income potential. This 2025 STR market report for Shire of Strathbogie, based on AirROI data from April 2024 to March 2025, reveals key trends in the niche market of 43 active listings.
Whether you're considering an Airbnb investment in Shire of Strathbogie, optimizing your existing vacation rental, or exploring rental arbitrage opportunities, understanding the Shire of Strathbogie Airbnb data is crucial. Leveraging the low regulation environment is key to maximizing your short term rental income potential. Let's dive into the specifics.
Key Shire of Strathbogie Airbnb Performance Metrics Overview
Monthly Airbnb Revenue Variations & Income Potential in Shire of Strathbogie (2025)
Understanding the monthly revenue variations for Airbnb listings in Shire of Strathbogie is key to maximizing your short term rental income potential. Seasonality significantly impacts earnings. Our analysis, based on data from the past 12 months, shows that the peak revenue month for STRs in Shire of Strathbogie is typically April, while August often presents the lowest earnings, highlighting opportunities for strategic pricing adjustments during shoulder and low seasons. Explore the typical Airbnb income in Shire of Strathbogie across different performance tiers:
- Best-in-class properties (Top 10%) achieve $8,808+ monthly, often utilizing dynamic pricing and superior guest experiences.
- Strong performing properties (Top 25%) earn $4,942 or more, indicating effective management and desirable locations/amenities.
- Typical properties (Median) generate around $2,218 per month, representing the average market performance.
- Entry-level properties (Bottom 25%) see earnings around $1,103, often with potential for optimization.
Average Monthly Airbnb Earnings Trend in Shire of Strathbogie
Shire of Strathbogie Airbnb Occupancy Rate Trends (2025)
Maximize your bookings by understanding the Shire of Strathbogie STR occupancy trends. Seasonal demand shifts significantly influence how often properties are booked. Typically, Januarysees the highest demand (peak season occupancy), while February experiences the lowest (low season). Effective strategies, like adjusting minimum stays or offering promotions, can boost occupancy during slower periods. Here's how different property tiers perform in Shire of Strathbogie:
- Best-in-class properties (Top 10%) achieve 73%+ occupancy, indicating high desirability and potentially optimized availability.
- Strong performing properties (Top 25%) maintain 56% or higher occupancy, suggesting good market fit and guest satisfaction.
- Typical properties (Median) have an occupancy rate around 32%.
- Entry-level properties (Bottom 25%) average 17% occupancy, potentially facing higher vacancy.
Average Monthly Occupancy Rate Trend in Shire of Strathbogie
Average Daily Rate (ADR) Airbnb Trends in Shire of Strathbogie (2025)
Effective short term rental pricing strategy in Shire of Strathbogie involves understanding monthly ADR fluctuations. The Average Daily Rate (ADR) for Airbnb in Shire of Strathbogie typically peaks in December and dips lowest during August. Leveraging Airbnb dynamic pricing tools or strategies based on this seasonality can significantly boost revenue. Here's a look at the typical nightly rates achieved:
- Best-in-class properties (Top 10%) command rates of $721+ per night, often due to premium features or locations.
- Strong performing properties (Top 25%) achieve nightly rates of $325 or more.
- Typical properties (Median) charge around $206 per night.
- Entry-level properties (Bottom 25%) earn around $138 per night.
Average Daily Rate (ADR) Trend by Month in Shire of Strathbogie
Get Live Shire of Strathbogie Market Intelligence 👇

Explore Real-time Analytics
Airbnb Seasonality Analysis & Trends in Shire of Strathbogie (2025)
Peak Season (April, January, June)
- Revenue averages $5,288 per month
- Occupancy rates average 47.4%
- Daily rates average $309
Shoulder Season
- Revenue averages $3,633 per month
- Occupancy maintains around 37.1%
- Daily rates hold near $312
Low Season (February, August, September)
- Revenue drops to average $2,656 per month
- Occupancy decreases to average 29.8%
- Daily rates adjust to average $303
Seasonality Insights for Shire of Strathbogie
- The Airbnb seasonality in Shire of Strathbogie shows highly seasonal trends requiring careful strategy. While the sections above show seasonal averages, it's also insightful to look at the extremes:
- During the high season, the absolute peak month showcases Shire of Strathbogie's highest earning potential, with monthly revenues capable of climbing to $5,778, occupancy reaching a high of 49.7%, and ADRs peaking at $338.
- Conversely, the slowest single month of the year, typically falling within the low season, marks the market's lowest point. In this month, revenue might dip to $2,623, occupancy could drop to 26.7%, and ADRs may adjust down to $291.
- Understanding both the seasonal averages and these monthly peaks and troughs in revenue, occupancy, and ADR is crucial for maximizing your Airbnb profit potential in Shire of Strathbogie.
Seasonal Strategies for Maximizing Profit
- Peak Season: Maximize revenue through premium pricing and potentially longer minimum stays. Ensure high availability.
- Low Season: Offer competitive pricing, special promotions (e.g., extended stay discounts), and flexible cancellation policies. Target off-season travelers like remote workers or budget-conscious guests.
- Shoulder Seasons: Implement dynamic pricing that balances peak and low rates. Target weekend travelers or specific events. Offer slightly more flexible terms than peak season.
- Regularly analyze your own performance against these Shire of Strathbogie seasonality benchmarks and adjust your pricing and availability strategy accordingly.
Best Areas for Airbnb Investment in Shire of Strathbogie (2025)
Exploring the top neighborhoods for short-term rentals in Shire of Strathbogie? This section highlights key areas, outlining why they are attractive for hosts and guests, along with notable local attractions. Consider these locations based on your target guest profile and investment strategy.
| Neighborhood / Area | Why Host Here? (Target Guests & Appeal) | Key Attractions & Landmarks |
|---|---|---|
| Euroa | A charming country town known for its historical architecture and proximity to beautiful natural landscapes. Popular for weekend getaways, Euroa attracts visitors looking for relaxation and nature activities. | Euroa Historic Railway Station, Seven Creeks Park, Euroa Botanical Gardens, Victoria Park, Nangiloc Olive Grove |
| Seymour | A bustling town with a rich railway history and stunning views of the surrounding hills. Seymour is a common stop for travelers on their way to the northern parts of Victoria and offers various attractions. | Seymour Railway Heritage Centre, Goulburn River, Seymour Golf Club, Victoria Park, Lalor Forest |
| Strathbogie | A small rural locality nestled in the hills, known for its scenic beauty and tranquility. Ideal for those looking for a peaceful retreat in nature. | Strathbogie Ranges, local vineyards, hiking trails, nature spotting, wildlife photography |
| Nagambie | Located on the banks of Lake Nagambie, this area is famous for water activities and is a popular choice for tourists seeking outdoor adventure and relaxing lakeside experiences. | Nagambie Lakes Community Market, Lake Nagambie, Nagambie Visitor Information Centre, Goulburn Valley Winery, Historic Railway Precinct |
| Benalla | A larger center with a vibrant arts scene, historical sites, and beautiful parks. Benalla draws tourists interested in culture, history, and arts festivals. | Benalla Art Gallery, Benalla Botanical Gardens, Winton Wetlands, The Benalla Rural City Art Gallery, local markets |
| Longwood | A quaint township that is perfect for those seeking an escape from the city, Longwood is surrounded by agricultural lands and offers a glimpse into rural Victoria. | Longwood Community Park, local farms, historical landmarks, Longwood Railway Station, art galleries |
| Avenel | Known for its proximity to the Hume Highway, Avenel is a charming stop for travelers and offers a glimpse of rural life with quaint shops and eateries. | Avenel Race Course, Avenel Bakery, local wineries, Thompson’s Beach, historic buildings |
| Violet Town | A peaceful village setting that offers a friendly community atmosphere and is known for its local markets and proximity to beautiful rural landscapes. | Violet Town Market, local parks, Violet Town Railway Station, Goulburn River, community events |
Understanding Airbnb License Requirements & STR Laws in Shire of Strathbogie (2025)
While Shire of Strathbogie, Victoria, Australia currently shows low STR regulations, specific Airbnb license requirements might still exist or change. Always verify the latest short term rental regulations and Airbnb license requirements directly with local government authorities for Shire of Strathbogie to ensure full compliance before hosting.
(Source: AirROI data, 2025, finding no licensed listings among those analyzed)
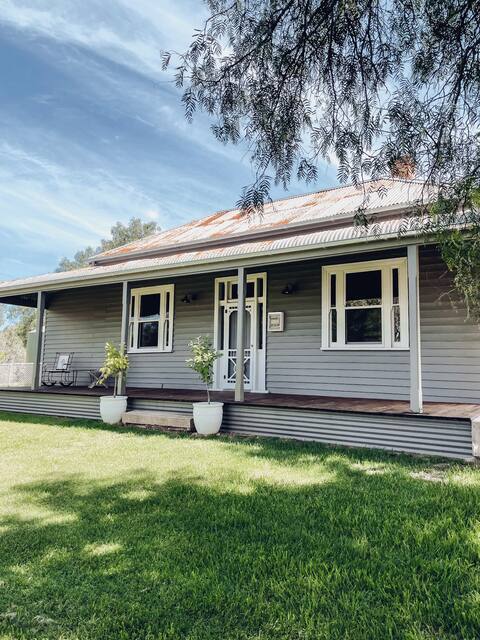
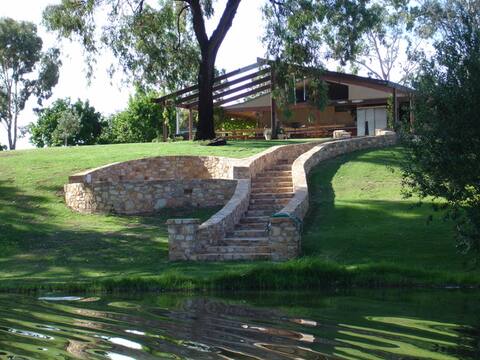
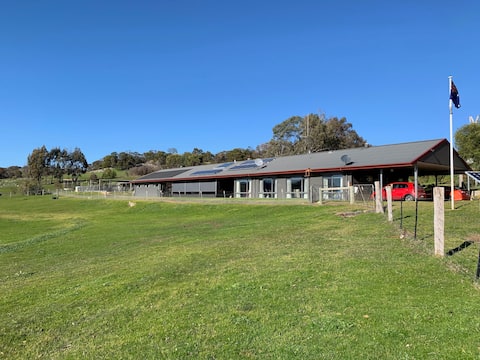
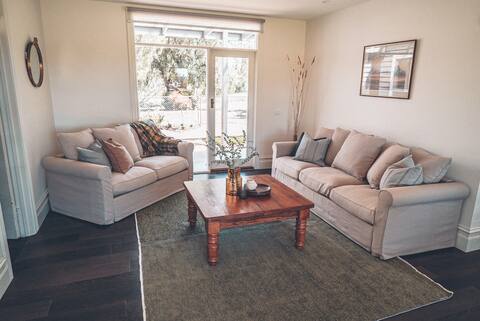
Top Performing Airbnb Properties in Shire of Strathbogie (2025)
Benchmark your potential! Explore examples of top-performing Airbnb properties in Shire of Strathbogiebased on Trailing Twelve Month (TTM) revenue. Analyze their characteristics, revenue, occupancy rate, and ADR to understand what drives success in this market.
Lochrae Homestead - up to 20 guests
Entire Place • 9 bedrooms
Hide & Seek Luxury Waterfront Villa & Retreat
Entire Place • 7 bedrooms
Camp Ruffy: sleeps 21, remote yet close & off-grid
Entire Place • 6 bedrooms

Riverside beauty, sports galore.
Entire Place • 4 bedrooms
Lochrae Homestead - Farmer's Cottage
Entire Place • 4 bedrooms

Seven Creeks Escape - Farm Stay
Entire Place • 3 bedrooms
Note: Performance varies based on location, size, amenities, seasonality, and management quality. Data reflects the past 12 months.
Top Performing Airbnb Hosts in Shire of Strathbogie (2025)
Learn from the best! This table showcases top-performing Airbnb hosts in Shire of Strathbogie based on the number of properties managed and estimated total revenue over the past year. Analyze their scale and performance metrics.
| Host Name | Properties | Grossing Revenue | Stay Reviews | Avg Rating |
|---|---|---|---|---|
| Ella | 8 | $352,010 | 67 | 2.48/5.0 |
| Nedra | 6 | $218,576 | 116 | 3.98/5.0 |
| Roger | 1 | $114,517 | 73 | 4.96/5.0 |
| Diana | 1 | $111,363 | 17 | 4.94/5.0 |
| Kim | 1 | $61,987 | 19 | 5.00/5.0 |
| Kate | 1 | $61,251 | 67 | 4.88/5.0 |
| Christine & Jamie | 1 | $56,436 | 185 | 4.99/5.0 |
| Elizabeth | 1 | $54,439 | 8 | 5.00/5.0 |
| Hayley | 1 | $51,792 | 70 | 4.99/5.0 |
| Kylie | 1 | $47,353 | 4 | 5.00/5.0 |
Analyzing the strategies of top hosts, such as their property selection, pricing, and guest communication, can offer valuable lessons for optimizing your own Airbnb operations in Shire of Strathbogie.
Dive Deeper: Advanced Shire of Strathbogie STR Market Data (2025)
Ready to unlock more insights? AirROI provides access to advanced metrics and comprehensive Airbnb data for Shire of Strathbogie. Explore detailed analytics beyond this report to refine your investment strategy, optimize pricing, and maximize your vacation rental profits.
Explore Advanced MetricsShire of Strathbogie Short-Term Rental Market Composition (2025): Property & Room Types
Room Type Distribution
Property Type Distribution
Market Composition Insights for Shire of Strathbogie
- The Shire of Strathbogie Airbnb market composition is heavily skewed towards Entire Home/Apt listings, which make up 88.4% of the 43 active rentals. This indicates strong guest preference for privacy and space.
- Looking at the property type distribution in Shire of Strathbogie, House properties are the most common (58.1%), reflecting the local real estate landscape.
- Houses represent a significant 58.1% portion, catering likely to families or larger groups.
- Smaller segments like others (combined 2.3%) offer potential for unique stay experiences.
Shire of Strathbogie Airbnb Room Capacity Analysis (2025): Bedroom Distribution
Distribution of Listings by Number of Bedrooms
Room Capacity Insights for Shire of Strathbogie
- The dominant room capacity in Shire of Strathbogie is 3 bedrooms listings, making up 32.6% of the market. This suggests a strong demand for properties suitable for families or small groups.
- Together, 3 bedrooms and 1 bedroom properties represent 58.2% of the active Airbnb listings in Shire of Strathbogie, indicating a high concentration in these sizes.
- A significant 58.2% of listings offer 3+ bedrooms, catering to larger groups and families seeking more space in Shire of Strathbogie.
Shire of Strathbogie Vacation Rental Guest Capacity Trends (2025)
Distribution of Listings by Guest Capacity
Guest Capacity Insights for Shire of Strathbogie
- The most common guest capacity trend in Shire of Strathbogie vacation rentals is listings accommodating 8+ guests (34.9%). This suggests the primary traveler segment is likely larger groups.
- Properties designed for 8+ guests and 6 guests dominate the Shire of Strathbogie STR market, accounting for 60.5% of listings.
- 60.5% of properties accommodate 6+ guests, serving the market segment for larger families or group travel in Shire of Strathbogie.
- On average, properties in Shire of Strathbogie are equipped to host 5.5 guests.
Shire of Strathbogie Airbnb Booking Patterns (2025): Available vs. Booked Days
Available Days Distribution
Booked Days Distribution
Booking Pattern Insights for Shire of Strathbogie
- The most common availability pattern in Shire of Strathbogie falls within the 271-366 days range, representing 37.2% of listings. This suggests many properties have significant open periods on their calendars.
- Approximately 72.1% of listings show high availability (181+ days open annually), indicating potential for increased bookings or specific owner usage patterns.
- For booked days, the 91-180 days range is most frequent in Shire of Strathbogie (34.9%), reflecting common guest stay durations or potential owner blocking patterns.
- A notable 27.9% of properties secure long booking periods (181+ days booked per year), highlighting successful long-term rental strategies or significant owner usage.
Shire of Strathbogie Airbnb Minimum Stay Requirements Analysis
Distribution of Listings by Minimum Night Requirement
1 Night
8 listings
19% of total
2 Nights
17 listings
40.5% of total
3 Nights
3 listings
7.1% of total
4-6 Nights
1 listings
2.4% of total
30+ Nights
13 listings
31% of total
Key Insights
- The most prevalent minimum stay requirement in Shire of Strathbogie is 2 Nights, adopted by 40.5% of listings. This highlights the market's preference for shorter, flexible bookings.
- A significant segment (31%) caters to monthly stays (30+ nights) in Shire of Strathbogie, pointing to opportunities in the extended-stay market.
Recommendations
- Align with the market by considering a 2 Nights minimum stay, as 40.5% of Shire of Strathbogie hosts use this setting.
- If feasible, allowing 1-night stays, especially midweek or during low season, could capture last-minute bookings, as only 19% currently do.
- A 2-night minimum appears standard (40.5%). Consider this for weekends or peak periods.
- Explore offering discounts for stays of 30+ nights to attract the 31% of the market seeking extended stays.
- Adjust minimum nights based on seasonality – potentially shorter during low season and longer during peak demand periods in Shire of Strathbogie.
Shire of Strathbogie Airbnb Cancellation Policy Trends Analysis (2025)
Super Strict 60 Days
1 listings
2.6% of total
Flexible
12 listings
31.6% of total
Moderate
6 listings
15.8% of total
Firm
11 listings
28.9% of total
Strict
8 listings
21.1% of total
Cancellation Policy Insights for Shire of Strathbogie
- The prevailing Airbnb cancellation policy trend in Shire of Strathbogie is Flexible, used by 31.6% of listings.
- There's a relatively balanced mix between guest-friendly (47.4%) and stricter (50.0%) policies, offering choices for different guest needs.
Recommendations for Hosts
- Consider adopting a Flexible policy to align with the 31.6% market standard in Shire of Strathbogie.
- Regularly review your cancellation policy against competitors and market demand shifts in Shire of Strathbogie.
Shire of Strathbogie STR Booking Lead Time Analysis (2025)
Average Booking Lead Time by Month
Booking Lead Time Insights for Shire of Strathbogie
- The overall average booking lead time for vacation rentals in Shire of Strathbogie is 50 days.
- Guests book furthest in advance for stays during November (average 70 days), likely coinciding with peak travel demand or local events.
- The shortest booking windows occur for stays in August (average 22 days), indicating more last-minute travel plans during this time.
- Seasonally, Winter (59 days avg.) sees the longest lead times, while Summer (41 days avg.) has the shortest, reflecting typical travel planning cycles.
Recommendations for Hosts
- Use the overall average lead time (50 days) as a baseline for your pricing and availability strategy in Shire of Strathbogie.
- For November stays, consider implementing length-of-stay discounts or slightly higher rates for bookings made less than 70 days out to capitalize on advance planning.
- Target marketing efforts for the Winter season well in advance (at least 59 days) to capture early planners.
- Monitor your own booking lead times against these Shire of Strathbogie averages to identify opportunities for dynamic pricing adjustments.
Popular & Essential Airbnb Amenities in Shire of Strathbogie (2025)
Amenity Prevalence
Amenity Insights for Shire of Strathbogie
- Essential amenities in Shire of Strathbogie that guests expect include: TV, Smoke alarm, Free parking on premises. Lacking these (any) could significantly impact bookings.
- Popular amenities like Heating, Air conditioning, BBQ grill are common but not universal. Offering these can provide a competitive edge.
Recommendations for Hosts
- Ensure your listing includes all essential amenities for Shire of Strathbogie: TV, Smoke alarm, Free parking on premises.
- Prioritize adding missing essentials: Free parking on premises.
- Consider adding popular differentiators like Heating or Air conditioning to increase appeal.
- Highlight unique or less common amenities you offer (e.g., hot tub, dedicated workspace, EV charger) in your listing description and photos.
- Regularly check competitor amenities in Shire of Strathbogie to stay competitive.
Shire of Strathbogie Airbnb Guest Demographics & Profile Analysis (2025)
Guest Profile Summary for Shire of Strathbogie
- The typical guest profile for Airbnb in Shire of Strathbogie consists of primarily domestic travelers (96%), often arriving from nearby Melbourne, typically belonging to the Post-2000s (Gen Z/Alpha) group (50%), primarily speaking English or French.
- Domestic travelers account for 96.3% of guests.
- Key international markets include Australia (96.3%) and United States (0.6%).
- Top languages spoken are English (76.4%) followed by French (3.9%).
- A significant demographic segment is the Post-2000s (Gen Z/Alpha) group, representing 50% of guests.
Recommendations for Hosts
- Target domestic marketing efforts towards travelers from Melbourne and Victoria.
- Tailor amenities and listing descriptions to appeal to the dominant Post-2000s (Gen Z/Alpha) demographic (e.g., highlight fast WiFi, smart home features, local guides).
- Highlight unique local experiences or amenities relevant to the primary guest profile.
- Consider seasonal promotions aligned with peak travel times for key origin markets.
Nearby Short-Term Rental Market Comparison
How does the Shire of Strathbogie Airbnb market stack up against its neighbors? Compare key performance metrics like average monthly revenue, ADR, and occupancy rates in surrounding areas to understand the broader regional STR landscape.
| Market | Active Properties | Monthly Revenue | Daily Rate | Avg. Occupancy |
|---|---|---|---|---|
| Lancefield | 18 | $4,069 | $343.64 | 49% |
| Howqua Inlet | 13 | $3,634 | $322.01 | 37% |
| Bright | 474 | $3,468 | $294.34 | 42% |
| Trentham | 52 | $3,455 | $269.84 | 41% |
| Lyonville | 10 | $3,441 | $349.65 | 35% |
| Porepunkah | 40 | $3,397 | $328.54 | 37% |
| Nagambie | 33 | $3,381 | $300.42 | 40% |
| Shire of Mansfield | 89 | $3,347 | $392.77 | 34% |
| Jamieson | 37 | $3,138 | $283.80 | 33% |
| Wandiligong | 20 | $3,137 | $271.79 | 41% |