Shire of Murrindindi Airbnb Market Analysis 2025: Short Term Rental Data & Vacation Rental Statistics in Victoria, Australia
Is Airbnb profitable in Shire of Murrindindi in 2025? Explore comprehensive Airbnb analytics for Shire of Murrindindi, Victoria, Australia to uncover income potential. This 2025 STR market report for Shire of Murrindindi, based on AirROI data from April 2024 to March 2025, reveals key trends in the niche market of 70 active listings.
Whether you're considering an Airbnb investment in Shire of Murrindindi, optimizing your existing vacation rental, or exploring rental arbitrage opportunities, understanding the Shire of Murrindindi Airbnb data is crucial. Leveraging the low regulation environment is key to maximizing your short term rental income potential. Let's dive into the specifics.
Key Shire of Murrindindi Airbnb Performance Metrics Overview
Monthly Airbnb Revenue Variations & Income Potential in Shire of Murrindindi (2025)
Understanding the monthly revenue variations for Airbnb listings in Shire of Murrindindi is key to maximizing your short term rental income potential. Seasonality significantly impacts earnings. Our analysis, based on data from the past 12 months, shows that the peak revenue month for STRs in Shire of Murrindindi is typically January, while February often presents the lowest earnings, highlighting opportunities for strategic pricing adjustments during shoulder and low seasons. Explore the typical Airbnb income in Shire of Murrindindi across different performance tiers:
- Best-in-class properties (Top 10%) achieve $7,869+ monthly, often utilizing dynamic pricing and superior guest experiences.
- Strong performing properties (Top 25%) earn $4,264 or more, indicating effective management and desirable locations/amenities.
- Typical properties (Median) generate around $2,419 per month, representing the average market performance.
- Entry-level properties (Bottom 25%) see earnings around $1,321, often with potential for optimization.
Average Monthly Airbnb Earnings Trend in Shire of Murrindindi
Shire of Murrindindi Airbnb Occupancy Rate Trends (2025)
Maximize your bookings by understanding the Shire of Murrindindi STR occupancy trends. Seasonal demand shifts significantly influence how often properties are booked. Typically, Januarysees the highest demand (peak season occupancy), while May experiences the lowest (low season). Effective strategies, like adjusting minimum stays or offering promotions, can boost occupancy during slower periods. Here's how different property tiers perform in Shire of Murrindindi:
- Best-in-class properties (Top 10%) achieve 74%+ occupancy, indicating high desirability and potentially optimized availability.
- Strong performing properties (Top 25%) maintain 55% or higher occupancy, suggesting good market fit and guest satisfaction.
- Typical properties (Median) have an occupancy rate around 37%.
- Entry-level properties (Bottom 25%) average 22% occupancy, potentially facing higher vacancy.
Average Monthly Occupancy Rate Trend in Shire of Murrindindi
Average Daily Rate (ADR) Airbnb Trends in Shire of Murrindindi (2025)
Effective short term rental pricing strategy in Shire of Murrindindi involves understanding monthly ADR fluctuations. The Average Daily Rate (ADR) for Airbnb in Shire of Murrindindi typically peaks in December and dips lowest during March. Leveraging Airbnb dynamic pricing tools or strategies based on this seasonality can significantly boost revenue. Here's a look at the typical nightly rates achieved:
- Best-in-class properties (Top 10%) command rates of $568+ per night, often due to premium features or locations.
- Strong performing properties (Top 25%) achieve nightly rates of $303 or more.
- Typical properties (Median) charge around $186 per night.
- Entry-level properties (Bottom 25%) earn around $142 per night.
Average Daily Rate (ADR) Trend by Month in Shire of Murrindindi
Get Live Shire of Murrindindi Market Intelligence 👇

Explore Real-time Analytics
Airbnb Seasonality Analysis & Trends in Shire of Murrindindi (2025)
Peak Season (January, December, June)
- Revenue averages $4,361 per month
- Occupancy rates average 45.0%
- Daily rates average $271
Shoulder Season
- Revenue averages $3,505 per month
- Occupancy maintains around 39.3%
- Daily rates hold near $265
Low Season (February, September, October)
- Revenue drops to average $2,990 per month
- Occupancy decreases to average 36.6%
- Daily rates adjust to average $263
Seasonality Insights for Shire of Murrindindi
- The Airbnb seasonality in Shire of Murrindindi shows moderate seasonality with distinct peak and low periods. While the sections above show seasonal averages, it's also insightful to look at the extremes:
- During the high season, the absolute peak month showcases Shire of Murrindindi's highest earning potential, with monthly revenues capable of climbing to $4,737, occupancy reaching a high of 48.6%, and ADRs peaking at $275.
- Conversely, the slowest single month of the year, typically falling within the low season, marks the market's lowest point. In this month, revenue might dip to $2,918, occupancy could drop to 32.3%, and ADRs may adjust down to $257.
- Understanding both the seasonal averages and these monthly peaks and troughs in revenue, occupancy, and ADR is crucial for maximizing your Airbnb profit potential in Shire of Murrindindi.
Seasonal Strategies for Maximizing Profit
- Peak Season: Maximize revenue through premium pricing and potentially longer minimum stays. Ensure high availability.
- Low Season: Offer competitive pricing, special promotions (e.g., extended stay discounts), and flexible cancellation policies. Target off-season travelers like remote workers or budget-conscious guests.
- Shoulder Seasons: Implement dynamic pricing that balances peak and low rates. Target weekend travelers or specific events. Offer slightly more flexible terms than peak season.
- Regularly analyze your own performance against these Shire of Murrindindi seasonality benchmarks and adjust your pricing and availability strategy accordingly.
Best Areas for Airbnb Investment in Shire of Murrindindi (2025)
Exploring the top neighborhoods for short-term rentals in Shire of Murrindindi? This section highlights key areas, outlining why they are attractive for hosts and guests, along with notable local attractions. Consider these locations based on your target guest profile and investment strategy.
| Neighborhood / Area | Why Host Here? (Target Guests & Appeal) | Key Attractions & Landmarks |
|---|---|---|
| Alexandra | A charming town known as the gateway to the beautiful Murrindindi region. Its picturesque surroundings attract nature lovers and tourists looking for a peaceful retreat. | Lake Eildon, Murrindindi Scenic Reserve, Old Alexandra Road, Alexandra Timber Tramway |
| Yea | A bustling community with a rich history, Yea offers a range of outdoor activities and attractions for visitors, appealing to families and nature enthusiasts. | Yea Wetlands, Yea River, Yea Railway Station, Yea Golf Club |
| Eildon | Famous for Lake Eildon, this area is a hotspot for water sports and fishing, drawing adventure seekers and families looking for lakeside fun. | Lake Eildon National Park, Eildon Dam, Eildon Boat Ramp |
| Kinglake | Part of Kinglake National Park, it attracts visitors interested in hiking and wildlife. Offers stunning views and a tranquil escape. | Kinglake National Park, Kinglake Forest Adventures, Maroondah Dam, Skyline Road Lookout |
| Marysville | A popular tourist destination known for its stunning scenery, waterfalls, and proximity to Mount Buller. Ideal for nature and adventure lovers. | Steavenson Falls, Marysville Music Festival, Marysville Trout and Salmon Ponds, Bruno's Art and Sculpture Garden |
| Toolangi | Nestled in the rural area of Victoria, Toolangi is surrounded by beautiful forests and nature walks, attracting those who love the outdoors. | Toolangi State Forest, Chardonnay Lodge, Toolangi Common |
| Murchison | A small town rich in history, appealing to those interested in vintage attractions and the quiet countryside atmosphere. | Murchison Railway Station, Murchison Clock Tower, Murchison Historical Society |
| Doreen | A growing suburb in the outskirts of Melbourne, close to the Yarra Valley, appealing to visitors looking for a mix of suburban and rural attractions. | Plenty Gorge Park, Yarrambat Park Golf Course, Yarra Valley Winery Tours |
Understanding Airbnb License Requirements & STR Laws in Shire of Murrindindi (2025)
While Shire of Murrindindi, Victoria, Australia currently shows low STR regulations, specific Airbnb license requirements might still exist or change. Always verify the latest short term rental regulations and Airbnb license requirements directly with local government authorities for Shire of Murrindindi to ensure full compliance before hosting.
(Source: AirROI data, 2025, finding no licensed listings among those analyzed)
Top Performing Airbnb Properties in Shire of Murrindindi (2025)
Benchmark your potential! Explore examples of top-performing Airbnb properties in Shire of Murrindindibased on Trailing Twelve Month (TTM) revenue. Analyze their characteristics, revenue, occupancy rate, and ADR to understand what drives success in this market.
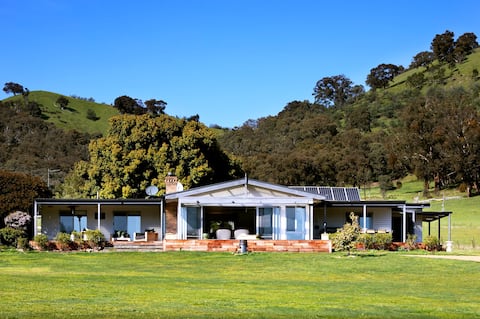
Headley Homestead at The Village Green
Entire Place • 5 bedrooms
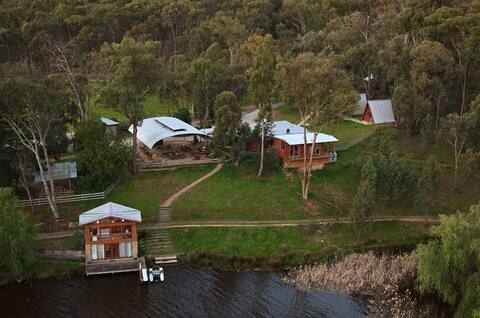
Fawlty Farm in Taylor Bay with 3 FREE experiences
Entire Place • 9 bedrooms
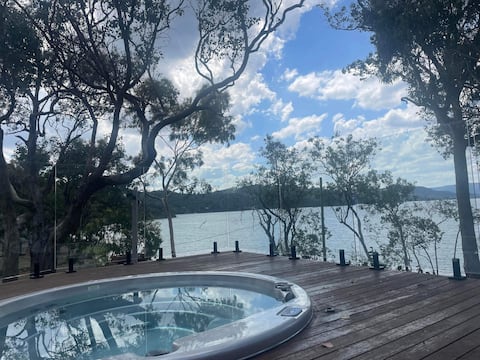
Glasshouse on the Lake
Entire Place • 4 bedrooms
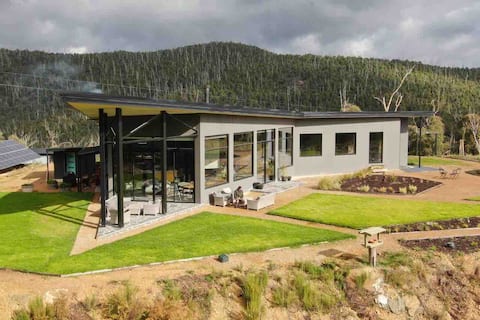
The Retreat at Mt Cathedral
Entire Place • 5 bedrooms
Best of Yarra Valley and Kinglake National Park
Entire Place • 4 bedrooms

Cheeky Fox Retreat
Entire Place • 6 bedrooms
Note: Performance varies based on location, size, amenities, seasonality, and management quality. Data reflects the past 12 months.
Top Performing Airbnb Hosts in Shire of Murrindindi (2025)
Learn from the best! This table showcases top-performing Airbnb hosts in Shire of Murrindindi based on the number of properties managed and estimated total revenue over the past year. Analyze their scale and performance metrics.
| Host Name | Properties | Grossing Revenue | Stay Reviews | Avg Rating |
|---|---|---|---|---|
| The Village Green | 6 | $355,743 | 208 | 4.92/5.0 |
| John | 2 | $230,288 | 113 | 4.77/5.0 |
| Nicholas | 5 | $205,600 | 158 | 4.99/5.0 |
| Di | 1 | $128,815 | 11 | 4.82/5.0 |
| Igor | 1 | $101,010 | 67 | 4.93/5.0 |
| Jason & Linda | 1 | $99,026 | 48 | 4.98/5.0 |
| Rachael | 3 | $96,947 | 133 | 4.94/5.0 |
| Flowerdale Estate | 2 | $91,532 | 6 | 2.40/5.0 |
| Kati | 1 | $87,445 | 22 | 5.00/5.0 |
| Rachael | 2 | $81,601 | 115 | 4.93/5.0 |
Analyzing the strategies of top hosts, such as their property selection, pricing, and guest communication, can offer valuable lessons for optimizing your own Airbnb operations in Shire of Murrindindi.
Dive Deeper: Advanced Shire of Murrindindi STR Market Data (2025)
Ready to unlock more insights? AirROI provides access to advanced metrics and comprehensive Airbnb data for Shire of Murrindindi. Explore detailed analytics beyond this report to refine your investment strategy, optimize pricing, and maximize your vacation rental profits.
Explore Advanced MetricsShire of Murrindindi Short-Term Rental Market Composition (2025): Property & Room Types
Room Type Distribution
Property Type Distribution
Market Composition Insights for Shire of Murrindindi
- The Shire of Murrindindi Airbnb market composition is heavily skewed towards Entire Home/Apt listings, which make up 88.6% of the 70 active rentals. This indicates strong guest preference for privacy and space.
- Looking at the property type distribution in Shire of Murrindindi, House properties are the most common (51.4%), reflecting the local real estate landscape.
- Houses represent a significant 51.4% portion, catering likely to families or larger groups.
- The presence of 11.4% Hotel/Boutique listings indicates integration with traditional hospitality.
- Smaller segments like others, unique stays (combined 4.3%) offer potential for unique stay experiences.
Shire of Murrindindi Airbnb Room Capacity Analysis (2025): Bedroom Distribution
Distribution of Listings by Number of Bedrooms
Room Capacity Insights for Shire of Murrindindi
- The dominant room capacity in Shire of Murrindindi is 1 bedroom listings, making up 37.1% of the market. This suggests a strong demand for properties suitable for couples or solo travelers.
- Together, 1 bedroom and 3 bedrooms properties represent 55.7% of the active Airbnb listings in Shire of Murrindindi, indicating a high concentration in these sizes.
- A significant 40.0% of listings offer 3+ bedrooms, catering to larger groups and families seeking more space in Shire of Murrindindi.
Shire of Murrindindi Vacation Rental Guest Capacity Trends (2025)
Distribution of Listings by Guest Capacity
Guest Capacity Insights for Shire of Murrindindi
- The most common guest capacity trend in Shire of Murrindindi vacation rentals is listings accommodating 2 guests (32.9%). This suggests the primary traveler segment is likely couples or solo travelers.
- Properties designed for 2 guests and 8+ guests dominate the Shire of Murrindindi STR market, accounting for 62.9% of listings.
- 44.3% of properties accommodate 6+ guests, serving the market segment for larger families or group travel in Shire of Murrindindi.
- On average, properties in Shire of Murrindindi are equipped to host 4.6 guests.
Shire of Murrindindi Airbnb Booking Patterns (2025): Available vs. Booked Days
Available Days Distribution
Booked Days Distribution
Booking Pattern Insights for Shire of Murrindindi
- The most common availability pattern in Shire of Murrindindi falls within the 181-270 days range, representing 48.6% of listings. This suggests many properties have significant open periods on their calendars.
- Approximately 77.2% of listings show high availability (181+ days open annually), indicating potential for increased bookings or specific owner usage patterns.
- For booked days, the 91-180 days range is most frequent in Shire of Murrindindi (52.9%), reflecting common guest stay durations or potential owner blocking patterns.
- A notable 22.8% of properties secure long booking periods (181+ days booked per year), highlighting successful long-term rental strategies or significant owner usage.
Shire of Murrindindi Airbnb Minimum Stay Requirements Analysis
Distribution of Listings by Minimum Night Requirement
1 Night
23 listings
34.8% of total
2 Nights
33 listings
50% of total
30+ Nights
10 listings
15.2% of total
Key Insights
- The most prevalent minimum stay requirement in Shire of Murrindindi is 2 Nights, adopted by 50% of listings. This highlights the market's preference for shorter, flexible bookings.
- A strong majority (84.8%) of the Shire of Murrindindi Airbnb data shows acceptance of very short stays (1-2 nights), indicating a dynamic, high-turnover market.
- A significant segment (15.2%) caters to monthly stays (30+ nights) in Shire of Murrindindi, pointing to opportunities in the extended-stay market.
Recommendations
- Align with the market by considering a 2 Nights minimum stay, as 50% of Shire of Murrindindi hosts use this setting.
- Explore offering discounts for stays of 30+ nights to attract the 15.2% of the market seeking extended stays.
- Adjust minimum nights based on seasonality – potentially shorter during low season and longer during peak demand periods in Shire of Murrindindi.
Shire of Murrindindi Airbnb Cancellation Policy Trends Analysis (2025)
Flexible
16 listings
24.2% of total
Moderate
21 listings
31.8% of total
Firm
13 listings
19.7% of total
Strict
16 listings
24.2% of total
Cancellation Policy Insights for Shire of Murrindindi
- The prevailing Airbnb cancellation policy trend in Shire of Murrindindi is Moderate, used by 31.8% of listings.
- There's a relatively balanced mix between guest-friendly (56.0%) and stricter (43.9%) policies, offering choices for different guest needs.
Recommendations for Hosts
- Consider adopting a Moderate policy to align with the 31.8% market standard in Shire of Murrindindi.
- Regularly review your cancellation policy against competitors and market demand shifts in Shire of Murrindindi.
Shire of Murrindindi STR Booking Lead Time Analysis (2025)
Average Booking Lead Time by Month
Booking Lead Time Insights for Shire of Murrindindi
- The overall average booking lead time for vacation rentals in Shire of Murrindindi is 50 days.
- Guests book furthest in advance for stays during October (average 63 days), likely coinciding with peak travel demand or local events.
- The shortest booking windows occur for stays in September (average 36 days), indicating more last-minute travel plans during this time.
- Seasonally, Winter (56 days avg.) sees the longest lead times, while Summer (46 days avg.) has the shortest, reflecting typical travel planning cycles.
Recommendations for Hosts
- Use the overall average lead time (50 days) as a baseline for your pricing and availability strategy in Shire of Murrindindi.
- For October stays, consider implementing length-of-stay discounts or slightly higher rates for bookings made less than 63 days out to capitalize on advance planning.
- Target marketing efforts for the Winter season well in advance (at least 56 days) to capture early planners.
- Monitor your own booking lead times against these Shire of Murrindindi averages to identify opportunities for dynamic pricing adjustments.
Popular & Essential Airbnb Amenities in Shire of Murrindindi (2025)
Amenity Prevalence
Amenity Insights for Shire of Murrindindi
- Essential amenities in Shire of Murrindindi that guests expect include: Smoke alarm, Free parking on premises, Hot water, Dishes and silverware. Lacking these (any) could significantly impact bookings.
- Popular amenities like Heating, Cooking basics, Air conditioning are common but not universal. Offering these can provide a competitive edge.
Recommendations for Hosts
- Ensure your listing includes all essential amenities for Shire of Murrindindi: Smoke alarm, Free parking on premises, Hot water, Dishes and silverware.
- Prioritize adding missing essentials: Free parking on premises, Hot water, Dishes and silverware.
- Consider adding popular differentiators like Heating or Cooking basics to increase appeal.
- Highlight unique or less common amenities you offer (e.g., hot tub, dedicated workspace, EV charger) in your listing description and photos.
- Regularly check competitor amenities in Shire of Murrindindi to stay competitive.
Shire of Murrindindi Airbnb Guest Demographics & Profile Analysis (2025)
Guest Profile Summary for Shire of Murrindindi
- The typical guest profile for Airbnb in Shire of Murrindindi consists of primarily domestic travelers (94%), often arriving from nearby Melbourne, typically belonging to the Post-2000s (Gen Z/Alpha) group (50%), primarily speaking English or Spanish.
- Domestic travelers account for 94.4% of guests.
- Key international markets include Australia (94.4%) and United Kingdom (1.5%).
- Top languages spoken are English (70.6%) followed by Spanish (4.7%).
- A significant demographic segment is the Post-2000s (Gen Z/Alpha) group, representing 50% of guests.
Recommendations for Hosts
- Target domestic marketing efforts towards travelers from Melbourne and Victoria.
- Tailor amenities and listing descriptions to appeal to the dominant Post-2000s (Gen Z/Alpha) demographic (e.g., highlight fast WiFi, smart home features, local guides).
- Highlight unique local experiences or amenities relevant to the primary guest profile.
- Consider seasonal promotions aligned with peak travel times for key origin markets.
Nearby Short-Term Rental Market Comparison
How does the Shire of Murrindindi Airbnb market stack up against its neighbors? Compare key performance metrics like average monthly revenue, ADR, and occupancy rates in surrounding areas to understand the broader regional STR landscape.
| Market | Active Properties | Monthly Revenue | Daily Rate | Avg. Occupancy |
|---|---|---|---|---|
| Lancefield | 18 | $4,069 | $343.64 | 49% |
| Howqua Inlet | 13 | $3,634 | $322.01 | 37% |
| Leopold | 12 | $3,496 | $429.65 | 41% |
| Yanakie | 16 | $3,473 | $212.73 | 54% |
| Bright | 474 | $3,468 | $294.34 | 42% |
| Trentham | 52 | $3,455 | $269.84 | 41% |
| Lyonville | 10 | $3,441 | $349.65 | 35% |
| Porepunkah | 40 | $3,397 | $328.54 | 37% |
| Nagambie | 33 | $3,381 | $300.42 | 40% |
| Shire of Mansfield | 89 | $3,347 | $392.77 | 34% |