Shire of Campaspe Airbnb Market Analysis 2025: Short Term Rental Data & Vacation Rental Statistics in Victoria, Australia
Is Airbnb profitable in Shire of Campaspe in 2025? Explore comprehensive Airbnb analytics for Shire of Campaspe, Victoria, Australia to uncover income potential. This 2025 STR market report for Shire of Campaspe, based on AirROI data from April 2024 to March 2025, reveals key trends in the niche market of 29 active listings.
Whether you're considering an Airbnb investment in Shire of Campaspe, optimizing your existing vacation rental, or exploring rental arbitrage opportunities, understanding the Shire of Campaspe Airbnb data is crucial. Leveraging the low regulation environment is key to maximizing your short term rental income potential. Let's dive into the specifics.
Key Shire of Campaspe Airbnb Performance Metrics Overview
Monthly Airbnb Revenue Variations & Income Potential in Shire of Campaspe (2025)
Understanding the monthly revenue variations for Airbnb listings in Shire of Campaspe is key to maximizing your short term rental income potential. Seasonality significantly impacts earnings. Our analysis, based on data from the past 12 months, shows that the peak revenue month for STRs in Shire of Campaspe is typically December, while September often presents the lowest earnings, highlighting opportunities for strategic pricing adjustments during shoulder and low seasons. Explore the typical Airbnb income in Shire of Campaspe across different performance tiers:
- Best-in-class properties (Top 10%) achieve $5,182+ monthly, often utilizing dynamic pricing and superior guest experiences.
- Strong performing properties (Top 25%) earn $2,859 or more, indicating effective management and desirable locations/amenities.
- Typical properties (Median) generate around $1,767 per month, representing the average market performance.
- Entry-level properties (Bottom 25%) see earnings around $739, often with potential for optimization.
Average Monthly Airbnb Earnings Trend in Shire of Campaspe
Shire of Campaspe Airbnb Occupancy Rate Trends (2025)
Maximize your bookings by understanding the Shire of Campaspe STR occupancy trends. Seasonal demand shifts significantly influence how often properties are booked. Typically, Decembersees the highest demand (peak season occupancy), while August experiences the lowest (low season). Effective strategies, like adjusting minimum stays or offering promotions, can boost occupancy during slower periods. Here's how different property tiers perform in Shire of Campaspe:
- Best-in-class properties (Top 10%) achieve 63%+ occupancy, indicating high desirability and potentially optimized availability.
- Strong performing properties (Top 25%) maintain 41% or higher occupancy, suggesting good market fit and guest satisfaction.
- Typical properties (Median) have an occupancy rate around 27%.
- Entry-level properties (Bottom 25%) average 15% occupancy, potentially facing higher vacancy.
Average Monthly Occupancy Rate Trend in Shire of Campaspe
Average Daily Rate (ADR) Airbnb Trends in Shire of Campaspe (2025)
Effective short term rental pricing strategy in Shire of Campaspe involves understanding monthly ADR fluctuations. The Average Daily Rate (ADR) for Airbnb in Shire of Campaspe typically peaks in December and dips lowest during August. Leveraging Airbnb dynamic pricing tools or strategies based on this seasonality can significantly boost revenue. Here's a look at the typical nightly rates achieved:
- Best-in-class properties (Top 10%) command rates of $516+ per night, often due to premium features or locations.
- Strong performing properties (Top 25%) achieve nightly rates of $258 or more.
- Typical properties (Median) charge around $178 per night.
- Entry-level properties (Bottom 25%) earn around $133 per night.
Average Daily Rate (ADR) Trend by Month in Shire of Campaspe
Get Live Shire of Campaspe Market Intelligence 👇

Explore Real-time Analytics
Airbnb Seasonality Analysis & Trends in Shire of Campaspe (2025)
Peak Season (December, March, January)
- Revenue averages $3,382 per month
- Occupancy rates average 38.0%
- Daily rates average $271
Shoulder Season
- Revenue averages $2,548 per month
- Occupancy maintains around 30.7%
- Daily rates hold near $244
Low Season (August, September, October)
- Revenue drops to average $1,777 per month
- Occupancy decreases to average 26.6%
- Daily rates adjust to average $232
Seasonality Insights for Shire of Campaspe
- The Airbnb seasonality in Shire of Campaspe shows highly seasonal trends requiring careful strategy. While the sections above show seasonal averages, it's also insightful to look at the extremes:
- During the high season, the absolute peak month showcases Shire of Campaspe's highest earning potential, with monthly revenues capable of climbing to $3,534, occupancy reaching a high of 40.9%, and ADRs peaking at $280.
- Conversely, the slowest single month of the year, typically falling within the low season, marks the market's lowest point. In this month, revenue might dip to $1,539, occupancy could drop to 23.7%, and ADRs may adjust down to $229.
- Understanding both the seasonal averages and these monthly peaks and troughs in revenue, occupancy, and ADR is crucial for maximizing your Airbnb profit potential in Shire of Campaspe.
Seasonal Strategies for Maximizing Profit
- Peak Season: Maximize revenue through premium pricing and potentially longer minimum stays. Ensure high availability.
- Low Season: Offer competitive pricing, special promotions (e.g., extended stay discounts), and flexible cancellation policies. Target off-season travelers like remote workers or budget-conscious guests.
- Shoulder Seasons: Implement dynamic pricing that balances peak and low rates. Target weekend travelers or specific events. Offer slightly more flexible terms than peak season.
- Regularly analyze your own performance against these Shire of Campaspe seasonality benchmarks and adjust your pricing and availability strategy accordingly.
Best Areas for Airbnb Investment in Shire of Campaspe (2025)
Exploring the top neighborhoods for short-term rentals in Shire of Campaspe? This section highlights key areas, outlining why they are attractive for hosts and guests, along with notable local attractions. Consider these locations based on your target guest profile and investment strategy.
| Neighborhood / Area | Why Host Here? (Target Guests & Appeal) | Key Attractions & Landmarks |
|---|---|---|
| Echuca | Historic river port town known for its paddle steamers, rich history, and vibrant tourist activities. A popular destination for families and couples looking for a unique getaway on the Murray River. | Echuca Historic Port, PS Emmylou, Chanter Estate Winery, Echuca Moama Trail, Great Aussie Beer Shed, Echuca Village |
| Moama | Located just across the river from Echuca, Moama offers beautiful river views and access to outdoor activities. It is a quieter alternative for visitors looking to relax and unwind. | Moama Beach, Rich River Golf Club, Moama Bowling Club, Berries Blueberry Farm, Echuca-Moama Visitor Information Centre |
| Kyabram | A small township that is growing in popularity, known for its charming rural atmosphere and proximity to natural attractions. Great for families and those seeking a peaceful retreat. | Kyabram Fauna Park, Kyabram Historical Society, Kyabram Lawn Tennis Club, Rural Life Museum |
| Campaspe | A picturesque area with scenic landscapes, perfect for those looking for a rural experience. Suitable for nature lovers and those interested in agriculture tourism. | Campaspe River, Cohuna Golf Club, local wineries and farms, Campaspe Valley wine region |
| Tongala | A small town known for its rich dairy industry and friendly community. It provides a unique insight into rural Australian life, perfect for visitors wanting an authentic experience. | Tongala Heritage Centre, local dairy farms, Cohuna Wildlife Park |
| Rochester | A historical town with a strong agricultural heritage and close to several natural attractions. It's ideal for visitors interested in local history and rural life. | Rochester Historical Society, Rochester Cinema, Riverwalk trails, local markets |
| Lockington | A quaint rural town that provides a glimpse into country life. It's a peaceful location for those looking to escape the hustle and bustle while enjoying nature. | Lockington Historical Society, local parks, nature walks, Lockington Show |
| Bendigo (nearby) | Although not in Campaspe, it’s a major city nearby known for its culture, art, and attractions, making it a popular base for Airbnb investors looking to attract tourists to the region. | Bendigo Art Gallery, Golden Dragon Museum, Central Deborah Gold Mine, Bendigo Botanic Gardens, Bendigo Tramways |
Understanding Airbnb License Requirements & STR Laws in Shire of Campaspe (2025)
While Shire of Campaspe, Victoria, Australia currently shows low STR regulations, specific Airbnb license requirements might still exist or change. Always verify the latest short term rental regulations and Airbnb license requirements directly with local government authorities for Shire of Campaspe to ensure full compliance before hosting.
(Source: AirROI data, 2025, finding no licensed listings among those analyzed)
Top Performing Airbnb Properties in Shire of Campaspe (2025)
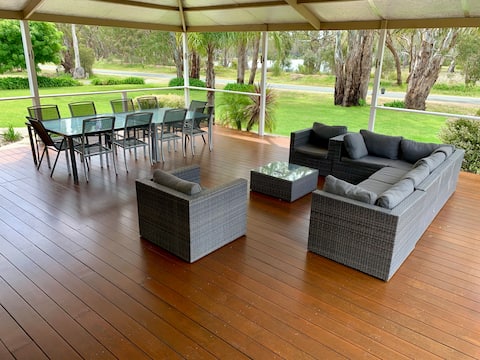
Benchmark your potential! Explore examples of top-performing Airbnb properties in Shire of Campaspebased on Trailing Twelve Month (TTM) revenue. Analyze their characteristics, revenue, occupancy rate, and ADR to understand what drives success in this market.

Your Own Pub near Murray, Sleeps 20+
Entire Place • 7 bedrooms
Murray Lagoon Views
Entire Place • 8 bedrooms

Echuca Riverfront Holiday Home with private pontoo
Entire Place • 4 bedrooms
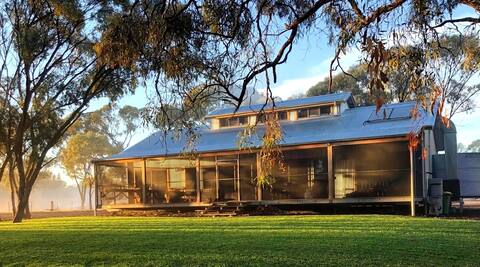
The Shearing Shed House
Entire Place • 4 bedrooms

ThePoolHouse@Torrumbarry
Entire Place • 3 bedrooms

One bedroom cottage with outdoor spa
Entire Place • 1 bedroom
Note: Performance varies based on location, size, amenities, seasonality, and management quality. Data reflects the past 12 months.
Top Performing Airbnb Hosts in Shire of Campaspe (2025)
Learn from the best! This table showcases top-performing Airbnb hosts in Shire of Campaspe based on the number of properties managed and estimated total revenue over the past year. Analyze their scale and performance metrics.
| Host Name | Properties | Grossing Revenue | Stay Reviews | Avg Rating |
|---|---|---|---|---|
| Serviced Houses Australia | 2 | $136,527 | 14 | 4.29/5.0 |
| Echuca Holiday Homes | 2 | $86,814 | 5 | 2.50/5.0 |
| Nicole | 3 | $86,685 | 81 | 4.87/5.0 |
| Tom | 1 | $73,350 | 58 | 4.71/5.0 |
| Lynn | 1 | $57,313 | 138 | 4.96/5.0 |
| Lyndall | 2 | $43,912 | 103 | 4.90/5.0 |
| Spencer | 4 | $37,146 | 298 | 4.80/5.0 |
| Michael | 1 | $35,224 | 19 | 4.84/5.0 |
| David | 1 | $28,619 | 38 | 4.95/5.0 |
| Phil & Glenda | 1 | $27,697 | 125 | 4.92/5.0 |
Analyzing the strategies of top hosts, such as their property selection, pricing, and guest communication, can offer valuable lessons for optimizing your own Airbnb operations in Shire of Campaspe.
Dive Deeper: Advanced Shire of Campaspe STR Market Data (2025)
Ready to unlock more insights? AirROI provides access to advanced metrics and comprehensive Airbnb data for Shire of Campaspe. Explore detailed analytics beyond this report to refine your investment strategy, optimize pricing, and maximize your vacation rental profits.
Explore Advanced MetricsShire of Campaspe Short-Term Rental Market Composition (2025): Property & Room Types
Room Type Distribution
Property Type Distribution
Market Composition Insights for Shire of Campaspe
- The Shire of Campaspe Airbnb market composition is heavily skewed towards Entire Home/Apt listings, which make up 93.1% of the 29 active rentals. This indicates strong guest preference for privacy and space.
- Looking at the property type distribution in Shire of Campaspe, House properties are the most common (55.2%), reflecting the local real estate landscape.
- Houses represent a significant 55.2% portion, catering likely to families or larger groups.
- The presence of 13.8% Hotel/Boutique listings indicates integration with traditional hospitality.
Shire of Campaspe Airbnb Room Capacity Analysis (2025): Bedroom Distribution
Distribution of Listings by Number of Bedrooms
Room Capacity Insights for Shire of Campaspe
- The dominant room capacity in Shire of Campaspe is 3 bedrooms listings, making up 24.1% of the market. This suggests a strong demand for properties suitable for families or small groups.
- Together, 3 bedrooms and 2 bedrooms properties represent 44.8% of the active Airbnb listings in Shire of Campaspe, indicating a high concentration in these sizes.
- A significant 55.1% of listings offer 3+ bedrooms, catering to larger groups and families seeking more space in Shire of Campaspe.
Shire of Campaspe Vacation Rental Guest Capacity Trends (2025)
Distribution of Listings by Guest Capacity
Guest Capacity Insights for Shire of Campaspe
- The most common guest capacity trend in Shire of Campaspe vacation rentals is listings accommodating 8+ guests (41.4%). This suggests the primary traveler segment is likely larger groups.
- Properties designed for 8+ guests and 2 guests dominate the Shire of Campaspe STR market, accounting for 65.5% of listings.
- 51.7% of properties accommodate 6+ guests, serving the market segment for larger families or group travel in Shire of Campaspe.
- On average, properties in Shire of Campaspe are equipped to host 5.1 guests.
Shire of Campaspe Airbnb Booking Patterns (2025): Available vs. Booked Days
Available Days Distribution
Booked Days Distribution
Booking Pattern Insights for Shire of Campaspe
- The most common availability pattern in Shire of Campaspe falls within the 181-270 days range, representing 44.8% of listings. This suggests many properties have significant open periods on their calendars.
- Approximately 86.2% of listings show high availability (181+ days open annually), indicating potential for increased bookings or specific owner usage patterns.
- For booked days, the 91-180 days range is most frequent in Shire of Campaspe (48.3%), reflecting common guest stay durations or potential owner blocking patterns.
- A notable 13.7% of properties secure long booking periods (181+ days booked per year), highlighting successful long-term rental strategies or significant owner usage.
Shire of Campaspe Airbnb Minimum Stay Requirements Analysis
Distribution of Listings by Minimum Night Requirement
1 Night
5 listings
17.9% of total
2 Nights
12 listings
42.9% of total
3 Nights
2 listings
7.1% of total
30+ Nights
9 listings
32.1% of total
Key Insights
- The most prevalent minimum stay requirement in Shire of Campaspe is 2 Nights, adopted by 42.9% of listings. This highlights the market's preference for shorter, flexible bookings.
- A strong majority (60.8%) of the Shire of Campaspe Airbnb data shows acceptance of very short stays (1-2 nights), indicating a dynamic, high-turnover market.
- A significant segment (32.1%) caters to monthly stays (30+ nights) in Shire of Campaspe, pointing to opportunities in the extended-stay market.
Recommendations
- Align with the market by considering a 2 Nights minimum stay, as 42.9% of Shire of Campaspe hosts use this setting.
- If feasible, allowing 1-night stays, especially midweek or during low season, could capture last-minute bookings, as only 17.9% currently do.
- A 2-night minimum appears standard (42.9%). Consider this for weekends or peak periods.
- Explore offering discounts for stays of 30+ nights to attract the 32.1% of the market seeking extended stays.
- Adjust minimum nights based on seasonality – potentially shorter during low season and longer during peak demand periods in Shire of Campaspe.
Shire of Campaspe Airbnb Cancellation Policy Trends Analysis (2025)
Super Strict 30 Days
1 listings
3.6% of total
Flexible
6 listings
21.4% of total
Moderate
9 listings
32.1% of total
Firm
3 listings
10.7% of total
Strict
9 listings
32.1% of total
Cancellation Policy Insights for Shire of Campaspe
- The prevailing Airbnb cancellation policy trend in Shire of Campaspe is Moderate, used by 32.1% of listings.
- There's a relatively balanced mix between guest-friendly (53.5%) and stricter (42.8%) policies, offering choices for different guest needs.
Recommendations for Hosts
- Consider adopting a Moderate policy to align with the 32.1% market standard in Shire of Campaspe.
- With 32.1% using Strict terms, this is a viable option in Shire of Campaspe, particularly for high-value properties or during peak demand periods.
- Regularly review your cancellation policy against competitors and market demand shifts in Shire of Campaspe.
Shire of Campaspe STR Booking Lead Time Analysis (2025)
Average Booking Lead Time by Month
Booking Lead Time Insights for Shire of Campaspe
- The overall average booking lead time for vacation rentals in Shire of Campaspe is 48 days.
- Guests book furthest in advance for stays during September (average 96 days), likely coinciding with peak travel demand or local events.
- The shortest booking windows occur for stays in October (average 47 days), indicating more last-minute travel plans during this time.
- Seasonally, Spring (73 days avg.) sees the longest lead times, while Fall (65 days avg.) has the shortest, reflecting typical travel planning cycles.
Recommendations for Hosts
- Use the overall average lead time (48 days) as a baseline for your pricing and availability strategy in Shire of Campaspe.
- For September stays, consider implementing length-of-stay discounts or slightly higher rates for bookings made less than 96 days out to capitalize on advance planning.
- Target marketing efforts for the Spring season well in advance (at least 73 days) to capture early planners.
- Monitor your own booking lead times against these Shire of Campaspe averages to identify opportunities for dynamic pricing adjustments.
Popular & Essential Airbnb Amenities in Shire of Campaspe (2025)
Amenity Prevalence
Amenity Insights for Shire of Campaspe
- Essential amenities in Shire of Campaspe that guests expect include: Refrigerator, Hot water, Smoke alarm, Dishes and silverware, Kitchen, Heating, Air conditioning, Essentials, TV, Cooking basics. Lacking these (any) could significantly impact bookings.
Recommendations for Hosts
- Ensure your listing includes all essential amenities for Shire of Campaspe: Refrigerator, Hot water, Smoke alarm, Dishes and silverware, Kitchen, Heating, Air conditioning, Essentials, TV, Cooking basics.
- Prioritize adding missing essentials: Heating, Air conditioning, Essentials, TV, Cooking basics.
- Highlight unique or less common amenities you offer (e.g., hot tub, dedicated workspace, EV charger) in your listing description and photos.
- Regularly check competitor amenities in Shire of Campaspe to stay competitive.
Shire of Campaspe Airbnb Guest Demographics & Profile Analysis (2025)
Guest Profile Summary for Shire of Campaspe
- The typical guest profile for Airbnb in Shire of Campaspe consists of primarily domestic travelers (97%), often arriving from nearby Melbourne, typically belonging to the Post-2000s (Gen Z/Alpha) group (50%), primarily speaking English or German.
- Domestic travelers account for 97.3% of guests.
- Key international markets include Australia (97.3%) and India (0.9%).
- Top languages spoken are English (71.9%) followed by German (7%).
- A significant demographic segment is the Post-2000s (Gen Z/Alpha) group, representing 50% of guests.
Recommendations for Hosts
- Target domestic marketing efforts towards travelers from Melbourne and Victoria.
- Tailor amenities and listing descriptions to appeal to the dominant Post-2000s (Gen Z/Alpha) demographic (e.g., highlight fast WiFi, smart home features, local guides).
- Highlight unique local experiences or amenities relevant to the primary guest profile.
- Consider seasonal promotions aligned with peak travel times for key origin markets.
Nearby Short-Term Rental Market Comparison
How does the Shire of Campaspe Airbnb market stack up against its neighbors? Compare key performance metrics like average monthly revenue, ADR, and occupancy rates in surrounding areas to understand the broader regional STR landscape.
| Market | Active Properties | Monthly Revenue | Daily Rate | Avg. Occupancy |
|---|---|---|---|---|
| Lancefield | 18 | $4,069 | $343.64 | 49% |
| Trentham | 52 | $3,455 | $269.84 | 41% |
| Lyonville | 10 | $3,441 | $349.65 | 35% |
| Nagambie | 33 | $3,381 | $300.42 | 40% |
| Shire of Strathbogie | 43 | $3,173 | $314.72 | 37% |
| Shire of Hepburn | 283 | $3,120 | $298.86 | 36% |
| Shire of Murrindindi | 70 | $3,061 | $268.84 | 40% |
| Daylesford | 462 | $3,028 | $297.26 | 35% |
| Moama | 53 | $2,999 | $310.37 | 35% |
| Malmsbury | 11 | $2,957 | $232.06 | 38% |