Sale Airbnb Market Analysis 2025: Short Term Rental Data & Vacation Rental Statistics in Victoria, Australia
Is Airbnb profitable in Sale in 2025? Explore comprehensive Airbnb analytics for Sale, Victoria, Australia to uncover income potential. This 2025 STR market report for Sale, based on AirROI data from April 2024 to March 2025, reveals key trends in the niche market of 73 active listings.
Whether you're considering an Airbnb investment in Sale, optimizing your existing vacation rental, or exploring rental arbitrage opportunities, understanding the Sale Airbnb data is crucial. Leveraging the low regulation environment is key to maximizing your short term rental income potential. Let's dive into the specifics.
Key Sale Airbnb Performance Metrics Overview
Monthly Airbnb Revenue Variations & Income Potential in Sale (2025)
Understanding the monthly revenue variations for Airbnb listings in Sale is key to maximizing your short term rental income potential. Seasonality significantly impacts earnings. Our analysis, based on data from the past 12 months, shows that the peak revenue month for STRs in Sale is typically May, while February often presents the lowest earnings, highlighting opportunities for strategic pricing adjustments during shoulder and low seasons. Explore the typical Airbnb income in Sale across different performance tiers:
- Best-in-class properties (Top 10%) achieve $2,797+ monthly, often utilizing dynamic pricing and superior guest experiences.
- Strong performing properties (Top 25%) earn $1,947 or more, indicating effective management and desirable locations/amenities.
- Typical properties (Median) generate around $1,085 per month, representing the average market performance.
- Entry-level properties (Bottom 25%) see earnings around $578, often with potential for optimization.
Average Monthly Airbnb Earnings Trend in Sale
Sale Airbnb Occupancy Rate Trends (2025)
Maximize your bookings by understanding the Sale STR occupancy trends. Seasonal demand shifts significantly influence how often properties are booked. Typically, Novembersees the highest demand (peak season occupancy), while February experiences the lowest (low season). Effective strategies, like adjusting minimum stays or offering promotions, can boost occupancy during slower periods. Here's how different property tiers perform in Sale:
- Best-in-class properties (Top 10%) achieve 70%+ occupancy, indicating high desirability and potentially optimized availability.
- Strong performing properties (Top 25%) maintain 51% or higher occupancy, suggesting good market fit and guest satisfaction.
- Typical properties (Median) have an occupancy rate around 26%.
- Entry-level properties (Bottom 25%) average 12% occupancy, potentially facing higher vacancy.
Average Monthly Occupancy Rate Trend in Sale
Average Daily Rate (ADR) Airbnb Trends in Sale (2025)
Effective short term rental pricing strategy in Sale involves understanding monthly ADR fluctuations. The Average Daily Rate (ADR) for Airbnb in Sale typically peaks in October and dips lowest during March. Leveraging Airbnb dynamic pricing tools or strategies based on this seasonality can significantly boost revenue. Here's a look at the typical nightly rates achieved:
- Best-in-class properties (Top 10%) command rates of $242+ per night, often due to premium features or locations.
- Strong performing properties (Top 25%) achieve nightly rates of $163 or more.
- Typical properties (Median) charge around $121 per night.
- Entry-level properties (Bottom 25%) earn around $86 per night.
Average Daily Rate (ADR) Trend by Month in Sale
Get Live Sale Market Intelligence 👇

Explore Real-time Analytics
Airbnb Seasonality Analysis & Trends in Sale (2025)
Peak Season (May, June, November)
- Revenue averages $1,685 per month
- Occupancy rates average 35.3%
- Daily rates average $136
Shoulder Season
- Revenue averages $1,419 per month
- Occupancy maintains around 33.8%
- Daily rates hold near $139
Low Season (January, February, March)
- Revenue drops to average $1,069 per month
- Occupancy decreases to average 30.7%
- Daily rates adjust to average $131
Seasonality Insights for Sale
- The Airbnb seasonality in Sale shows moderate seasonality with distinct peak and low periods. While the sections above show seasonal averages, it's also insightful to look at the extremes:
- During the high season, the absolute peak month showcases Sale's highest earning potential, with monthly revenues capable of climbing to $1,808, occupancy reaching a high of 40.3%, and ADRs peaking at $141.
- Conversely, the slowest single month of the year, typically falling within the low season, marks the market's lowest point. In this month, revenue might dip to $876, occupancy could drop to 27.3%, and ADRs may adjust down to $130.
- Understanding both the seasonal averages and these monthly peaks and troughs in revenue, occupancy, and ADR is crucial for maximizing your Airbnb profit potential in Sale.
Seasonal Strategies for Maximizing Profit
- Peak Season: Maximize revenue through premium pricing and potentially longer minimum stays. Ensure high availability.
- Low Season: Offer competitive pricing, special promotions (e.g., extended stay discounts), and flexible cancellation policies. Target off-season travelers like remote workers or budget-conscious guests.
- Shoulder Seasons: Implement dynamic pricing that balances peak and low rates. Target weekend travelers or specific events. Offer slightly more flexible terms than peak season.
- Regularly analyze your own performance against these Sale seasonality benchmarks and adjust your pricing and availability strategy accordingly.
Best Areas for Airbnb Investment in Sale (2025)
Exploring the top neighborhoods for short-term rentals in Sale? This section highlights key areas, outlining why they are attractive for hosts and guests, along with notable local attractions. Consider these locations based on your target guest profile and investment strategy.
| Neighborhood / Area | Why Host Here? (Target Guests & Appeal) | Key Attractions & Landmarks |
|---|---|---|
| Lakeside | Situated near the stunning Lake Wendouree, this area is popular with both tourists and locals looking to enjoy outdoor activities such as boating, fishing, and picnicking. | Lake Wendouree, Botanical Gardens, Ballarat Wildlife Park, Ballarat Golf Club, Rodondo Beach |
| Ballarat CBD | The heart of Ballarat, known for its historic architecture, shops, and restaurants. A hub for cultural experiences, art, and events, attracting visitors year-round. | Eureka Centre, Ballarat Art Gallery, Historic Arboretum, Central Square, Ballarat Tramway Museum |
| Sovereign Hill | A living museum that recreates the gold rush era, attracting history buffs and families alike. Offers a unique experience and draws large crowds. | Sovereign Hill, Gold Museum, Goldfields Railway, Ballarat Botanical Gardens, Eureka Stockade |
| Mount Helen | A quieter suburban area surrounded by nature, ideal for families and those seeking a peaceful retreat. Close to universities and parks. | Mount Helen Nature Reserve, Federation University, Ballarat Vegan Festival, Mount Clear College, Ballarat Golf Course |
| Miners Rest | A growing suburb with easy access to the Ballarat city center, popular among families looking for affordable housing options and local amenities. | Local parks, Miners Rest Primary School, Wendouree Railway Station, Shopping facilities, Nearby wineries |
| Sebastopol | A family-friendly suburb with a strong community vibe. It offers good access to local amenities and is perfect for longer-term stays. | Sebastopol Library, Bunnings Warehouse, Local Markets, Schools, Community parks |
| Delacombe | An emerging suburb with new developments and shopping centers. Ideal for tourists looking for modern accommodations close to the city. | Delacombe Town Centre, Local parks, Ballarat Sports and Events Centre, Short drive to Lake Wendouree, Community events |
| Ballarat East | This area offers a mix of historical significance and natural beauty, with historical landmarks and access to scenic trails. | Mt. Pleasant Reservoir, Ballarat East Public Hall, Bushwalking trails, Historical monuments, Local eateries |
Understanding Airbnb License Requirements & STR Laws in Sale (2025)
While Sale, Victoria, Australia currently shows low STR regulations, specific Airbnb license requirements might still exist or change. Always verify the latest short term rental regulations and Airbnb license requirements directly with local government authorities for Sale to ensure full compliance before hosting.
(Source: AirROI data, 2025, finding no licensed listings among those analyzed)
Top Performing Airbnb Properties in Sale (2025)
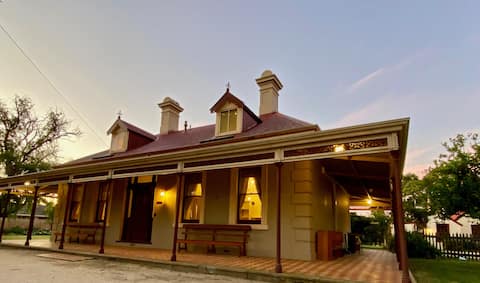
Benchmark your potential! Explore examples of top-performing Airbnb properties in Salebased on Trailing Twelve Month (TTM) revenue. Analyze their characteristics, revenue, occupancy rate, and ADR to understand what drives success in this market.

Prime inner CBD location. Tranquil enclosed garden
Entire Place • 3 bedrooms
Bon Accord Homestead
Entire Place • 5 bedrooms
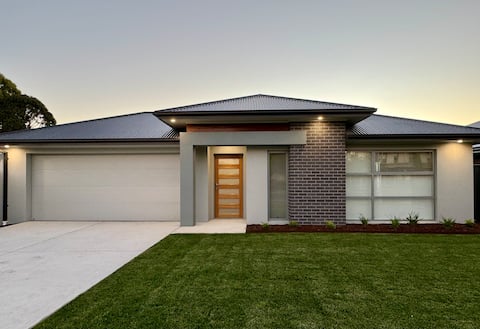
BRAND NEW! Close to the Hospital
Entire Place • 3 bedrooms

BRAND NEW! Near Lake Guthridge
Entire Place • 3 bedrooms

Addy's Place
Entire Place • 3 bedrooms

School House
Entire Place • 1 bedroom
Note: Performance varies based on location, size, amenities, seasonality, and management quality. Data reflects the past 12 months.
Top Performing Airbnb Hosts in Sale (2025)
Learn from the best! This table showcases top-performing Airbnb hosts in Sale based on the number of properties managed and estimated total revenue over the past year. Analyze their scale and performance metrics.
| Host Name | Properties | Grossing Revenue | Stay Reviews | Avg Rating |
|---|---|---|---|---|
| Lillian | 21 | $185,281 | 808 | 4.87/5.0 |
| Tim | 5 | $97,393 | 96 | 4.96/5.0 |
| Pam | 5 | $77,256 | 115 | 4.92/5.0 |
| Melanie | 2 | $66,548 | 23 | 5.00/5.0 |
| Ross | 3 | $44,327 | 833 | 4.87/5.0 |
| Tom From Siesta Central Apartm | 4 | $38,256 | 70 | 4.57/5.0 |
| Michelle | 1 | $37,741 | 59 | 4.98/5.0 |
| Andrew | 1 | $31,434 | 52 | 4.90/5.0 |
| Sally | 1 | $25,047 | 170 | 4.96/5.0 |
| Edward | 1 | $23,386 | 47 | 4.94/5.0 |
Analyzing the strategies of top hosts, such as their property selection, pricing, and guest communication, can offer valuable lessons for optimizing your own Airbnb operations in Sale.
Dive Deeper: Advanced Sale STR Market Data (2025)
Ready to unlock more insights? AirROI provides access to advanced metrics and comprehensive Airbnb data for Sale. Explore detailed analytics beyond this report to refine your investment strategy, optimize pricing, and maximize your vacation rental profits.
Explore Advanced MetricsSale Short-Term Rental Market Composition (2025): Property & Room Types
Room Type Distribution
Property Type Distribution
Market Composition Insights for Sale
- The Sale Airbnb market composition is heavily skewed towards Entire Home/Apt listings, which make up 80.8% of the 73 active rentals. This indicates strong guest preference for privacy and space.
- Looking at the property type distribution in Sale, House properties are the most common (42.5%), reflecting the local real estate landscape.
- Houses represent a significant 42.5% portion, catering likely to families or larger groups.
- The presence of 5.5% Hotel/Boutique listings indicates integration with traditional hospitality.
- Smaller segments like outdoor/unique (combined 2.7%) offer potential for unique stay experiences.
Sale Airbnb Room Capacity Analysis (2025): Bedroom Distribution
Distribution of Listings by Number of Bedrooms
Room Capacity Insights for Sale
- The dominant room capacity in Sale is 1 bedroom listings, making up 32.9% of the market. This suggests a strong demand for properties suitable for couples or solo travelers.
- Together, 1 bedroom and 2 bedrooms properties represent 60.3% of the active Airbnb listings in Sale, indicating a high concentration in these sizes.
- A significant 24.7% of listings offer 3+ bedrooms, catering to larger groups and families seeking more space in Sale.
Sale Vacation Rental Guest Capacity Trends (2025)
Distribution of Listings by Guest Capacity
Guest Capacity Insights for Sale
- The most common guest capacity trend in Sale vacation rentals is listings accommodating 2 guests (35.6%). This suggests the primary traveler segment is likely couples or solo travelers.
- Properties designed for 2 guests and 4 guests dominate the Sale STR market, accounting for 54.8% of listings.
- 24.7% of properties accommodate 6+ guests, serving the market segment for larger families or group travel in Sale.
- On average, properties in Sale are equipped to host 3.6 guests.
Sale Airbnb Booking Patterns (2025): Available vs. Booked Days
Available Days Distribution
Booked Days Distribution
Booking Pattern Insights for Sale
- The most common availability pattern in Sale falls within the 271-366 days range, representing 57.5% of listings. This suggests many properties have significant open periods on their calendars.
- Approximately 82.2% of listings show high availability (181+ days open annually), indicating potential for increased bookings or specific owner usage patterns.
- For booked days, the 31-90 days range is most frequent in Sale (30.1%), reflecting common guest stay durations or potential owner blocking patterns.
- A notable 17.8% of properties secure long booking periods (181+ days booked per year), highlighting successful long-term rental strategies or significant owner usage.
Sale Airbnb Minimum Stay Requirements Analysis
Distribution of Listings by Minimum Night Requirement
1 Night
24 listings
36.9% of total
2 Nights
18 listings
27.7% of total
3 Nights
6 listings
9.2% of total
30+ Nights
17 listings
26.2% of total
Key Insights
- The most prevalent minimum stay requirement in Sale is 1 Night, adopted by 36.9% of listings. This highlights the market's preference for shorter, flexible bookings.
- A strong majority (64.6%) of the Sale Airbnb data shows acceptance of very short stays (1-2 nights), indicating a dynamic, high-turnover market.
- A significant segment (26.2%) caters to monthly stays (30+ nights) in Sale, pointing to opportunities in the extended-stay market.
Recommendations
- Align with the market by considering a 1 Night minimum stay, as 36.9% of Sale hosts use this setting.
- Explore offering discounts for stays of 30+ nights to attract the 26.2% of the market seeking extended stays.
- Adjust minimum nights based on seasonality – potentially shorter during low season and longer during peak demand periods in Sale.
Sale Airbnb Cancellation Policy Trends Analysis (2025)
Flexible
27 listings
39.7% of total
Moderate
12 listings
17.6% of total
Firm
3 listings
4.4% of total
Strict
26 listings
38.2% of total
Cancellation Policy Insights for Sale
- The prevailing Airbnb cancellation policy trend in Sale is Flexible, used by 39.7% of listings.
- There's a relatively balanced mix between guest-friendly (57.3%) and stricter (42.6%) policies, offering choices for different guest needs.
Recommendations for Hosts
- Consider adopting a Flexible policy to align with the 39.7% market standard in Sale.
- With 38.2% using Strict terms, this is a viable option in Sale, particularly for high-value properties or during peak demand periods.
- Regularly review your cancellation policy against competitors and market demand shifts in Sale.
Sale STR Booking Lead Time Analysis (2025)
Average Booking Lead Time by Month
Booking Lead Time Insights for Sale
- The overall average booking lead time for vacation rentals in Sale is 41 days.
- Guests book furthest in advance for stays during March (average 60 days), likely coinciding with peak travel demand or local events.
- The shortest booking windows occur for stays in September (average 24 days), indicating more last-minute travel plans during this time.
- Seasonally, Spring (46 days avg.) sees the longest lead times, while Summer (37 days avg.) has the shortest, reflecting typical travel planning cycles.
Recommendations for Hosts
- Use the overall average lead time (41 days) as a baseline for your pricing and availability strategy in Sale.
- For March stays, consider implementing length-of-stay discounts or slightly higher rates for bookings made less than 60 days out to capitalize on advance planning.
- Target marketing efforts for the Spring season well in advance (at least 46 days) to capture early planners.
- Monitor your own booking lead times against these Sale averages to identify opportunities for dynamic pricing adjustments.
Popular & Essential Airbnb Amenities in Sale (2025)
Amenity Prevalence
Amenity Insights for Sale
- Essential amenities in Sale that guests expect include: TV, Smoke alarm. Lacking these (any) could significantly impact bookings.
- Popular amenities like Heating, Air conditioning, Free parking on premises are common but not universal. Offering these can provide a competitive edge.
- Warning: Wifi is not universally provided but is considered essential globally. Ensure reliable Wifi is offered.
Recommendations for Hosts
- Ensure your listing includes all essential amenities for Sale: TV, Smoke alarm.
- Prioritize adding missing essentials: TV, Smoke alarm.
- Consider adding popular differentiators like Heating or Air conditioning to increase appeal.
- Highlight unique or less common amenities you offer (e.g., hot tub, dedicated workspace, EV charger) in your listing description and photos.
- Regularly check competitor amenities in Sale to stay competitive.
Sale Airbnb Guest Demographics & Profile Analysis (2025)
Guest Profile Summary for Sale
- The typical guest profile for Airbnb in Sale consists of primarily domestic travelers (91%), often arriving from nearby Melbourne, typically belonging to the Post-2000s (Gen Z/Alpha) group (50%), primarily speaking English or German.
- Domestic travelers account for 91.4% of guests.
- Key international markets include Australia (91.4%) and United Kingdom (2.1%).
- Top languages spoken are English (73.1%) followed by German (5.1%).
- A significant demographic segment is the Post-2000s (Gen Z/Alpha) group, representing 50% of guests.
Recommendations for Hosts
- Target domestic marketing efforts towards travelers from Melbourne and Victoria.
- Tailor amenities and listing descriptions to appeal to the dominant Post-2000s (Gen Z/Alpha) demographic (e.g., highlight fast WiFi, smart home features, local guides).
- Highlight unique local experiences or amenities relevant to the primary guest profile.
- Consider seasonal promotions aligned with peak travel times for key origin markets.
Nearby Short-Term Rental Market Comparison
How does the Sale Airbnb market stack up against its neighbors? Compare key performance metrics like average monthly revenue, ADR, and occupancy rates in surrounding areas to understand the broader regional STR landscape.
| Market | Active Properties | Monthly Revenue | Daily Rate | Avg. Occupancy |
|---|---|---|---|---|
| Howqua Inlet | 13 | $3,634 | $322.01 | 37% |
| Yanakie | 16 | $3,473 | $212.73 | 54% |
| Shire of Mansfield | 89 | $3,347 | $392.77 | 34% |
| Jamieson | 37 | $3,138 | $283.80 | 33% |
| Sawmill Settlement | 92 | $3,033 | $408.14 | 32% |
| Mansfield | 150 | $3,009 | $327.34 | 35% |
| Goughs Bay | 36 | $2,835 | $321.64 | 31% |
| Foster | 14 | $2,754 | $250.76 | 45% |
| Merrijig | 50 | $2,482 | $358.81 | 30% |
| Shire of Baw Baw | 57 | $2,459 | $223.07 | 37% |