Rutherglen Airbnb Market Analysis 2025: Short Term Rental Data & Vacation Rental Statistics in Victoria, Australia
Is Airbnb profitable in Rutherglen in 2025? Explore comprehensive Airbnb analytics for Rutherglen, Victoria, Australia to uncover income potential. This 2025 STR market report for Rutherglen, based on AirROI data from April 2024 to March 2025, reveals key trends in the niche market of 49 active listings.
Whether you're considering an Airbnb investment in Rutherglen, optimizing your existing vacation rental, or exploring rental arbitrage opportunities, understanding the Rutherglen Airbnb data is crucial. Leveraging the low regulation environment is key to maximizing your short term rental income potential. Let's dive into the specifics.
Key Rutherglen Airbnb Performance Metrics Overview
Monthly Airbnb Revenue Variations & Income Potential in Rutherglen (2025)
Understanding the monthly revenue variations for Airbnb listings in Rutherglen is key to maximizing your short term rental income potential. Seasonality significantly impacts earnings. Our analysis, based on data from the past 12 months, shows that the peak revenue month for STRs in Rutherglen is typically April, while February often presents the lowest earnings, highlighting opportunities for strategic pricing adjustments during shoulder and low seasons. Explore the typical Airbnb income in Rutherglen across different performance tiers:
- Best-in-class properties (Top 10%) achieve $4,930+ monthly, often utilizing dynamic pricing and superior guest experiences.
- Strong performing properties (Top 25%) earn $3,234 or more, indicating effective management and desirable locations/amenities.
- Typical properties (Median) generate around $2,076 per month, representing the average market performance.
- Entry-level properties (Bottom 25%) see earnings around $1,265, often with potential for optimization.
Average Monthly Airbnb Earnings Trend in Rutherglen
Rutherglen Airbnb Occupancy Rate Trends (2025)
Maximize your bookings by understanding the Rutherglen STR occupancy trends. Seasonal demand shifts significantly influence how often properties are booked. Typically, Aprilsees the highest demand (peak season occupancy), while February experiences the lowest (low season). Effective strategies, like adjusting minimum stays or offering promotions, can boost occupancy during slower periods. Here's how different property tiers perform in Rutherglen:
- Best-in-class properties (Top 10%) achieve 61%+ occupancy, indicating high desirability and potentially optimized availability.
- Strong performing properties (Top 25%) maintain 44% or higher occupancy, suggesting good market fit and guest satisfaction.
- Typical properties (Median) have an occupancy rate around 29%.
- Entry-level properties (Bottom 25%) average 18% occupancy, potentially facing higher vacancy.
Average Monthly Occupancy Rate Trend in Rutherglen
Average Daily Rate (ADR) Airbnb Trends in Rutherglen (2025)
Effective short term rental pricing strategy in Rutherglen involves understanding monthly ADR fluctuations. The Average Daily Rate (ADR) for Airbnb in Rutherglen typically peaks in January and dips lowest during May. Leveraging Airbnb dynamic pricing tools or strategies based on this seasonality can significantly boost revenue. Here's a look at the typical nightly rates achieved:
- Best-in-class properties (Top 10%) command rates of $475+ per night, often due to premium features or locations.
- Strong performing properties (Top 25%) achieve nightly rates of $308 or more.
- Typical properties (Median) charge around $201 per night.
- Entry-level properties (Bottom 25%) earn around $162 per night.
Average Daily Rate (ADR) Trend by Month in Rutherglen
Get Live Rutherglen Market Intelligence 👇

Explore Real-time Analytics
Airbnb Seasonality Analysis & Trends in Rutherglen (2025)
Peak Season (April, December, July)
- Revenue averages $3,282 per month
- Occupancy rates average 38.1%
- Daily rates average $292
Shoulder Season
- Revenue averages $2,935 per month
- Occupancy maintains around 32.2%
- Daily rates hold near $291
Low Season (February, August, September)
- Revenue drops to average $2,179 per month
- Occupancy decreases to average 29.6%
- Daily rates adjust to average $286
Seasonality Insights for Rutherglen
- The Airbnb seasonality in Rutherglen shows moderate seasonality with distinct peak and low periods. While the sections above show seasonal averages, it's also insightful to look at the extremes:
- During the high season, the absolute peak month showcases Rutherglen's highest earning potential, with monthly revenues capable of climbing to $3,483, occupancy reaching a high of 41.0%, and ADRs peaking at $312.
- Conversely, the slowest single month of the year, typically falling within the low season, marks the market's lowest point. In this month, revenue might dip to $1,829, occupancy could drop to 23.0%, and ADRs may adjust down to $277.
- Understanding both the seasonal averages and these monthly peaks and troughs in revenue, occupancy, and ADR is crucial for maximizing your Airbnb profit potential in Rutherglen.
Seasonal Strategies for Maximizing Profit
- Peak Season: Maximize revenue through premium pricing and potentially longer minimum stays. Ensure high availability.
- Low Season: Offer competitive pricing, special promotions (e.g., extended stay discounts), and flexible cancellation policies. Target off-season travelers like remote workers or budget-conscious guests.
- Shoulder Seasons: Implement dynamic pricing that balances peak and low rates. Target weekend travelers or specific events. Offer slightly more flexible terms than peak season.
- Regularly analyze your own performance against these Rutherglen seasonality benchmarks and adjust your pricing and availability strategy accordingly.
Best Areas for Airbnb Investment in Rutherglen (2025)
Exploring the top neighborhoods for short-term rentals in Rutherglen? This section highlights key areas, outlining why they are attractive for hosts and guests, along with notable local attractions. Consider these locations based on your target guest profile and investment strategy.
| Neighborhood / Area | Why Host Here? (Target Guests & Appeal) | Key Attractions & Landmarks |
|---|---|---|
| Rutherglen Town Centre | The heart of Rutherglen, known for its heritage buildings and local amenities. A convenient base for tourists exploring the wine region. | Rutherglen Wine Experience, Rutherglen Historical Society, Park Heritage, Commonwealth Hill Wines, Rutherglen Golf Club |
| Rutherglen Wine Region | Famed for its excellent wineries and wine tours, attracting wine enthusiasts and tourists looking for relaxation and fine dining. | Wineries, Wicked Virgin Olive Grove, Chesterfield Farm, Rutherglen Estates, Indigo Vineyard |
| Lake Tinnaburra | A beautiful spot for nature lovers, offering outdoor activities and scenic views. Great for those looking to escape the hustle and bustle. | Lake Tinnaburra, Fishing, Bird Watching, Picnic Areas, Walking Trails |
| Rutherglen Rail Trail | Perfect for cycling and walking, this trail attracts outdoor enthusiasts who enjoy exploring in a peaceful environment. | Rail Trail, Scenic Views, Bike Hire, Murray River, Wildlife Spotting |
| Glenrowan (nearby) | A historic town famous for its associations with the Ned Kelly story, attracting history buffs and tourists interested in Australian folklore. | Ned Kelly Museum, Glenrowan Woolshed, Historic Kelly Tree, Glenrowan Heritage Walk, Wine Tasting |
| Wahgunyah (nearby) | A quaint town on the banks of the Murray River, attractive for those interested in riverside relaxation and local charm. | Murray River, Riverside Parks, Local Wineries, Historic Buildings, Fishing and Boating |
| Corowa (nearby) | Just across the river, known for its charming town and local wineries. Provides additional options for guests wanting variety. | Corowa Whisky and Chocolate, Corowa Rural Museum, Local Vineyards, Riverpark, Historic Sites |
| Yarrawonga (nearby) | A larger town with amenities and recreational activities by the lake, drawing families and those looking for more entertainment options. | Lake Mulwala, Yarrawonga Mulwala Golf Club, Yarrawonga Main Street, Local Markets, Outdoor Activities |
Understanding Airbnb License Requirements & STR Laws in Rutherglen (2025)
While Rutherglen, Victoria, Australia currently shows low STR regulations, specific Airbnb license requirements might still exist or change. Always verify the latest short term rental regulations and Airbnb license requirements directly with local government authorities for Rutherglen to ensure full compliance before hosting.
(Source: AirROI data, 2025, finding no licensed listings among those analyzed)
Top Performing Airbnb Properties in Rutherglen (2025)
Benchmark your potential! Explore examples of top-performing Airbnb properties in Rutherglenbased on Trailing Twelve Month (TTM) revenue. Analyze their characteristics, revenue, occupancy rate, and ADR to understand what drives success in this market.
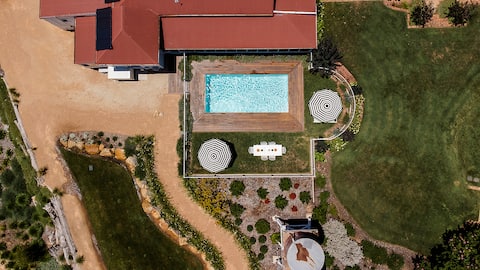
"Quondong Wahgunyah " - Luxury Private Estate
Entire Place • 8 bedrooms
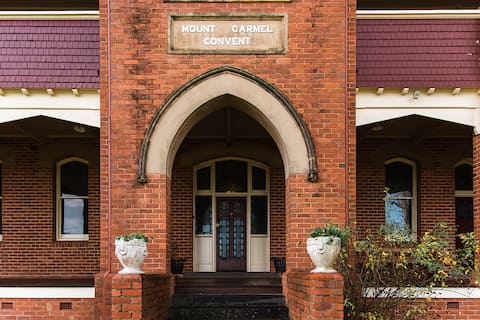
Rutherglen Convent
Entire Place • 11 bedrooms
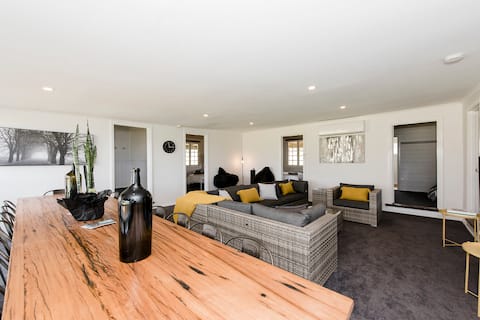
'The Pickers Cottage' at Mount Ophir Estate
Entire Place • 6 bedrooms

Harry's on Moodemere - One Bedroom Villa
Entire Place • 1 bedroom
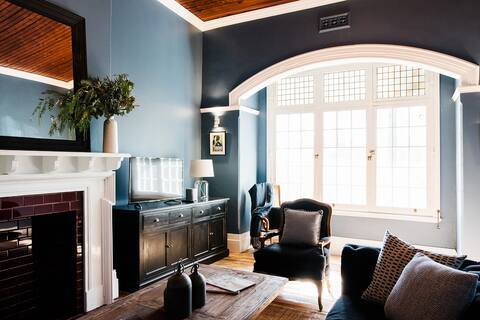
'The Residence' at Mount Ophir Estate
Entire Place • 5 bedrooms

Polly May's Rutherglen
Entire Place • 3 bedrooms
Note: Performance varies based on location, size, amenities, seasonality, and management quality. Data reflects the past 12 months.
Top Performing Airbnb Hosts in Rutherglen (2025)
Learn from the best! This table showcases top-performing Airbnb hosts in Rutherglen based on the number of properties managed and estimated total revenue over the past year. Analyze their scale and performance metrics.
| Host Name | Properties | Grossing Revenue | Stay Reviews | Avg Rating |
|---|---|---|---|---|
| Kaitlyn | 2 | $243,727 | 12 | 2.50/5.0 |
| Lucy | 6 | $160,912 | 616 | 4.86/5.0 |
| Michele | 6 | $135,126 | 76 | 5.00/5.0 |
| Micaela | 3 | $100,898 | 569 | 4.89/5.0 |
| Ben | 1 | $88,444 | 36 | 5.00/5.0 |
| Harry'S On Moodemere | 2 | $83,182 | 8 | 2.50/5.0 |
| Gabrielle | 2 | $47,192 | 224 | 4.82/5.0 |
| Yarrawonga Escapes | 1 | $46,735 | 25 | 4.48/5.0 |
| Alexandra | 2 | $45,197 | 267 | 4.84/5.0 |
| Amber | 3 | $40,323 | 46 | 3.33/5.0 |
Analyzing the strategies of top hosts, such as their property selection, pricing, and guest communication, can offer valuable lessons for optimizing your own Airbnb operations in Rutherglen.
Dive Deeper: Advanced Rutherglen STR Market Data (2025)
Ready to unlock more insights? AirROI provides access to advanced metrics and comprehensive Airbnb data for Rutherglen. Explore detailed analytics beyond this report to refine your investment strategy, optimize pricing, and maximize your vacation rental profits.
Explore Advanced MetricsRutherglen Short-Term Rental Market Composition (2025): Property & Room Types
Room Type Distribution
Property Type Distribution
Market Composition Insights for Rutherglen
- The Rutherglen Airbnb market composition is heavily skewed towards Entire Home/Apt listings, which make up 91.8% of the 49 active rentals. This indicates strong guest preference for privacy and space.
- Looking at the property type distribution in Rutherglen, House properties are the most common (73.5%), reflecting the local real estate landscape.
- Houses represent a significant 73.5% portion, catering likely to families or larger groups.
- The presence of 6.1% Hotel/Boutique listings indicates integration with traditional hospitality.
- Smaller segments like unique stays, apartment/condo (combined 4.0%) offer potential for unique stay experiences.
Rutherglen Airbnb Room Capacity Analysis (2025): Bedroom Distribution
Distribution of Listings by Number of Bedrooms
Room Capacity Insights for Rutherglen
- The dominant room capacity in Rutherglen is 1 bedroom listings, making up 26.5% of the market. This suggests a strong demand for properties suitable for couples or solo travelers.
- Together, 1 bedroom and 3 bedrooms properties represent 51.0% of the active Airbnb listings in Rutherglen, indicating a high concentration in these sizes.
- A significant 40.8% of listings offer 3+ bedrooms, catering to larger groups and families seeking more space in Rutherglen.
Rutherglen Vacation Rental Guest Capacity Trends (2025)
Distribution of Listings by Guest Capacity
Guest Capacity Insights for Rutherglen
- The most common guest capacity trend in Rutherglen vacation rentals is listings accommodating 2 guests (24.5%). This suggests the primary traveler segment is likely couples or solo travelers.
- Properties designed for 2 guests and 4 guests dominate the Rutherglen STR market, accounting for 46.9% of listings.
- 44.8% of properties accommodate 6+ guests, serving the market segment for larger families or group travel in Rutherglen.
- On average, properties in Rutherglen are equipped to host 4.6 guests.
Rutherglen Airbnb Booking Patterns (2025): Available vs. Booked Days
Available Days Distribution
Booked Days Distribution
Booking Pattern Insights for Rutherglen
- The most common availability pattern in Rutherglen falls within the 271-366 days range, representing 49% of listings. This suggests many properties have significant open periods on their calendars.
- Approximately 87.8% of listings show high availability (181+ days open annually), indicating potential for increased bookings or specific owner usage patterns.
- For booked days, the 31-90 days range is most frequent in Rutherglen (40.8%), reflecting common guest stay durations or potential owner blocking patterns.
- A notable 12.2% of properties secure long booking periods (181+ days booked per year), highlighting successful long-term rental strategies or significant owner usage.
Rutherglen Airbnb Minimum Stay Requirements Analysis
Distribution of Listings by Minimum Night Requirement
1 Night
7 listings
14.6% of total
2 Nights
29 listings
60.4% of total
3 Nights
2 listings
4.2% of total
30+ Nights
10 listings
20.8% of total
Key Insights
- The most prevalent minimum stay requirement in Rutherglen is 2 Nights, adopted by 60.4% of listings. This highlights the market's preference for shorter, flexible bookings.
- A strong majority (75.0%) of the Rutherglen Airbnb data shows acceptance of very short stays (1-2 nights), indicating a dynamic, high-turnover market.
- A significant segment (20.8%) caters to monthly stays (30+ nights) in Rutherglen, pointing to opportunities in the extended-stay market.
Recommendations
- Align with the market by considering a 2 Nights minimum stay, as 60.4% of Rutherglen hosts use this setting.
- If feasible, allowing 1-night stays, especially midweek or during low season, could capture last-minute bookings, as only 14.6% currently do.
- A 2-night minimum appears standard (60.4%). Consider this for weekends or peak periods.
- Explore offering discounts for stays of 30+ nights to attract the 20.8% of the market seeking extended stays.
- Adjust minimum nights based on seasonality – potentially shorter during low season and longer during peak demand periods in Rutherglen.
Rutherglen Airbnb Cancellation Policy Trends Analysis (2025)
Super Strict 30 Days
2 listings
4.4% of total
Flexible
7 listings
15.6% of total
Moderate
7 listings
15.6% of total
Firm
19 listings
42.2% of total
Strict
10 listings
22.2% of total
Cancellation Policy Insights for Rutherglen
- The prevailing Airbnb cancellation policy trend in Rutherglen is Firm, used by 42.2% of listings.
- A majority (64.4%) of hosts in Rutherglen utilize Firm or Strict policies, indicating a market where hosts prioritize booking security.
Recommendations for Hosts
- Consider adopting a Firm policy to align with the 42.2% market standard in Rutherglen.
- Regularly review your cancellation policy against competitors and market demand shifts in Rutherglen.
Rutherglen STR Booking Lead Time Analysis (2025)
Average Booking Lead Time by Month
Booking Lead Time Insights for Rutherglen
- The overall average booking lead time for vacation rentals in Rutherglen is 66 days.
- Guests book furthest in advance for stays during March (average 103 days), likely coinciding with peak travel demand or local events.
- The shortest booking windows occur for stays in July (average 41 days), indicating more last-minute travel plans during this time.
- Seasonally, Spring (88 days avg.) sees the longest lead times, while Summer (61 days avg.) has the shortest, reflecting typical travel planning cycles.
Recommendations for Hosts
- Use the overall average lead time (66 days) as a baseline for your pricing and availability strategy in Rutherglen.
- For March stays, consider implementing length-of-stay discounts or slightly higher rates for bookings made less than 103 days out to capitalize on advance planning.
- Target marketing efforts for the Spring season well in advance (at least 88 days) to capture early planners.
- Monitor your own booking lead times against these Rutherglen averages to identify opportunities for dynamic pricing adjustments.
Popular & Essential Airbnb Amenities in Rutherglen (2025)
Amenity Prevalence
Amenity Insights for Rutherglen
- Essential amenities in Rutherglen that guests expect include: Air conditioning, Smoke alarm, TV, Heating, Free parking on premises. Lacking these (any) could significantly impact bookings.
- Popular amenities like Hot water, Essentials, Iron are common but not universal. Offering these can provide a competitive edge.
- Warning: Wifi is not universally provided but is considered essential globally. Ensure reliable Wifi is offered.
Recommendations for Hosts
- Ensure your listing includes all essential amenities for Rutherglen: Air conditioning, Smoke alarm, TV, Heating, Free parking on premises.
- Prioritize adding missing essentials: Smoke alarm, TV, Heating, Free parking on premises.
- Consider adding popular differentiators like Hot water or Essentials to increase appeal.
- Highlight unique or less common amenities you offer (e.g., hot tub, dedicated workspace, EV charger) in your listing description and photos.
- Regularly check competitor amenities in Rutherglen to stay competitive.
Rutherglen Airbnb Guest Demographics & Profile Analysis (2025)
Guest Profile Summary for Rutherglen
- The typical guest profile for Airbnb in Rutherglen consists of primarily domestic travelers (97%), often arriving from nearby Melbourne, typically belonging to the Post-2000s (Gen Z/Alpha) group (50%), primarily speaking English or French.
- Domestic travelers account for 97.1% of guests.
- Key international markets include Australia (97.1%) and New Zealand (0.7%).
- Top languages spoken are English (85%) followed by French (4.4%).
- A significant demographic segment is the Post-2000s (Gen Z/Alpha) group, representing 50% of guests.
Recommendations for Hosts
- Target domestic marketing efforts towards travelers from Melbourne and Victoria.
- Tailor amenities and listing descriptions to appeal to the dominant Post-2000s (Gen Z/Alpha) demographic (e.g., highlight fast WiFi, smart home features, local guides).
- Highlight unique local experiences or amenities relevant to the primary guest profile.
- Consider seasonal promotions aligned with peak travel times for key origin markets.
Nearby Short-Term Rental Market Comparison
How does the Rutherglen Airbnb market stack up against its neighbors? Compare key performance metrics like average monthly revenue, ADR, and occupancy rates in surrounding areas to understand the broader regional STR landscape.
| Market | Active Properties | Monthly Revenue | Daily Rate | Avg. Occupancy |
|---|---|---|---|---|
| Howqua Inlet | 13 | $3,634 | $322.01 | 37% |
| Bright | 474 | $3,468 | $294.34 | 42% |
| Porepunkah | 40 | $3,397 | $328.54 | 37% |
| Nagambie | 33 | $3,381 | $300.42 | 40% |
| Shire of Mansfield | 89 | $3,347 | $392.77 | 34% |
| Shire of Strathbogie | 43 | $3,173 | $314.72 | 37% |
| Jamieson | 37 | $3,138 | $283.80 | 33% |
| Wandiligong | 20 | $3,137 | $271.80 | 41% |
| Shire of Murrindindi | 70 | $3,061 | $268.84 | 40% |
| Beechworth | 110 | $3,056 | $251.89 | 41% |