Rural City of Horsham Airbnb Market Analysis 2025: Short Term Rental Data & Vacation Rental Statistics in Victoria, Australia
Is Airbnb profitable in Rural City of Horsham in 2025? Explore comprehensive Airbnb analytics for Rural City of Horsham, Victoria, Australia to uncover income potential. This 2025 STR market report for Rural City of Horsham, based on AirROI data from April 2024 to March 2025, reveals key trends in the niche market of 49 active listings.
Whether you're considering an Airbnb investment in Rural City of Horsham, optimizing your existing vacation rental, or exploring rental arbitrage opportunities, understanding the Rural City of Horsham Airbnb data is crucial. Leveraging the low regulation environment is key to maximizing your short term rental income potential. Let's dive into the specifics.
Key Rural City of Horsham Airbnb Performance Metrics Overview
Monthly Airbnb Revenue Variations & Income Potential in Rural City of Horsham (2025)
Understanding the monthly revenue variations for Airbnb listings in Rural City of Horsham is key to maximizing your short term rental income potential. Seasonality significantly impacts earnings. Our analysis, based on data from the past 12 months, shows that the peak revenue month for STRs in Rural City of Horsham is typically May, while January often presents the lowest earnings, highlighting opportunities for strategic pricing adjustments during shoulder and low seasons. Explore the typical Airbnb income in Rural City of Horsham across different performance tiers:
- Best-in-class properties (Top 10%) achieve $3,541+ monthly, often utilizing dynamic pricing and superior guest experiences.
- Strong performing properties (Top 25%) earn $2,224 or more, indicating effective management and desirable locations/amenities.
- Typical properties (Median) generate around $1,130 per month, representing the average market performance.
- Entry-level properties (Bottom 25%) see earnings around $574, often with potential for optimization.
Average Monthly Airbnb Earnings Trend in Rural City of Horsham
Rural City of Horsham Airbnb Occupancy Rate Trends (2025)
Maximize your bookings by understanding the Rural City of Horsham STR occupancy trends. Seasonal demand shifts significantly influence how often properties are booked. Typically, Maysees the highest demand (peak season occupancy), while August experiences the lowest (low season). Effective strategies, like adjusting minimum stays or offering promotions, can boost occupancy during slower periods. Here's how different property tiers perform in Rural City of Horsham:
- Best-in-class properties (Top 10%) achieve 53%+ occupancy, indicating high desirability and potentially optimized availability.
- Strong performing properties (Top 25%) maintain 29% or higher occupancy, suggesting good market fit and guest satisfaction.
- Typical properties (Median) have an occupancy rate around 16%.
- Entry-level properties (Bottom 25%) average 9% occupancy, potentially facing higher vacancy.
Average Monthly Occupancy Rate Trend in Rural City of Horsham
Average Daily Rate (ADR) Airbnb Trends in Rural City of Horsham (2025)
Effective short term rental pricing strategy in Rural City of Horsham involves understanding monthly ADR fluctuations. The Average Daily Rate (ADR) for Airbnb in Rural City of Horsham typically peaks in January and dips lowest during August. Leveraging Airbnb dynamic pricing tools or strategies based on this seasonality can significantly boost revenue. Here's a look at the typical nightly rates achieved:
- Best-in-class properties (Top 10%) command rates of $235+ per night, often due to premium features or locations.
- Strong performing properties (Top 25%) achieve nightly rates of $212 or more.
- Typical properties (Median) charge around $203 per night.
- Entry-level properties (Bottom 25%) earn around $129 per night.
Average Daily Rate (ADR) Trend by Month in Rural City of Horsham
Get Live Rural City of Horsham Market Intelligence 👇
Explore Real-time Analytics
Airbnb Seasonality Analysis & Trends in Rural City of Horsham (2025)
Peak Season (May, June, April)
- Revenue averages $2,690 per month
- Occupancy rates average 29.5%
- Daily rates average $187
Shoulder Season
- Revenue averages $1,252 per month
- Occupancy maintains around 21.4%
- Daily rates hold near $190
Low Season (January, August, October)
- Revenue drops to average $994 per month
- Occupancy decreases to average 17.4%
- Daily rates adjust to average $193
Seasonality Insights for Rural City of Horsham
- The Airbnb seasonality in Rural City of Horsham shows highly seasonal trends requiring careful strategy. While the sections above show seasonal averages, it's also insightful to look at the extremes:
- During the high season, the absolute peak month showcases Rural City of Horsham's highest earning potential, with monthly revenues capable of climbing to $3,213, occupancy reaching a high of 38.5%, and ADRs peaking at $211.
- Conversely, the slowest single month of the year, typically falling within the low season, marks the market's lowest point. In this month, revenue might dip to $909, occupancy could drop to 15.5%, and ADRs may adjust down to $183.
- Understanding both the seasonal averages and these monthly peaks and troughs in revenue, occupancy, and ADR is crucial for maximizing your Airbnb profit potential in Rural City of Horsham.
Seasonal Strategies for Maximizing Profit
- Peak Season: Maximize revenue through premium pricing and potentially longer minimum stays. Ensure high availability.
- Low Season: Offer competitive pricing, special promotions (e.g., extended stay discounts), and flexible cancellation policies. Target off-season travelers like remote workers or budget-conscious guests.
- Shoulder Seasons: Implement dynamic pricing that balances peak and low rates. Target weekend travelers or specific events. Offer slightly more flexible terms than peak season.
- Regularly analyze your own performance against these Rural City of Horsham seasonality benchmarks and adjust your pricing and availability strategy accordingly.
Best Areas for Airbnb Investment in Rural City of Horsham (2025)
Exploring the top neighborhoods for short-term rentals in Rural City of Horsham? This section highlights key areas, outlining why they are attractive for hosts and guests, along with notable local attractions. Consider these locations based on your target guest profile and investment strategy.
| Neighborhood / Area | Why Host Here? (Target Guests & Appeal) | Key Attractions & Landmarks |
|---|---|---|
| Horsham CBD | The central business district of Horsham features a variety of shops, restaurants, and cultural experiences, making it an attractive location for visitors looking to explore the town. | Wimmera River, Horsham Botanic Gardens, Horsham Aquatic Centre, Horsham Arts Council, Lasseters Hotel |
| Dimboola | A charming rural town that provides a glimpse into Victoria's agricultural heartland. It's ideal for those looking for a quiet getaway with outdoor activities along the Wimmera River. | Dimboola Town Park, Wimmera River, Dimboola Lake, Historical buildings, Local cafes |
| Natimuk | Known for its vibrant local arts scene and proximity to the Grampians, Natimuk attracts outdoors enthusiasts and art lovers, providing unique accommodations. | Natimuk Gallery, Mount Arapiles, local rock climbing spots, Natimuk Town Food and Wine Festival, Natimuk Show |
| Murtoa | Home to the iconic Murtoa Stick Shed, this rural town attracts visitors interested in history and local culture, offering a peaceful rural escape. | Murtoa Stick Shed, Murtoa Historic House, local markets, Wimmera River walks, small-town charm |
| Warracknabeal | A rural center with a rich agricultural history, Warracknabeal is ideal for those exploring the Wimmera region, providing access to several local attractions. | Warracknabeal Historical Society, local wineries, Warracknabeal River Walk, Warracknabeal Golf Club, Warracknabeal Aquatic Centre |
| Stawell | Known as the home of the Stawell Gift, this town offers a mix of nature and history, appealing to sports fans and nature lovers alike. | Stawell Gift Hall of Fame, Grampians National Park, local vineyards, Stawell Historical Society, Stawell Racecourse |
| Halls Gap | Located within the Grampians National Park, Halls Gap attracts tourists for its stunning scenery and outdoor activities, making it a highly sought after Airbnb location. | Grampians National Park, MacKenzie Falls, local wildlife, Halls Gap Botanical Garden, Halls Gap Zoo |
| Broughton | This small community is close to several natural attractions and offers a peaceful retreat for visitors who enjoy rural life without being far from amenities. | Broughton Historic Homestead, local parks, wildlife spotting, bush walking trails, close to local wineries |
Understanding Airbnb License Requirements & STR Laws in Rural City of Horsham (2025)
While Rural City of Horsham, Victoria, Australia currently shows low STR regulations, specific Airbnb license requirements might still exist or change. Always verify the latest short term rental regulations and Airbnb license requirements directly with local government authorities for Rural City of Horsham to ensure full compliance before hosting.
(Source: AirROI data, 2025, finding no licensed listings among those analyzed)
Top Performing Airbnb Properties in Rural City of Horsham (2025)
Benchmark your potential! Explore examples of top-performing Airbnb properties in Rural City of Horshambased on Trailing Twelve Month (TTM) revenue. Analyze their characteristics, revenue, occupancy rate, and ADR to understand what drives success in this market.

Charming farm house on large historic olive grove.
Entire Place • 4 bedrooms
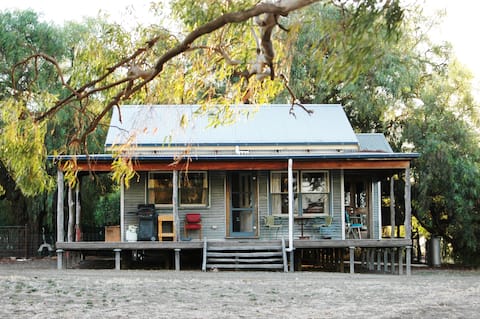
The Shack - a rustic, rural retreat
Entire Place • 2 bedrooms
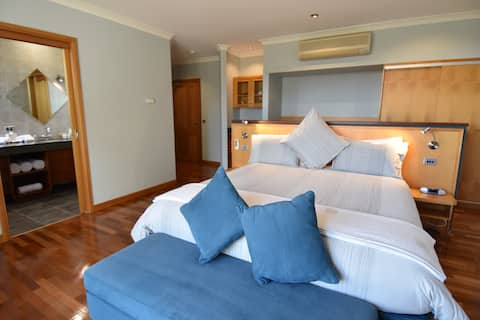
Deluxe King Room 1
Private Room • 1 bedroom

Tiny House 6 at Tiny Away, Escape @ Grampians' Edg
Entire Place • 1 bedroom

PRIMROSE COTTAGE
Entire Place • 2 bedrooms

GlamVan Camping
Entire Place • 1 bedroom
Note: Performance varies based on location, size, amenities, seasonality, and management quality. Data reflects the past 12 months.
Top Performing Airbnb Hosts in Rural City of Horsham (2025)
Learn from the best! This table showcases top-performing Airbnb hosts in Rural City of Horsham based on the number of properties managed and estimated total revenue over the past year. Analyze their scale and performance metrics.
| Host Name | Properties | Grossing Revenue | Stay Reviews | Avg Rating |
|---|---|---|---|---|
| Tiny Away | 32 | $337,800 | 371 | 3.79/5.0 |
| Host #159705400 | 2 | $45,042 | 3 | 0.00/5.0 |
| Dianna | 4 | $41,299 | 54 | 4.74/5.0 |
| Richard | 1 | $35,512 | 104 | 4.97/5.0 |
| Buffy | 1 | $32,332 | 780 | 4.97/5.0 |
| Melissa | 1 | $25,568 | 186 | 4.92/5.0 |
| Marita | 1 | $24,908 | 21 | 5.00/5.0 |
| Lismi | 1 | $23,438 | 41 | 4.80/5.0 |
| Phoebe | 1 | $11,282 | 49 | 4.92/5.0 |
| David | 1 | $9,895 | 22 | 4.86/5.0 |
Analyzing the strategies of top hosts, such as their property selection, pricing, and guest communication, can offer valuable lessons for optimizing your own Airbnb operations in Rural City of Horsham.
Dive Deeper: Advanced Rural City of Horsham STR Market Data (2025)
Ready to unlock more insights? AirROI provides access to advanced metrics and comprehensive Airbnb data for Rural City of Horsham. Explore detailed analytics beyond this report to refine your investment strategy, optimize pricing, and maximize your vacation rental profits.
Explore Advanced MetricsRural City of Horsham Short-Term Rental Market Composition (2025): Property & Room Types
Room Type Distribution
Property Type Distribution
Market Composition Insights for Rural City of Horsham
- The Rural City of Horsham Airbnb market composition is heavily skewed towards Entire Home/Apt listings, which make up 79.6% of the 49 active rentals. This indicates strong guest preference for privacy and space.
- Looking at the property type distribution in Rural City of Horsham, Outdoor/Unique properties are the most common (46.9%), reflecting the local real estate landscape.
- Houses represent a significant 40.8% portion, catering likely to families or larger groups.
- Smaller segments like others, apartment/condo, hotel/boutique (combined 12.3%) offer potential for unique stay experiences.
Rural City of Horsham Airbnb Room Capacity Analysis (2025): Bedroom Distribution
Distribution of Listings by Number of Bedrooms
Room Capacity Insights for Rural City of Horsham
- The dominant room capacity in Rural City of Horsham is 1 bedroom listings, making up 73.5% of the market. This suggests a strong demand for properties suitable for couples or solo travelers.
- Together, 1 bedroom and 2 bedrooms properties represent 87.8% of the active Airbnb listings in Rural City of Horsham, indicating a high concentration in these sizes.
- With over half the market (73.5%) consisting of studios or 1-bedroom units, Rural City of Horsham is particularly well-suited for individuals or couples.
Rural City of Horsham Vacation Rental Guest Capacity Trends (2025)
Distribution of Listings by Guest Capacity
Guest Capacity Insights for Rural City of Horsham
- The most common guest capacity trend in Rural City of Horsham vacation rentals is listings accommodating 2 guests (67.3%). This suggests the primary traveler segment is likely couples or solo travelers.
- Properties designed for 2 guests and 8+ guests dominate the Rural City of Horsham STR market, accounting for 77.5% of listings.
- A significant 67.3% of listings cater specifically to 1-2 guests, highlighting strong demand from couples and solo travelers in Rural City of Horsham.
- 12.2% of properties accommodate 6+ guests, serving the market segment for larger families or group travel in Rural City of Horsham.
- On average, properties in Rural City of Horsham are equipped to host 3.1 guests.
Rural City of Horsham Airbnb Booking Patterns (2025): Available vs. Booked Days
Available Days Distribution
Booked Days Distribution
Booking Pattern Insights for Rural City of Horsham
- The most common availability pattern in Rural City of Horsham falls within the 271-366 days range, representing 69.4% of listings. This suggests many properties have significant open periods on their calendars.
- Approximately 93.9% of listings show high availability (181+ days open annually), indicating potential for increased bookings or specific owner usage patterns.
- For booked days, the 31-90 days range is most frequent in Rural City of Horsham (40.8%), reflecting common guest stay durations or potential owner blocking patterns.
- A notable 6.1% of properties secure long booking periods (181+ days booked per year), highlighting successful long-term rental strategies or significant owner usage.
Rural City of Horsham Airbnb Minimum Stay Requirements Analysis
Distribution of Listings by Minimum Night Requirement
1 Night
8 listings
17.4% of total
2 Nights
12 listings
26.1% of total
30+ Nights
26 listings
56.5% of total
Key Insights
- The most prevalent minimum stay requirement in Rural City of Horsham is 30+ Nights, adopted by 56.5% of listings. This highlights the market's preference for longer commitments.
- A significant segment (56.5%) caters to monthly stays (30+ nights) in Rural City of Horsham, pointing to opportunities in the extended-stay market.
Recommendations
- Align with the market by considering a 30+ Nights minimum stay, as 56.5% of Rural City of Horsham hosts use this setting.
- If feasible, allowing 1-night stays, especially midweek or during low season, could capture last-minute bookings, as only 17.4% currently do.
- Explore offering discounts for stays of 30+ nights to attract the 56.5% of the market seeking extended stays.
- Adjust minimum nights based on seasonality – potentially shorter during low season and longer during peak demand periods in Rural City of Horsham.
Rural City of Horsham Airbnb Cancellation Policy Trends Analysis (2025)
Flexible
2 listings
4.9% of total
Moderate
4 listings
9.8% of total
Firm
33 listings
80.5% of total
Strict
2 listings
4.9% of total
Cancellation Policy Insights for Rural City of Horsham
- The prevailing Airbnb cancellation policy trend in Rural City of Horsham is Firm, used by 80.5% of listings.
- A majority (85.4%) of hosts in Rural City of Horsham utilize Firm or Strict policies, indicating a market where hosts prioritize booking security.
- Strict cancellation policies are quite rare (4.9%), potentially making listings with this policy less competitive unless justified by high demand or property type.
Recommendations for Hosts
- Consider adopting a Firm policy to align with the 80.5% market standard in Rural City of Horsham.
- Using a Strict policy might deter some guests, as only 4.9% of listings use it. Evaluate if potential revenue protection outweighs possible lower booking rates.
- Regularly review your cancellation policy against competitors and market demand shifts in Rural City of Horsham.
Rural City of Horsham STR Booking Lead Time Analysis (2025)
Average Booking Lead Time by Month
Booking Lead Time Insights for Rural City of Horsham
- The overall average booking lead time for vacation rentals in Rural City of Horsham is 33 days.
- Guests book furthest in advance for stays during July (average 89 days), likely coinciding with peak travel demand or local events.
- The shortest booking windows occur for stays in August (average 22 days), indicating more last-minute travel plans during this time.
- Seasonally, Winter (55 days avg.) sees the longest lead times, while Fall (43 days avg.) has the shortest, reflecting typical travel planning cycles.
Recommendations for Hosts
- Use the overall average lead time (33 days) as a baseline for your pricing and availability strategy in Rural City of Horsham.
- For July stays, consider implementing length-of-stay discounts or slightly higher rates for bookings made less than 89 days out to capitalize on advance planning.
- Target marketing efforts for the Winter season well in advance (at least 55 days) to capture early planners.
- Monitor your own booking lead times against these Rural City of Horsham averages to identify opportunities for dynamic pricing adjustments.
Popular & Essential Airbnb Amenities in Rural City of Horsham (2025)
Amenity Prevalence
Amenity Insights for Rural City of Horsham
- Essential amenities in Rural City of Horsham that guests expect include: Heating, Smoke alarm, Free parking on premises, Hot water, Dishes and silverware, Air conditioning. Lacking these (any) could significantly impact bookings.
- Popular amenities like Cooking basics, Wifi, Kitchen are common but not universal. Offering these can provide a competitive edge.
- Warning: Wifi is not universally provided but is considered essential globally. Ensure reliable Wifi is offered.
Recommendations for Hosts
- Ensure your listing includes all essential amenities for Rural City of Horsham: Heating, Smoke alarm, Free parking on premises, Hot water, Dishes and silverware, Air conditioning.
- Prioritize adding missing essentials: Dishes and silverware, Air conditioning.
- Consider adding popular differentiators like Cooking basics or Wifi to increase appeal.
- Highlight unique or less common amenities you offer (e.g., hot tub, dedicated workspace, EV charger) in your listing description and photos.
- Regularly check competitor amenities in Rural City of Horsham to stay competitive.
Rural City of Horsham Airbnb Guest Demographics & Profile Analysis (2025)
Guest Profile Summary for Rural City of Horsham
- The typical guest profile for Airbnb in Rural City of Horsham consists of primarily domestic travelers (91%), often arriving from nearby Melbourne, typically belonging to the Post-2000s (Gen Z/Alpha) group (50%), primarily speaking English or German.
- Domestic travelers account for 90.9% of guests.
- Key international markets include Australia (90.9%) and United Kingdom (1.7%).
- Top languages spoken are English (68.2%) followed by German (5.1%).
- A significant demographic segment is the Post-2000s (Gen Z/Alpha) group, representing 50% of guests.
Recommendations for Hosts
- Target domestic marketing efforts towards travelers from Melbourne and Adelaide.
- Tailor amenities and listing descriptions to appeal to the dominant Post-2000s (Gen Z/Alpha) demographic (e.g., highlight fast WiFi, smart home features, local guides).
- Highlight unique local experiences or amenities relevant to the primary guest profile.
- Consider seasonal promotions aligned with peak travel times for key origin markets.
Nearby Short-Term Rental Market Comparison
How does the Rural City of Horsham Airbnb market stack up against its neighbors? Compare key performance metrics like average monthly revenue, ADR, and occupancy rates in surrounding areas to understand the broader regional STR landscape.
| Market | Active Properties | Monthly Revenue | Daily Rate | Avg. Occupancy |
|---|---|---|---|---|
| Buninyong | 12 | $2,872 | $169.56 | 48% |
| Halls Gap | 184 | $2,669 | $191.17 | 45% |
| Horsham | 41 | $2,162 | $124.59 | 57% |
| Swan Hill | 20 | $2,162 | $165.64 | 49% |
| Creswick | 27 | $2,156 | $164.44 | 43% |
| Pomonal | 13 | $2,153 | $173.41 | 42% |
| Dunkeld | 37 | $2,152 | $197.44 | 40% |
| Rural City of Ararat | 15 | $2,122 | $167.92 | 39% |
| Ballarat | 429 | $1,743 | $143.48 | 44% |
| Clunes | 16 | $1,738 | $190.21 | 33% |