Newhaven Airbnb Market Analysis 2025: Short Term Rental Data & Vacation Rental Statistics in Victoria, Australia
Is Airbnb profitable in Newhaven in 2025? Explore comprehensive Airbnb analytics for Newhaven, Victoria, Australia to uncover income potential. This 2025 STR market report for Newhaven, based on AirROI data from April 2024 to March 2025, reveals key trends in the niche market of 22 active listings.
Whether you're considering an Airbnb investment in Newhaven, optimizing your existing vacation rental, or exploring rental arbitrage opportunities, understanding the Newhaven Airbnb data is crucial. Leveraging the low regulation environment is key to maximizing your short term rental income potential. Let's dive into the specifics.
Key Newhaven Airbnb Performance Metrics Overview
Monthly Airbnb Revenue Variations & Income Potential in Newhaven (2025)
Understanding the monthly revenue variations for Airbnb listings in Newhaven is key to maximizing your short term rental income potential. Seasonality significantly impacts earnings. Our analysis, based on data from the past 12 months, shows that the peak revenue month for STRs in Newhaven is typically June, while September often presents the lowest earnings, highlighting opportunities for strategic pricing adjustments during shoulder and low seasons. Explore the typical Airbnb income in Newhaven across different performance tiers:
- Best-in-class properties (Top 10%) achieve $7,271+ monthly, often utilizing dynamic pricing and superior guest experiences.
- Strong performing properties (Top 25%) earn $4,148 or more, indicating effective management and desirable locations/amenities.
- Typical properties (Median) generate around $2,489 per month, representing the average market performance.
- Entry-level properties (Bottom 25%) see earnings around $1,151, often with potential for optimization.
Average Monthly Airbnb Earnings Trend in Newhaven
Newhaven Airbnb Occupancy Rate Trends (2025)
Maximize your bookings by understanding the Newhaven STR occupancy trends. Seasonal demand shifts significantly influence how often properties are booked. Typically, Januarysees the highest demand (peak season occupancy), while April experiences the lowest (low season). Effective strategies, like adjusting minimum stays or offering promotions, can boost occupancy during slower periods. Here's how different property tiers perform in Newhaven:
- Best-in-class properties (Top 10%) achieve 74%+ occupancy, indicating high desirability and potentially optimized availability.
- Strong performing properties (Top 25%) maintain 58% or higher occupancy, suggesting good market fit and guest satisfaction.
- Typical properties (Median) have an occupancy rate around 32%.
- Entry-level properties (Bottom 25%) average 19% occupancy, potentially facing higher vacancy.
Average Monthly Occupancy Rate Trend in Newhaven
Average Daily Rate (ADR) Airbnb Trends in Newhaven (2025)
Effective short term rental pricing strategy in Newhaven involves understanding monthly ADR fluctuations. The Average Daily Rate (ADR) for Airbnb in Newhaven typically peaks in January and dips lowest during August. Leveraging Airbnb dynamic pricing tools or strategies based on this seasonality can significantly boost revenue. Here's a look at the typical nightly rates achieved:
- Best-in-class properties (Top 10%) command rates of $432+ per night, often due to premium features or locations.
- Strong performing properties (Top 25%) achieve nightly rates of $289 or more.
- Typical properties (Median) charge around $169 per night.
- Entry-level properties (Bottom 25%) earn around $123 per night.
Average Daily Rate (ADR) Trend by Month in Newhaven
Get Live Newhaven Market Intelligence 👇

Explore Real-time Analytics
Airbnb Seasonality Analysis & Trends in Newhaven (2025)
Peak Season (June, January, December)
- Revenue averages $4,574 per month
- Occupancy rates average 44.0%
- Daily rates average $277
Shoulder Season
- Revenue averages $3,219 per month
- Occupancy maintains around 36.8%
- Daily rates hold near $254
Low Season (February, August, September)
- Revenue drops to average $2,207 per month
- Occupancy decreases to average 36.6%
- Daily rates adjust to average $245
Seasonality Insights for Newhaven
- The Airbnb seasonality in Newhaven shows highly seasonal trends requiring careful strategy. While the sections above show seasonal averages, it's also insightful to look at the extremes:
- During the high season, the absolute peak month showcases Newhaven's highest earning potential, with monthly revenues capable of climbing to $4,684, occupancy reaching a high of 54.2%, and ADRs peaking at $301.
- Conversely, the slowest single month of the year, typically falling within the low season, marks the market's lowest point. In this month, revenue might dip to $2,084, occupancy could drop to 18.2%, and ADRs may adjust down to $233.
- Understanding both the seasonal averages and these monthly peaks and troughs in revenue, occupancy, and ADR is crucial for maximizing your Airbnb profit potential in Newhaven.
Seasonal Strategies for Maximizing Profit
- Peak Season: Maximize revenue through premium pricing and potentially longer minimum stays. Ensure high availability.
- Low Season: Offer competitive pricing, special promotions (e.g., extended stay discounts), and flexible cancellation policies. Target off-season travelers like remote workers or budget-conscious guests.
- Shoulder Seasons: Implement dynamic pricing that balances peak and low rates. Target weekend travelers or specific events. Offer slightly more flexible terms than peak season.
- Regularly analyze your own performance against these Newhaven seasonality benchmarks and adjust your pricing and availability strategy accordingly.
Best Areas for Airbnb Investment in Newhaven (2025)
Exploring the top neighborhoods for short-term rentals in Newhaven? This section highlights key areas, outlining why they are attractive for hosts and guests, along with notable local attractions. Consider these locations based on your target guest profile and investment strategy.
| Neighborhood / Area | Why Host Here? (Target Guests & Appeal) | Key Attractions & Landmarks |
|---|---|---|
| Ocean Grove | A beautiful coastal town, attracting tourists all year round with its stunning beaches and laid-back vibe. An ideal spot for family vacations and water sports enthusiasts. | Ocean Grove Main Beach, Grove Beach, Lake Connewarre, Ocean Grove Nature Reserve, Barwon Heads Golf Club |
| Portland | A historic town known for its maritime heritage and scenic coastal views. It draws visitors for its rich history and natural beauty, making it a popular destination for regional travelers. | Portland Botanic Gardens, Cape Nelson Lighthouse, Portland Maritime Discovery Centre, Great South West Walk, Bridgewater Bay |
| Bellarine Peninsula | Renowned for its wineries, beaches, and food scene, this area attracts food and wine lovers as well as beachgoers looking for a relaxing getaway. | Queenscliff Beach, Clifton Springs, Point Lonsdale, Bellarine Railway, Bellarine Peninsula wineries |
| Geelong | A vibrant city with a growing arts scene, Geelong is perfect for those looking for urban amenities combined with coastal life, catering to both business travelers and vacationers. | Geelong Waterfront, Geelong Gallery, Eastern Beach, Geelong Botanic Gardens, National Wool Museum |
| Daylesford | Famous for its spas and natural mineral springs, Daylesford attracts wellness tourists and those seeking a tranquil retreat in the countryside. | Lake Daylesford, Hepburn Bathhouse, Daylesford Spa Country Railway, Wombat Hill Botanical Gardens, Convent Gallery |
| Anglesea | A popular surf town located alongside the Great Ocean Road, Anglesea draws nature lovers and beachgoers alike, making it an attractive place for short-term rentals. | Anglesea Beach, Great Ocean Road, Anglesea Golf Club, Anglesea River, Point Roadknight Beach |
| Queenscliff | A charming coastal village known for its historic architecture and proximity to the ferry to Sorrento, attracting tourists wanting a mix of relaxation and exploration. | Queenscliff Harbour, Fort Nepean, Queenscliff Maritime Museum, Point Lonsdale Lighthouse, Blues Train |
| Kingscliff | With beautiful beaches and a vibrant dining scene, Kingscliff is popular year-round, especially among families and surfers. | Kingscliff Beach, Cudgen Creek, Cudgen Headland, Tweed River, Kingscliff Shopping Centre |
Understanding Airbnb License Requirements & STR Laws in Newhaven (2025)
While Newhaven, Victoria, Australia currently shows low STR regulations, specific Airbnb license requirements might still exist or change. Always verify the latest short term rental regulations and Airbnb license requirements directly with local government authorities for Newhaven to ensure full compliance before hosting.
(Source: AirROI data, 2025, finding no licensed listings among those analyzed)
Top Performing Airbnb Properties in Newhaven (2025)
Benchmark your potential! Explore examples of top-performing Airbnb properties in Newhavenbased on Trailing Twelve Month (TTM) revenue. Analyze their characteristics, revenue, occupancy rate, and ADR to understand what drives success in this market.
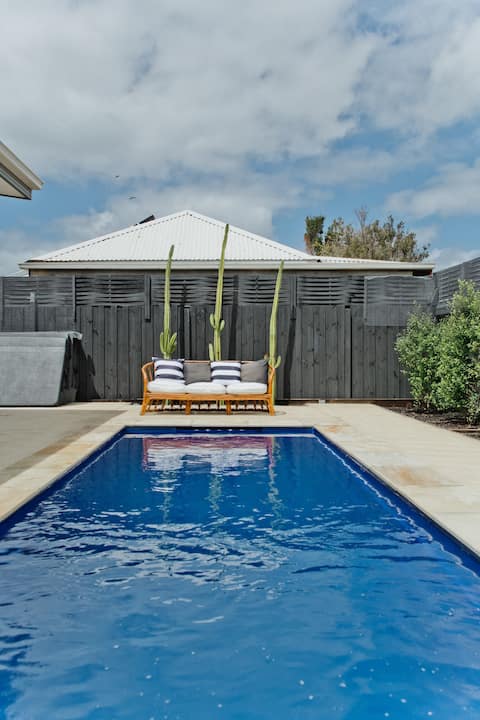
Sea View, Marina, Heated SwimSpa, Beach & Shops
Entire Place • 4 bedrooms
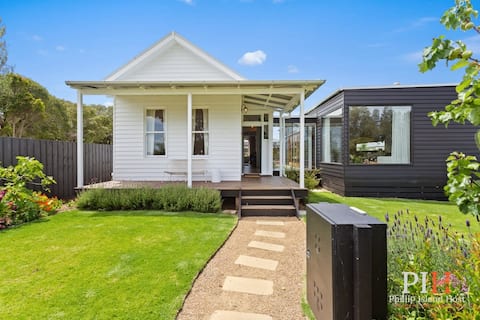
Haven Stay 4BR Retreat
Entire Place • 4 bedrooms

Lakehouse Estate is on 3 acres with private lake.
Entire Place • 6 bedrooms
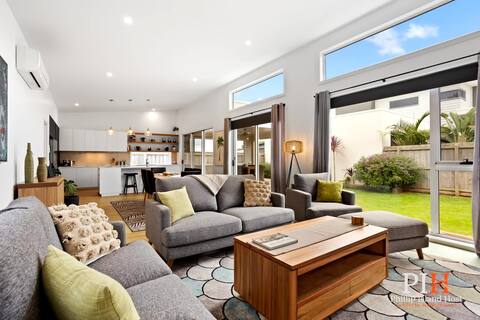
Family Luxury 3 Bdr King Bed.
Entire Place • 3 bedrooms
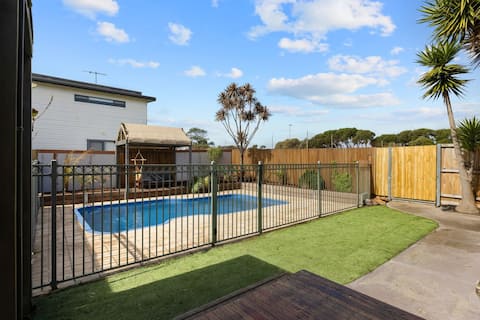
Family Haven
Entire Place • 4 bedrooms
Treetop Villa with water views on Phillip Island
Entire Place • 1 bedroom
Note: Performance varies based on location, size, amenities, seasonality, and management quality. Data reflects the past 12 months.
Top Performing Airbnb Hosts in Newhaven (2025)
Learn from the best! This table showcases top-performing Airbnb hosts in Newhaven based on the number of properties managed and estimated total revenue over the past year. Analyze their scale and performance metrics.
| Host Name | Properties | Grossing Revenue | Stay Reviews | Avg Rating |
|---|---|---|---|---|
| Brigitte | 1 | $118,984 | 19 | 5.00/5.0 |
| Matt | 1 | $62,197 | 24 | 4.96/5.0 |
| Stephen | 1 | $60,659 | 115 | 4.88/5.0 |
| Mathijs | 1 | $56,807 | 59 | 4.97/5.0 |
| Host #98536970 | 1 | $46,897 | 14 | 4.07/5.0 |
| Sarah And Lennon | 1 | $37,554 | 114 | 4.98/5.0 |
| Marina | 1 | $36,386 | 185 | 4.86/5.0 |
| Malcolm | 1 | $36,204 | 29 | 4.93/5.0 |
| Natalie | 1 | $29,526 | 5 | 5.00/5.0 |
| Elisha | 1 | $26,838 | 29 | 5.00/5.0 |
Analyzing the strategies of top hosts, such as their property selection, pricing, and guest communication, can offer valuable lessons for optimizing your own Airbnb operations in Newhaven.
Dive Deeper: Advanced Newhaven STR Market Data (2025)
Ready to unlock more insights? AirROI provides access to advanced metrics and comprehensive Airbnb data for Newhaven. Explore detailed analytics beyond this report to refine your investment strategy, optimize pricing, and maximize your vacation rental profits.
Explore Advanced MetricsNewhaven Short-Term Rental Market Composition (2025): Property & Room Types
Room Type Distribution
Property Type Distribution
Market Composition Insights for Newhaven
- The Newhaven Airbnb market composition is heavily skewed towards Entire Home/Apt listings, which make up 90.9% of the 22 active rentals. This indicates strong guest preference for privacy and space.
- Looking at the property type distribution in Newhaven, House properties are the most common (72.7%), reflecting the local real estate landscape.
- Houses represent a significant 72.7% portion, catering likely to families or larger groups.
- The presence of 13.6% Hotel/Boutique listings indicates integration with traditional hospitality.
- Smaller segments like others (combined 4.5%) offer potential for unique stay experiences.
Newhaven Airbnb Room Capacity Analysis (2025): Bedroom Distribution
Distribution of Listings by Number of Bedrooms
Room Capacity Insights for Newhaven
- The dominant room capacity in Newhaven is 3 bedrooms listings, making up 40.9% of the market. This suggests a strong demand for properties suitable for families or small groups.
- Together, 3 bedrooms and 2 bedrooms properties represent 59.1% of the active Airbnb listings in Newhaven, indicating a high concentration in these sizes.
- A significant 63.6% of listings offer 3+ bedrooms, catering to larger groups and families seeking more space in Newhaven.
Newhaven Vacation Rental Guest Capacity Trends (2025)
Distribution of Listings by Guest Capacity
Guest Capacity Insights for Newhaven
- The most common guest capacity trend in Newhaven vacation rentals is listings accommodating 8+ guests (27.3%). This suggests the primary traveler segment is likely larger groups.
- Properties designed for 8+ guests and 6 guests dominate the Newhaven STR market, accounting for 50.0% of listings.
- 59.1% of properties accommodate 6+ guests, serving the market segment for larger families or group travel in Newhaven.
- On average, properties in Newhaven are equipped to host 5.6 guests.
Newhaven Airbnb Booking Patterns (2025): Available vs. Booked Days
Available Days Distribution
Booked Days Distribution
Booking Pattern Insights for Newhaven
- The most common availability pattern in Newhaven falls within the 181-270 days range, representing 36.4% of listings. This suggests many properties have significant open periods on their calendars.
- Approximately 72.8% of listings show high availability (181+ days open annually), indicating potential for increased bookings or specific owner usage patterns.
- For booked days, the 91-180 days range is most frequent in Newhaven (36.4%), reflecting common guest stay durations or potential owner blocking patterns.
- A notable 27.3% of properties secure long booking periods (181+ days booked per year), highlighting successful long-term rental strategies or significant owner usage.
Newhaven Airbnb Minimum Stay Requirements Analysis
Distribution of Listings by Minimum Night Requirement
1 Night
2 listings
10% of total
2 Nights
5 listings
25% of total
3 Nights
1 listings
5% of total
7-29 Nights
1 listings
5% of total
30+ Nights
11 listings
55% of total
Key Insights
- The most prevalent minimum stay requirement in Newhaven is 30+ Nights, adopted by 55% of listings. This highlights the market's preference for longer commitments.
- A significant segment (55%) caters to monthly stays (30+ nights) in Newhaven, pointing to opportunities in the extended-stay market.
Recommendations
- Align with the market by considering a 30+ Nights minimum stay, as 55% of Newhaven hosts use this setting.
- If feasible, allowing 1-night stays, especially midweek or during low season, could capture last-minute bookings, as only 10% currently do.
- Explore offering discounts for stays of 30+ nights to attract the 55% of the market seeking extended stays.
- Adjust minimum nights based on seasonality – potentially shorter during low season and longer during peak demand periods in Newhaven.
Newhaven Airbnb Cancellation Policy Trends Analysis (2025)
Flexible
2 listings
11.1% of total
Moderate
9 listings
50% of total
Firm
4 listings
22.2% of total
Strict
3 listings
16.7% of total
Cancellation Policy Insights for Newhaven
- The prevailing Airbnb cancellation policy trend in Newhaven is Moderate, used by 50% of listings.
- There's a relatively balanced mix between guest-friendly (61.1%) and stricter (38.9%) policies, offering choices for different guest needs.
Recommendations for Hosts
- Consider adopting a Moderate policy to align with the 50% market standard in Newhaven.
- Regularly review your cancellation policy against competitors and market demand shifts in Newhaven.
Newhaven STR Booking Lead Time Analysis (2025)
Average Booking Lead Time by Month
Booking Lead Time Insights for Newhaven
- The overall average booking lead time for vacation rentals in Newhaven is 82 days.
- Guests book furthest in advance for stays during May (average 94 days), likely coinciding with peak travel demand or local events.
- The shortest booking windows occur for stays in August (average 19 days), indicating more last-minute travel plans during this time.
- Seasonally, Winter (72 days avg.) sees the longest lead times, while Summer (51 days avg.) has the shortest, reflecting typical travel planning cycles.
Recommendations for Hosts
- Use the overall average lead time (82 days) as a baseline for your pricing and availability strategy in Newhaven.
- For May stays, consider implementing length-of-stay discounts or slightly higher rates for bookings made less than 94 days out to capitalize on advance planning.
- Target marketing efforts for the Winter season well in advance (at least 72 days) to capture early planners.
- Monitor your own booking lead times against these Newhaven averages to identify opportunities for dynamic pricing adjustments.
Popular & Essential Airbnb Amenities in Newhaven (2025)
Amenity Prevalence
Amenity Insights for Newhaven
- Essential amenities in Newhaven that guests expect include: Free parking on premises, Heating, TV, Kitchen, Essentials, Smoke alarm, Hot water, Microwave, Refrigerator. Lacking these (any) could significantly impact bookings.
- Popular amenities like Hair dryer are common but not universal. Offering these can provide a competitive edge.
Recommendations for Hosts
- Ensure your listing includes all essential amenities for Newhaven: Free parking on premises, Heating, TV, Kitchen, Essentials, Smoke alarm, Hot water, Microwave, Refrigerator.
- Prioritize adding missing essentials: Kitchen, Essentials, Smoke alarm, Hot water, Microwave, Refrigerator.
- Consider adding popular differentiators like Hair dryer to increase appeal.
- Highlight unique or less common amenities you offer (e.g., hot tub, dedicated workspace, EV charger) in your listing description and photos.
- Regularly check competitor amenities in Newhaven to stay competitive.
Newhaven Airbnb Guest Demographics & Profile Analysis (2025)
Guest Profile Summary for Newhaven
- The typical guest profile for Airbnb in Newhaven consists of primarily domestic travelers (88%), often arriving from nearby Melbourne, typically belonging to the Post-2000s (Gen Z/Alpha) group (50%), primarily speaking English or Chinese.
- Domestic travelers account for 88.0% of guests.
- Key international markets include Australia (88%) and Singapore (4.6%).
- Top languages spoken are English (61.4%) followed by Chinese (6.5%).
- A significant demographic segment is the Post-2000s (Gen Z/Alpha) group, representing 50% of guests.
Recommendations for Hosts
- Target domestic marketing efforts towards travelers from Melbourne and Victoria.
- Tailor amenities and listing descriptions to appeal to the dominant Post-2000s (Gen Z/Alpha) demographic (e.g., highlight fast WiFi, smart home features, local guides).
- Highlight unique local experiences or amenities relevant to the primary guest profile.
- Consider seasonal promotions aligned with peak travel times for key origin markets.
Nearby Short-Term Rental Market Comparison
How does the Newhaven Airbnb market stack up against its neighbors? Compare key performance metrics like average monthly revenue, ADR, and occupancy rates in surrounding areas to understand the broader regional STR landscape.
| Market | Active Properties | Monthly Revenue | Daily Rate | Avg. Occupancy |
|---|---|---|---|---|
| Lancefield | 18 | $4,069 | $343.64 | 49% |
| Howqua Inlet | 13 | $3,634 | $322.01 | 37% |
| Leopold | 12 | $3,496 | $429.65 | 41% |
| Yanakie | 16 | $3,473 | $212.73 | 54% |
| Trentham | 52 | $3,455 | $269.84 | 41% |
| Lyonville | 10 | $3,441 | $349.65 | 35% |
| Shire of Mansfield | 89 | $3,347 | $392.77 | 34% |
| Jamieson | 37 | $3,138 | $283.80 | 33% |
| Shire of Hepburn | 283 | $3,120 | $298.86 | 36% |
| Shire of Murrindindi | 70 | $3,061 | $268.84 | 40% |