Metung Airbnb Market Analysis 2025: Short Term Rental Data & Vacation Rental Statistics in Victoria, Australia
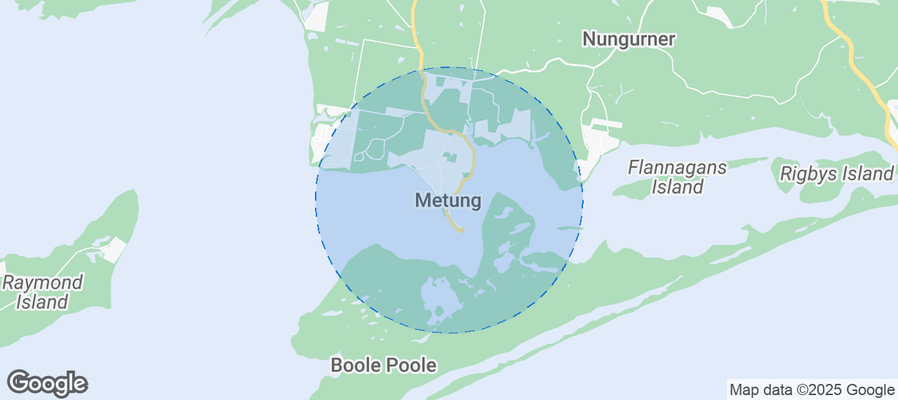
Is Airbnb profitable in Metung in 2025? Explore comprehensive Airbnb analytics for Metung, Victoria, Australia to uncover income potential. This 2025 STR market report for Metung, based on AirROI data from April 2024 to March 2025, reveals key trends in the niche market of 84 active listings.
Whether you're considering an Airbnb investment in Metung, optimizing your existing vacation rental, or exploring rental arbitrage opportunities, understanding the Metung Airbnb data is crucial. Leveraging the low regulation environment is key to maximizing your short term rental income potential. Let's dive into the specifics.
Key Metung Airbnb Performance Metrics Overview
Monthly Airbnb Revenue Variations & Income Potential in Metung (2025)
Understanding the monthly revenue variations for Airbnb listings in Metung is key to maximizing your short term rental income potential. Seasonality significantly impacts earnings. Our analysis, based on data from the past 12 months, shows that the peak revenue month for STRs in Metung is typically January, while August often presents the lowest earnings, highlighting opportunities for strategic pricing adjustments during shoulder and low seasons. Explore the typical Airbnb income in Metung across different performance tiers:
- Best-in-class properties (Top 10%) achieve $4,593+ monthly, often utilizing dynamic pricing and superior guest experiences.
- Strong performing properties (Top 25%) earn $3,191 or more, indicating effective management and desirable locations/amenities.
- Typical properties (Median) generate around $1,849 per month, representing the average market performance.
- Entry-level properties (Bottom 25%) see earnings around $1,050, often with potential for optimization.
Average Monthly Airbnb Earnings Trend in Metung
Metung Airbnb Occupancy Rate Trends (2025)
Maximize your bookings by understanding the Metung STR occupancy trends. Seasonal demand shifts significantly influence how often properties are booked. Typically, Januarysees the highest demand (peak season occupancy), while June experiences the lowest (low season). Effective strategies, like adjusting minimum stays or offering promotions, can boost occupancy during slower periods. Here's how different property tiers perform in Metung:
- Best-in-class properties (Top 10%) achieve 63%+ occupancy, indicating high desirability and potentially optimized availability.
- Strong performing properties (Top 25%) maintain 43% or higher occupancy, suggesting good market fit and guest satisfaction.
- Typical properties (Median) have an occupancy rate around 27%.
- Entry-level properties (Bottom 25%) average 16% occupancy, potentially facing higher vacancy.
Average Monthly Occupancy Rate Trend in Metung
Average Daily Rate (ADR) Airbnb Trends in Metung (2025)
Effective short term rental pricing strategy in Metung involves understanding monthly ADR fluctuations. The Average Daily Rate (ADR) for Airbnb in Metung typically peaks in January and dips lowest during March. Leveraging Airbnb dynamic pricing tools or strategies based on this seasonality can significantly boost revenue. Here's a look at the typical nightly rates achieved:
- Best-in-class properties (Top 10%) command rates of $390+ per night, often due to premium features or locations.
- Strong performing properties (Top 25%) achieve nightly rates of $293 or more.
- Typical properties (Median) charge around $223 per night.
- Entry-level properties (Bottom 25%) earn around $161 per night.
Average Daily Rate (ADR) Trend by Month in Metung
Get Live Metung Market Intelligence 👇
Explore Real-time Analytics
Airbnb Seasonality Analysis & Trends in Metung (2025)
Peak Season (January, December, April)
- Revenue averages $3,743 per month
- Occupancy rates average 43.3%
- Daily rates average $276
Shoulder Season
- Revenue averages $1,949 per month
- Occupancy maintains around 28.8%
- Daily rates hold near $240
Low Season (August, September, October)
- Revenue drops to average $1,680 per month
- Occupancy decreases to average 26.5%
- Daily rates adjust to average $246
Seasonality Insights for Metung
- The Airbnb seasonality in Metung shows highly seasonal trends requiring careful strategy. While the sections above show seasonal averages, it's also insightful to look at the extremes:
- During the high season, the absolute peak month showcases Metung's highest earning potential, with monthly revenues capable of climbing to $4,541, occupancy reaching a high of 52.8%, and ADRs peaking at $307.
- Conversely, the slowest single month of the year, typically falling within the low season, marks the market's lowest point. In this month, revenue might dip to $1,571, occupancy could drop to 22.6%, and ADRs may adjust down to $228.
- Understanding both the seasonal averages and these monthly peaks and troughs in revenue, occupancy, and ADR is crucial for maximizing your Airbnb profit potential in Metung.
Seasonal Strategies for Maximizing Profit
- Peak Season: Maximize revenue through premium pricing and potentially longer minimum stays. Ensure high availability.
- Low Season: Offer competitive pricing, special promotions (e.g., extended stay discounts), and flexible cancellation policies. Target off-season travelers like remote workers or budget-conscious guests.
- Shoulder Seasons: Implement dynamic pricing that balances peak and low rates. Target weekend travelers or specific events. Offer slightly more flexible terms than peak season.
- Regularly analyze your own performance against these Metung seasonality benchmarks and adjust your pricing and availability strategy accordingly.
Best Areas for Airbnb Investment in Metung (2025)
Exploring the top neighborhoods for short-term rentals in Metung? This section highlights key areas, outlining why they are attractive for hosts and guests, along with notable local attractions. Consider these locations based on your target guest profile and investment strategy.
| Neighborhood / Area | Why Host Here? (Target Guests & Appeal) | Key Attractions & Landmarks |
|---|---|---|
| Metung Village | Charming village atmosphere with scenic views of the lake and access to local shops and restaurants. Perfect for families and couples looking for a peaceful getaway by the water. | Metung Hot Springs, Metung Golf Club, Kalimna Lookout |
| Shaving Point | Beautiful waterfront area with stunning views and easy access to the Metung Marina. Great for water activities like boating and fishing, attracting outdoor enthusiasts. | Shaving Point Walking Track, Picnic areas, Scenic lookouts |
| Eggins Bay | A quiet, residential area offering a more secluded experience. Ideal for travelers seeking tranquility and nature, with close proximity to the lake and bushland. | Metung Nature Reserve, Bushwalking trails, Kayaking opportunities |
| Bancroft Bay | Picturesque bay surrounded by natural beauty, attracting visitors for its stunning sunsets and vibrant wildlife. A fantastic place for nature lovers. | Sunset viewing spots, Relaxing areas |
| Kalinda Road | A peaceful area ideal for family vacations with spacious properties and access to the beach. Attracts families and groups for its amenities and comfort. | Picnic facilities, Quiet environment |
| Metung Hot Springs | A rejuvenating destination known for its natural hot springs. Attracts wellness travelers looking for relaxation and luxury experiences. | Soaking pools, Wellness activities |
| Lake King Views | Offers stunning views of Lake King, attracting visitors for its picturesque setting and opportunity for various water sports. | Picnic zones, Sunsets |
| Nyerimilang Heritage Park | A natural park with cultural significance, perfect for nature lovers and history enthusiasts. Offers various walking tracks and breathtaking views. | Cultural heritage sites, Educational trails |
Understanding Airbnb License Requirements & STR Laws in Metung (2025)
While Metung, Victoria, Australia currently shows low STR regulations, specific Airbnb license requirements might still exist or change. Always verify the latest short term rental regulations and Airbnb license requirements directly with local government authorities for Metung to ensure full compliance before hosting.
(Source: AirROI data, 2025, finding no licensed listings among those analyzed)
Top Performing Airbnb Properties in Metung (2025)
Benchmark your potential! Explore examples of top-performing Airbnb properties in Metungbased on Trailing Twelve Month (TTM) revenue. Analyze their characteristics, revenue, occupancy rate, and ADR to understand what drives success in this market.

Large Family Holiday Home
Entire Place • 6 bedrooms
The View @ Metung. Cosy, Comfy & Pet friendly!
Entire Place • 3 bedrooms

The Mariner
Entire Place • 3 bedrooms

Family home overlooking lake.
Entire Place • 5 bedrooms
BOARD FORM 54
Entire Place • 4 bedrooms
Amazing Views with Boat Mooring!
Entire Place • 4 bedrooms
Note: Performance varies based on location, size, amenities, seasonality, and management quality. Data reflects the past 12 months.
Top Performing Airbnb Hosts in Metung (2025)
Learn from the best! This table showcases top-performing Airbnb hosts in Metung based on the number of properties managed and estimated total revenue over the past year. Analyze their scale and performance metrics.
| Host Name | Properties | Grossing Revenue | Stay Reviews | Avg Rating |
|---|---|---|---|---|
| Holiday Makers | 21 | $350,389 | 147 | 2.56/5.0 |
| McMillans Of Metung | 15 | $339,152 | 225 | 4.79/5.0 |
| Gippsland Lakes Escapes | 7 | $180,325 | 105 | 4.84/5.0 |
| Fred And Judy | 3 | $102,857 | 258 | 4.92/5.0 |
| Cameron | 1 | $71,058 | 25 | 4.84/5.0 |
| Sally And Will | 1 | $68,495 | 203 | 4.88/5.0 |
| Jess | 4 | $67,357 | 94 | 4.74/5.0 |
| Ocean Blue | 1 | $63,477 | 21 | 4.81/5.0 |
| Katie | 1 | $55,141 | 132 | 4.92/5.0 |
| Tai | 1 | $48,204 | 254 | 4.75/5.0 |
Analyzing the strategies of top hosts, such as their property selection, pricing, and guest communication, can offer valuable lessons for optimizing your own Airbnb operations in Metung.
Dive Deeper: Advanced Metung STR Market Data (2025)
Ready to unlock more insights? AirROI provides access to advanced metrics and comprehensive Airbnb data for Metung. Explore detailed analytics beyond this report to refine your investment strategy, optimize pricing, and maximize your vacation rental profits.
Explore Advanced MetricsMetung Short-Term Rental Market Composition (2025): Property & Room Types
Room Type Distribution
Property Type Distribution
Market Composition Insights for Metung
- The Metung Airbnb market composition is heavily skewed towards Entire Home/Apt listings, which make up 100% of the 84 active rentals. This indicates strong guest preference for privacy and space.
- Looking at the property type distribution in Metung, House properties are the most common (77.4%), reflecting the local real estate landscape.
- Houses represent a significant 77.4% portion, catering likely to families or larger groups.
- Smaller segments like outdoor/unique, hotel/boutique, others (combined 8.4%) offer potential for unique stay experiences.
Metung Airbnb Room Capacity Analysis (2025): Bedroom Distribution
Distribution of Listings by Number of Bedrooms
Room Capacity Insights for Metung
- The dominant room capacity in Metung is 3 bedrooms listings, making up 35.7% of the market. This suggests a strong demand for properties suitable for families or small groups.
- Together, 3 bedrooms and 2 bedrooms properties represent 61.9% of the active Airbnb listings in Metung, indicating a high concentration in these sizes.
- A significant 60.7% of listings offer 3+ bedrooms, catering to larger groups and families seeking more space in Metung.
Metung Vacation Rental Guest Capacity Trends (2025)
Distribution of Listings by Guest Capacity
Guest Capacity Insights for Metung
- The most common guest capacity trend in Metung vacation rentals is listings accommodating 8+ guests (40.5%). This suggests the primary traveler segment is likely larger groups.
- Properties designed for 8+ guests and 6 guests dominate the Metung STR market, accounting for 64.3% of listings.
- 66.7% of properties accommodate 6+ guests, serving the market segment for larger families or group travel in Metung.
- On average, properties in Metung are equipped to host 6.0 guests.
Metung Airbnb Booking Patterns (2025): Available vs. Booked Days
Available Days Distribution
Booked Days Distribution
Booking Pattern Insights for Metung
- The most common availability pattern in Metung falls within the 271-366 days range, representing 51.2% of listings. This suggests many properties have significant open periods on their calendars.
- Approximately 90.5% of listings show high availability (181+ days open annually), indicating potential for increased bookings or specific owner usage patterns.
- For booked days, the 91-180 days range is most frequent in Metung (39.3%), reflecting common guest stay durations or potential owner blocking patterns.
- A notable 10.7% of properties secure long booking periods (181+ days booked per year), highlighting successful long-term rental strategies or significant owner usage.
Metung Airbnb Minimum Stay Requirements Analysis
Distribution of Listings by Minimum Night Requirement
1 Night
3 listings
3.8% of total
2 Nights
34 listings
43% of total
3 Nights
14 listings
17.7% of total
4-6 Nights
4 listings
5.1% of total
30+ Nights
24 listings
30.4% of total
Key Insights
- The most prevalent minimum stay requirement in Metung is 2 Nights, adopted by 43% of listings. This highlights the market's preference for shorter, flexible bookings.
- A significant segment (30.4%) caters to monthly stays (30+ nights) in Metung, pointing to opportunities in the extended-stay market.
Recommendations
- Align with the market by considering a 2 Nights minimum stay, as 43% of Metung hosts use this setting.
- If feasible, allowing 1-night stays, especially midweek or during low season, could capture last-minute bookings, as only 3.8% currently do.
- A 2-night minimum appears standard (43%). Consider this for weekends or peak periods.
- Explore offering discounts for stays of 30+ nights to attract the 30.4% of the market seeking extended stays.
- Adjust minimum nights based on seasonality – potentially shorter during low season and longer during peak demand periods in Metung.
Metung Airbnb Cancellation Policy Trends Analysis (2025)
Super Strict 60 Days
13 listings
17.8% of total
Super Strict 30 Days
1 listings
1.4% of total
Flexible
9 listings
12.3% of total
Moderate
26 listings
35.6% of total
Firm
9 listings
12.3% of total
Strict
15 listings
20.5% of total
Cancellation Policy Insights for Metung
- The prevailing Airbnb cancellation policy trend in Metung is Moderate, used by 35.6% of listings.
- There's a relatively balanced mix between guest-friendly (47.9%) and stricter (32.8%) policies, offering choices for different guest needs.
Recommendations for Hosts
- Consider adopting a Moderate policy to align with the 35.6% market standard in Metung.
- Regularly review your cancellation policy against competitors and market demand shifts in Metung.
Metung STR Booking Lead Time Analysis (2025)
Average Booking Lead Time by Month
Booking Lead Time Insights for Metung
- The overall average booking lead time for vacation rentals in Metung is 59 days.
- Guests book furthest in advance for stays during December (average 102 days), likely coinciding with peak travel demand or local events.
- The shortest booking windows occur for stays in August (average 30 days), indicating more last-minute travel plans during this time.
- Seasonally, Winter (78 days avg.) sees the longest lead times, while Summer (38 days avg.) has the shortest, reflecting typical travel planning cycles.
Recommendations for Hosts
- Use the overall average lead time (59 days) as a baseline for your pricing and availability strategy in Metung.
- For December stays, consider implementing length-of-stay discounts or slightly higher rates for bookings made less than 102 days out to capitalize on advance planning.
- Target marketing efforts for the Winter season well in advance (at least 78 days) to capture early planners.
- Monitor your own booking lead times against these Metung averages to identify opportunities for dynamic pricing adjustments.
Popular & Essential Airbnb Amenities in Metung (2025)
Amenity Prevalence
Amenity Insights for Metung
- Essential amenities in Metung that guests expect include: TV, Smoke alarm, Kitchen, Free parking on premises, Hot water, Heating. Lacking these (any) could significantly impact bookings.
- Popular amenities like Microwave, Dishes and silverware, Air conditioning are common but not universal. Offering these can provide a competitive edge.
Recommendations for Hosts
- Ensure your listing includes all essential amenities for Metung: TV, Smoke alarm, Kitchen, Free parking on premises, Hot water, Heating.
- Prioritize adding missing essentials: Smoke alarm, Kitchen, Free parking on premises, Hot water, Heating.
- Consider adding popular differentiators like Microwave or Dishes and silverware to increase appeal.
- Highlight unique or less common amenities you offer (e.g., hot tub, dedicated workspace, EV charger) in your listing description and photos.
- Regularly check competitor amenities in Metung to stay competitive.
Metung Airbnb Guest Demographics & Profile Analysis (2025)
Guest Profile Summary for Metung
- The typical guest profile for Airbnb in Metung consists of primarily domestic travelers (90%), often arriving from nearby Melbourne, typically belonging to the Post-2000s (Gen Z/Alpha) group (50%), primarily speaking English or Chinese.
- Domestic travelers account for 89.8% of guests.
- Key international markets include Australia (89.8%) and United Kingdom (3.5%).
- Top languages spoken are English (69.1%) followed by Chinese (5.3%).
- A significant demographic segment is the Post-2000s (Gen Z/Alpha) group, representing 50% of guests.
Recommendations for Hosts
- Target domestic marketing efforts towards travelers from Melbourne and Victoria.
- Tailor amenities and listing descriptions to appeal to the dominant Post-2000s (Gen Z/Alpha) demographic (e.g., highlight fast WiFi, smart home features, local guides).
- Highlight unique local experiences or amenities relevant to the primary guest profile.
- Consider seasonal promotions aligned with peak travel times for key origin markets.
Nearby Short-Term Rental Market Comparison
How does the Metung Airbnb market stack up against its neighbors? Compare key performance metrics like average monthly revenue, ADR, and occupancy rates in surrounding areas to understand the broader regional STR landscape.
| Market | Active Properties | Monthly Revenue | Daily Rate | Avg. Occupancy |
|---|---|---|---|---|
| Snowy Monaro Regional Council | 216 | $3,956 | $391.38 | 39% |
| Howqua Inlet | 13 | $3,634 | $322.01 | 37% |
| East Jindabyne | 108 | $3,506 | $389.01 | 40% |
| Yanakie | 16 | $3,473 | $212.73 | 54% |
| Bright | 474 | $3,468 | $294.34 | 42% |
| Porepunkah | 40 | $3,397 | $328.54 | 37% |
| Shire of Mansfield | 89 | $3,347 | $392.77 | 34% |
| Jamieson | 37 | $3,138 | $283.80 | 33% |
| Wandiligong | 20 | $3,137 | $271.80 | 41% |
| Beechworth | 110 | $3,056 | $251.89 | 41% |