Melbourne Airbnb Market Analysis 2025: Short Term Rental Data & Vacation Rental Statistics in Victoria, Australia
Is Airbnb profitable in Melbourne in 2025? Explore comprehensive Airbnb analytics for Melbourne, Victoria, Australia to uncover income potential. This 2025 STR market report for Melbourne, based on AirROI data from April 2024 to March 2025, reveals key trends in the bustling market of 17,323 active listings.
Whether you're considering an Airbnb investment in Melbourne, optimizing your existing vacation rental, or exploring rental arbitrage opportunities, understanding the Melbourne Airbnb data is crucial. Leveraging the low regulation environment is key to maximizing your short term rental income potential. Let's dive into the specifics.
Key Melbourne Airbnb Performance Metrics Overview
Monthly Airbnb Revenue Variations & Income Potential in Melbourne (2025)
Understanding the monthly revenue variations for Airbnb listings in Melbourne is key to maximizing your short term rental income potential. Seasonality significantly impacts earnings. Our analysis, based on data from the past 12 months, shows that the peak revenue month for STRs in Melbourne is typically January, while September often presents the lowest earnings, highlighting opportunities for strategic pricing adjustments during shoulder and low seasons. Explore the typical Airbnb income in Melbourne across different performance tiers:
- Best-in-class properties (Top 10%) achieve $5,909+ monthly, often utilizing dynamic pricing and superior guest experiences.
- Strong performing properties (Top 25%) earn $3,895 or more, indicating effective management and desirable locations/amenities.
- Typical properties (Median) generate around $2,390 per month, representing the average market performance.
- Entry-level properties (Bottom 25%) see earnings around $1,186, often with potential for optimization.
Average Monthly Airbnb Earnings Trend in Melbourne
Melbourne Airbnb Occupancy Rate Trends (2025)
Maximize your bookings by understanding the Melbourne STR occupancy trends. Seasonal demand shifts significantly influence how often properties are booked. Typically, Januarysees the highest demand (peak season occupancy), while June experiences the lowest (low season). Effective strategies, like adjusting minimum stays or offering promotions, can boost occupancy during slower periods. Here's how different property tiers perform in Melbourne:
- Best-in-class properties (Top 10%) achieve 88%+ occupancy, indicating high desirability and potentially optimized availability.
- Strong performing properties (Top 25%) maintain 73% or higher occupancy, suggesting good market fit and guest satisfaction.
- Typical properties (Median) have an occupancy rate around 48%.
- Entry-level properties (Bottom 25%) average 24% occupancy, potentially facing higher vacancy.
Average Monthly Occupancy Rate Trend in Melbourne
Average Daily Rate (ADR) Airbnb Trends in Melbourne (2025)
Effective short term rental pricing strategy in Melbourne involves understanding monthly ADR fluctuations. The Average Daily Rate (ADR) for Airbnb in Melbourne typically peaks in January and dips lowest during August. Leveraging Airbnb dynamic pricing tools or strategies based on this seasonality can significantly boost revenue. Here's a look at the typical nightly rates achieved:
- Best-in-class properties (Top 10%) command rates of $413+ per night, often due to premium features or locations.
- Strong performing properties (Top 25%) achieve nightly rates of $242 or more.
- Typical properties (Median) charge around $149 per night.
- Entry-level properties (Bottom 25%) earn around $94 per night.
Average Daily Rate (ADR) Trend by Month in Melbourne
Get Live Melbourne Market Intelligence 👇

Explore Real-time Analytics
Airbnb Seasonality Analysis & Trends in Melbourne (2025)
Peak Season (January, December, April)
- Revenue averages $3,764 per month
- Occupancy rates average 52.4%
- Daily rates average $223
Shoulder Season
- Revenue averages $2,933 per month
- Occupancy maintains around 47.0%
- Daily rates hold near $207
Low Season (February, August, September)
- Revenue drops to average $2,457 per month
- Occupancy decreases to average 48.1%
- Daily rates adjust to average $201
Seasonality Insights for Melbourne
- The Airbnb seasonality in Melbourne shows moderate seasonality with distinct peak and low periods. While the sections above show seasonal averages, it's also insightful to look at the extremes:
- During the high season, the absolute peak month showcases Melbourne's highest earning potential, with monthly revenues capable of climbing to $4,090, occupancy reaching a high of 55.7%, and ADRs peaking at $237.
- Conversely, the slowest single month of the year, typically falling within the low season, marks the market's lowest point. In this month, revenue might dip to $2,359, occupancy could drop to 40.9%, and ADRs may adjust down to $197.
- Understanding both the seasonal averages and these monthly peaks and troughs in revenue, occupancy, and ADR is crucial for maximizing your Airbnb profit potential in Melbourne.
Seasonal Strategies for Maximizing Profit
- Peak Season: Maximize revenue through premium pricing and potentially longer minimum stays. Ensure high availability.
- Low Season: Offer competitive pricing, special promotions (e.g., extended stay discounts), and flexible cancellation policies. Target off-season travelers like remote workers or budget-conscious guests.
- Shoulder Seasons: Implement dynamic pricing that balances peak and low rates. Target weekend travelers or specific events. Offer slightly more flexible terms than peak season.
- Regularly analyze your own performance against these Melbourne seasonality benchmarks and adjust your pricing and availability strategy accordingly.
Best Areas for Airbnb Investment in Melbourne (2025)
Exploring the top neighborhoods for short-term rentals in Melbourne? This section highlights key areas, outlining why they are attractive for hosts and guests, along with notable local attractions. Consider these locations based on your target guest profile and investment strategy.
| Neighborhood / Area | Why Host Here? (Target Guests & Appeal) | Key Attractions & Landmarks |
|---|---|---|
| Fitzroy | Trendy neighborhood known for its vibrant arts scene, eclectic shops, and diverse dining options. Popular with young professionals and creatives, making it a great location for short-term rentals. | Brunswick Street, Fitzroy Gardens, Smith Street, Street Art Murals, The Rose Street Artist Market |
| South Yarra | Upscale neighborhood famous for its shopping, dining, and nightlife. Close to the city center and the Yarra River, it's a preferred destination for both tourists and business travelers. | Chapel Street, Como Centre, Royal Botanic Gardens, Prahran Market, Yarra River Trails |
| St Kilda | Iconic beachside suburb known for its vibrant beach culture, nightlife, and the famous St Kilda Foreshore. Attracts tourists seeking relaxation and entertainment by the water. | St Kilda Beach, Luna Park, Acland Street, St Kilda Pier, Esplanade Market |
| North Melbourne | Emerging area with a mix of history and modernity. It's close to the city center and has a growing number of cafes, restaurants, and parks, appealing to both tourists and locals. | Queen Victoria Market, Melbourne Zoo, Royal Park, Victoria Street eateries, North Melbourne Arts House |
| Carlton | Home to the University of Melbourne and diverse cultural attractions. Draws in students and academics, as well as tourists interested in cultural experiences and food. | Lygon Street (Little Italy), Carlton Gardens, Melbourne Museum, Royal Exhibition Building, University of Melbourne |
| Docklands | Modern waterfront district with a mix of residential, commercial, and leisure spaces. Popular for events and shopping, making it appealing for short-term rentals. | DFO Docklands, Marvel Stadium, Victoria Harbour, The Melbourne Star Observation Wheel, Harbour Town Shopping Centre |
| Collingwood | A hip suburb known for its art scene, boutiques, and nightlife. It's becoming increasingly popular among tourists looking for trendy and vibrant neighborhoods. | Smith Street, Collingwood Children's Farm, Glastonbury Gardens, Fitzroy Football Club, Street Art |
| Southbank | Close to the city center and known for its cultural attractions, including the Arts Centre and Crown Casino. Popular for both leisure and business travelers due to its convenience. | Southbank Promenade, National Gallery of Victoria, Crown Casino, Melbourne Convention and Exhibition Centre, Eureka Skydeck |
Understanding Airbnb License Requirements & STR Laws in Melbourne (2025)
While Melbourne, Victoria, Australia currently shows low STR regulations, specific Airbnb license requirements might still exist or change. Always verify the latest short term rental regulations and Airbnb license requirements directly with local government authorities for Melbourne to ensure full compliance before hosting.
(Source: AirROI data, 2025, based on 0% licensed listings)
Top Performing Airbnb Properties in Melbourne (2025)
Benchmark your potential! Explore examples of top-performing Airbnb properties in Melbournebased on Trailing Twelve Month (TTM) revenue. Analyze their characteristics, revenue, occupancy rate, and ADR to understand what drives success in this market.
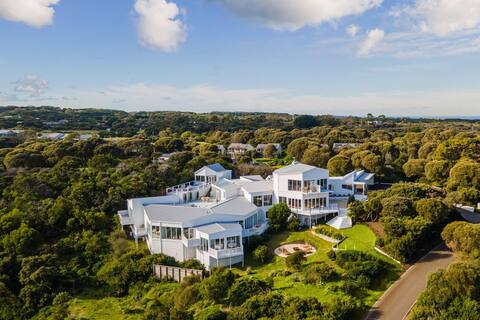
The Cape Retreat
Entire Place • 12 bedrooms
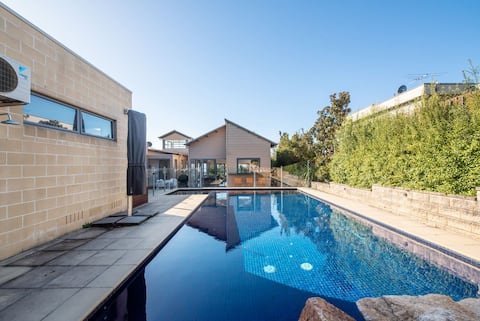
Bayview Bliss Gas Heated Spa and Solar Heated Pool
Entire Place • 7 bedrooms
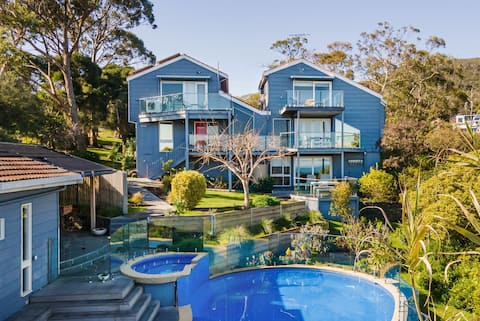
Bay Views From Drury Lane
Entire Place • 9 bedrooms
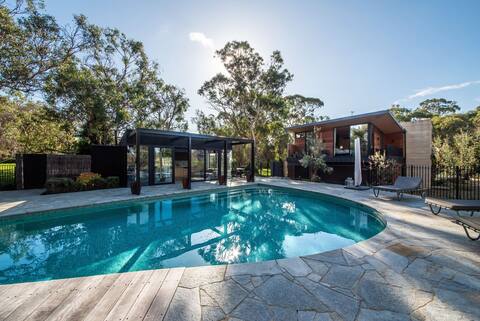
Atlas Retreat
Entire Place • 6 bedrooms

Rosebud Beach House - Walk to the beach
Entire Place • 3 bedrooms

Ultimate Private Acre Escape in Mount Martha
Entire Place • 5 bedrooms
Note: Performance varies based on location, size, amenities, seasonality, and management quality. Data reflects the past 12 months.
Top Performing Airbnb Hosts in Melbourne (2025)
Learn from the best! This table showcases top-performing Airbnb hosts in Melbourne based on the number of properties managed and estimated total revenue over the past year. Analyze their scale and performance metrics.
| Host Name | Properties | Grossing Revenue | Stay Reviews | Avg Rating |
|---|---|---|---|---|
| Kim | 134 | $14,597,947 | 4282 | 4.67/5.0 |
| Advante Homes | 141 | $5,870,855 | 3459 | 4.18/5.0 |
| Paul & Dan | 98 | $5,329,407 | 17180 | 4.82/5.0 |
| MadeComfy | 210 | $5,297,548 | 3832 | 3.92/5.0 |
| Bedspoke | 109 | $3,867,890 | 3683 | 4.65/5.0 |
| Lively Properties | 29 | $3,607,557 | 1749 | 4.92/5.0 |
| Lee | 41 | $3,327,667 | 8718 | 4.95/5.0 |
| Eduardo | 68 | $3,138,244 | 4263 | 4.64/5.0 |
| Jellis Craig Short Stays | 92 | $3,021,556 | 532 | 2.43/5.0 |
| Adji | 90 | $2,971,261 | 3882 | 4.63/5.0 |
Analyzing the strategies of top hosts, such as their property selection, pricing, and guest communication, can offer valuable lessons for optimizing your own Airbnb operations in Melbourne.
Dive Deeper: Advanced Melbourne STR Market Data (2025)
Ready to unlock more insights? AirROI provides access to advanced metrics and comprehensive Airbnb data for Melbourne. Explore detailed analytics beyond this report to refine your investment strategy, optimize pricing, and maximize your vacation rental profits.
Explore Advanced MetricsMelbourne Short-Term Rental Market Composition (2025): Property & Room Types
Room Type Distribution
Property Type Distribution
Market Composition Insights for Melbourne
- The Melbourne Airbnb market composition is heavily skewed towards Entire Home/Apt listings, which make up 85.3% of the 17,323 active rentals. This indicates strong guest preference for privacy and space.
- Looking at the property type distribution in Melbourne, Apartment/Condo properties are the most common (49.3%), reflecting the local real estate landscape.
- Houses represent a significant 43.1% portion, catering likely to families or larger groups.
- Smaller segments like hotel/boutique, others, outdoor/unique, unique stays (combined 7.6%) offer potential for unique stay experiences.
Melbourne Airbnb Room Capacity Analysis (2025): Bedroom Distribution
Distribution of Listings by Number of Bedrooms
Room Capacity Insights for Melbourne
- The dominant room capacity in Melbourne is 1 bedroom listings, making up 30.7% of the market. This suggests a strong demand for properties suitable for couples or solo travelers.
- Together, 1 bedroom and 2 bedrooms properties represent 59.1% of the active Airbnb listings in Melbourne, indicating a high concentration in these sizes.
- A significant 30.4% of listings offer 3+ bedrooms, catering to larger groups and families seeking more space in Melbourne.
Melbourne Vacation Rental Guest Capacity Trends (2025)
Distribution of Listings by Guest Capacity
Guest Capacity Insights for Melbourne
- The most common guest capacity trend in Melbourne vacation rentals is listings accommodating 2 guests (24.2%). This suggests the primary traveler segment is likely couples or solo travelers.
- Properties designed for 2 guests and 4 guests dominate the Melbourne STR market, accounting for 46.4% of listings.
- 33.4% of properties accommodate 6+ guests, serving the market segment for larger families or group travel in Melbourne.
- On average, properties in Melbourne are equipped to host 4.2 guests.
Melbourne Airbnb Booking Patterns (2025): Available vs. Booked Days
Available Days Distribution
Booked Days Distribution
Booking Pattern Insights for Melbourne
- The most common availability pattern in Melbourne falls within the 271-366 days range, representing 35.9% of listings. This suggests many properties have significant open periods on their calendars.
- Approximately 61.8% of listings show high availability (181+ days open annually), indicating potential for increased bookings or specific owner usage patterns.
- For booked days, the 91-180 days range is most frequent in Melbourne (25.9%), reflecting common guest stay durations or potential owner blocking patterns.
- A notable 39.4% of properties secure long booking periods (181+ days booked per year), highlighting successful long-term rental strategies or significant owner usage.
Melbourne Airbnb Minimum Stay Requirements Analysis
Distribution of Listings by Minimum Night Requirement
1 Night
3391 listings
21.4% of total
2 Nights
4347 listings
27.4% of total
3 Nights
1789 listings
11.3% of total
4-6 Nights
1364 listings
8.6% of total
7-29 Nights
850 listings
5.4% of total
30+ Nights
4109 listings
25.9% of total
Key Insights
- The most prevalent minimum stay requirement in Melbourne is 2 Nights, adopted by 27.4% of listings. This highlights the market's preference for shorter, flexible bookings.
- A significant segment (25.9%) caters to monthly stays (30+ nights) in Melbourne, pointing to opportunities in the extended-stay market.
Recommendations
- Align with the market by considering a 2 Nights minimum stay, as 27.4% of Melbourne hosts use this setting.
- If feasible, allowing 1-night stays, especially midweek or during low season, could capture last-minute bookings, as only 21.4% currently do.
- Explore offering discounts for stays of 30+ nights to attract the 25.9% of the market seeking extended stays.
- Adjust minimum nights based on seasonality – potentially shorter during low season and longer during peak demand periods in Melbourne.
Melbourne Airbnb Cancellation Policy Trends Analysis (2025)
Super Strict 60 Days
158 listings
1.1% of total
Super Strict 30 Days
255 listings
1.7% of total
Refundable
4 listings
0% of total
Non-refundable
1 listings
0% of total
Flexible
2360 listings
16.1% of total
Moderate
4636 listings
31.7% of total
Firm
3270 listings
22.3% of total
Strict
3947 listings
27% of total
Cancellation Policy Insights for Melbourne
- The prevailing Airbnb cancellation policy trend in Melbourne is Moderate, used by 31.7% of listings.
- There's a relatively balanced mix between guest-friendly (47.8%) and stricter (49.3%) policies, offering choices for different guest needs.
Recommendations for Hosts
- Consider adopting a Moderate policy to align with the 31.7% market standard in Melbourne.
- Regularly review your cancellation policy against competitors and market demand shifts in Melbourne.
Melbourne STR Booking Lead Time Analysis (2025)
Average Booking Lead Time by Month
Booking Lead Time Insights for Melbourne
- The overall average booking lead time for vacation rentals in Melbourne is 48 days.
- Guests book furthest in advance for stays during March (average 62 days), likely coinciding with peak travel demand or local events.
- The shortest booking windows occur for stays in August (average 32 days), indicating more last-minute travel plans during this time.
- Seasonally, Winter (55 days avg.) sees the longest lead times, while Summer (38 days avg.) has the shortest, reflecting typical travel planning cycles.
Recommendations for Hosts
- Use the overall average lead time (48 days) as a baseline for your pricing and availability strategy in Melbourne.
- For March stays, consider implementing length-of-stay discounts or slightly higher rates for bookings made less than 62 days out to capitalize on advance planning.
- Target marketing efforts for the Winter season well in advance (at least 55 days) to capture early planners.
- Monitor your own booking lead times against these Melbourne averages to identify opportunities for dynamic pricing adjustments.
Popular & Essential Airbnb Amenities in Melbourne (2025)
Amenity Prevalence
Amenity Insights for Melbourne
- Essential amenities in Melbourne that guests expect include: Smoke alarm, Wifi, TV, Kitchen. Lacking these (any) could significantly impact bookings.
- Popular amenities like Heating, Hot water, Air conditioning are common but not universal. Offering these can provide a competitive edge.
Recommendations for Hosts
- Ensure your listing includes all essential amenities for Melbourne: Smoke alarm, Wifi, TV, Kitchen.
- Prioritize adding missing essentials: Smoke alarm, Wifi, TV, Kitchen.
- Consider adding popular differentiators like Heating or Hot water to increase appeal.
- Highlight unique or less common amenities you offer (e.g., hot tub, dedicated workspace, EV charger) in your listing description and photos.
- Regularly check competitor amenities in Melbourne to stay competitive.
Melbourne Airbnb Guest Demographics & Profile Analysis (2025)
Guest Profile Summary for Melbourne
- The typical guest profile for Airbnb in Melbourne consists of primarily domestic travelers (75%), often arriving from nearby Melbourne, typically belonging to the Post-2000s (Gen Z/Alpha) group (50%), primarily speaking English or Chinese.
- Domestic travelers account for 74.6% of guests.
- Key international markets include Australia (74.6%) and United Kingdom (3.7%).
- Top languages spoken are English (64.2%) followed by Chinese (7.8%).
- A significant demographic segment is the Post-2000s (Gen Z/Alpha) group, representing 50% of guests.
Recommendations for Hosts
- Target domestic marketing efforts towards travelers from Melbourne and Sydney.
- Tailor amenities and listing descriptions to appeal to the dominant Post-2000s (Gen Z/Alpha) demographic (e.g., highlight fast WiFi, smart home features, local guides).
- Highlight unique local experiences or amenities relevant to the primary guest profile.
- Consider seasonal promotions aligned with peak travel times for key origin markets.
Nearby Short-Term Rental Market Comparison
How does the Melbourne Airbnb market stack up against its neighbors? Compare key performance metrics like average monthly revenue, ADR, and occupancy rates in surrounding areas to understand the broader regional STR landscape.
| Market | Active Properties | Monthly Revenue | Daily Rate | Avg. Occupancy |
|---|---|---|---|---|
| Lancefield | 18 | $4,069 | $343.64 | 49% |
| Leopold | 12 | $3,496 | $429.65 | 41% |
| Trentham | 52 | $3,455 | $269.84 | 41% |
| Lyonville | 10 | $3,441 | $349.65 | 35% |
| Nagambie | 33 | $3,381 | $300.42 | 40% |
| Shire of Strathbogie | 43 | $3,173 | $314.72 | 37% |
| Shire of Hepburn | 283 | $3,120 | $298.86 | 36% |
| Shire of Murrindindi | 70 | $3,061 | $268.84 | 40% |
| Daylesford | 462 | $3,028 | $297.26 | 35% |
| Moama | 53 | $2,999 | $310.37 | 35% |