Lorne Airbnb Market Analysis 2025: Short Term Rental Data & Vacation Rental Statistics in Victoria, Australia
Is Airbnb profitable in Lorne in 2025? Explore comprehensive Airbnb analytics for Lorne, Victoria, Australia to uncover income potential. This 2025 STR market report for Lorne, based on AirROI data from April 2024 to March 2025, reveals key trends in the market of 365 active listings.
Whether you're considering an Airbnb investment in Lorne, optimizing your existing vacation rental, or exploring rental arbitrage opportunities, understanding the Lorne Airbnb data is crucial. Leveraging the low regulation environment is key to maximizing your short term rental income potential. Let's dive into the specifics.
Key Lorne Airbnb Performance Metrics Overview
Monthly Airbnb Revenue Variations & Income Potential in Lorne (2025)
Understanding the monthly revenue variations for Airbnb listings in Lorne is key to maximizing your short term rental income potential. Seasonality significantly impacts earnings. Our analysis, based on data from the past 12 months, shows that the peak revenue month for STRs in Lorne is typically January, while September often presents the lowest earnings, highlighting opportunities for strategic pricing adjustments during shoulder and low seasons. Explore the typical Airbnb income in Lorne across different performance tiers:
- Best-in-class properties (Top 10%) achieve $8,282+ monthly, often utilizing dynamic pricing and superior guest experiences.
- Strong performing properties (Top 25%) earn $5,054 or more, indicating effective management and desirable locations/amenities.
- Typical properties (Median) generate around $2,954 per month, representing the average market performance.
- Entry-level properties (Bottom 25%) see earnings around $1,657, often with potential for optimization.
Average Monthly Airbnb Earnings Trend in Lorne
Lorne Airbnb Occupancy Rate Trends (2025)
Maximize your bookings by understanding the Lorne STR occupancy trends. Seasonal demand shifts significantly influence how often properties are booked. Typically, Januarysees the highest demand (peak season occupancy), while May experiences the lowest (low season). Effective strategies, like adjusting minimum stays or offering promotions, can boost occupancy during slower periods. Here's how different property tiers perform in Lorne:
- Best-in-class properties (Top 10%) achieve 71%+ occupancy, indicating high desirability and potentially optimized availability.
- Strong performing properties (Top 25%) maintain 51% or higher occupancy, suggesting good market fit and guest satisfaction.
- Typical properties (Median) have an occupancy rate around 29%.
- Entry-level properties (Bottom 25%) average 15% occupancy, potentially facing higher vacancy.
Average Monthly Occupancy Rate Trend in Lorne
Average Daily Rate (ADR) Airbnb Trends in Lorne (2025)
Effective short term rental pricing strategy in Lorne involves understanding monthly ADR fluctuations. The Average Daily Rate (ADR) for Airbnb in Lorne typically peaks in January and dips lowest during August. Leveraging Airbnb dynamic pricing tools or strategies based on this seasonality can significantly boost revenue. Here's a look at the typical nightly rates achieved:
- Best-in-class properties (Top 10%) command rates of $685+ per night, often due to premium features or locations.
- Strong performing properties (Top 25%) achieve nightly rates of $501 or more.
- Typical properties (Median) charge around $367 per night.
- Entry-level properties (Bottom 25%) earn around $242 per night.
Average Daily Rate (ADR) Trend by Month in Lorne
Get Live Lorne Market Intelligence 👇

Explore Real-time Analytics
Airbnb Seasonality Analysis & Trends in Lorne (2025)
Peak Season (January, December, November)
- Revenue averages $5,641 per month
- Occupancy rates average 45.3%
- Daily rates average $442
Shoulder Season
- Revenue averages $3,713 per month
- Occupancy maintains around 31.9%
- Daily rates hold near $401
Low Season (August, September, October)
- Revenue drops to average $3,011 per month
- Occupancy decreases to average 29.0%
- Daily rates adjust to average $393
Seasonality Insights for Lorne
- The Airbnb seasonality in Lorne shows highly seasonal trends requiring careful strategy. While the sections above show seasonal averages, it's also insightful to look at the extremes:
- During the high season, the absolute peak month showcases Lorne's highest earning potential, with monthly revenues capable of climbing to $7,104, occupancy reaching a high of 53.6%, and ADRs peaking at $476.
- Conversely, the slowest single month of the year, typically falling within the low season, marks the market's lowest point. In this month, revenue might dip to $2,780, occupancy could drop to 25.1%, and ADRs may adjust down to $391.
- Understanding both the seasonal averages and these monthly peaks and troughs in revenue, occupancy, and ADR is crucial for maximizing your Airbnb profit potential in Lorne.
Seasonal Strategies for Maximizing Profit
- Peak Season: Maximize revenue through premium pricing and potentially longer minimum stays. Ensure high availability.
- Low Season: Offer competitive pricing, special promotions (e.g., extended stay discounts), and flexible cancellation policies. Target off-season travelers like remote workers or budget-conscious guests.
- Shoulder Seasons: Implement dynamic pricing that balances peak and low rates. Target weekend travelers or specific events. Offer slightly more flexible terms than peak season.
- Regularly analyze your own performance against these Lorne seasonality benchmarks and adjust your pricing and availability strategy accordingly.
Best Areas for Airbnb Investment in Lorne (2025)
Exploring the top neighborhoods for short-term rentals in Lorne? This section highlights key areas, outlining why they are attractive for hosts and guests, along with notable local attractions. Consider these locations based on your target guest profile and investment strategy.
| Neighborhood / Area | Why Host Here? (Target Guests & Appeal) | Key Attractions & Landmarks |
|---|---|---|
| Lorne Main Beach | The central beach area of Lorne, perfect for tourists looking for beach access, cafes, and shopping. A lively atmosphere with plenty of activities for all ages. | Lorne Beach, Lorne Pier, Surf Life Saving Club, Restaurants and cafes, Lorne Skate Park |
| Great Ocean Road | A world-famous scenic coastal drive that attracts tourists year-round. Provides access to stunning views, beaches, and natural attractions, ideal for those seeking adventure. | Great Ocean Walk, Erskine Falls, Teddy's Lookout, Apollo Bay, Gibson Steps |
| Erskine Falls | A beautiful waterfall located just a short drive from Lorne, attracting nature lovers and hikers. Perfect for eco-tourism and outdoor experiences. | Erskine Falls, Walking trails, Picnic areas, Nature reserves |
| Lorne Forest | A tranquil area with lush forests and wildlife, offering a peaceful escape. Ideal for those seeking a quiet retreat amidst nature. | Great Otway National Park, Walking and cycling trails, Birdwatching spots |
| Lorne's Art and Culture Hub | Home to various galleries and cultural events, this area attracts those interested in art and local culture. A vibrant community that enhances the local experience. | Lorne Community House, Concerts and events, Art galleries |
| Point Addis | A secluded beach and nature reserve, perfect for those looking to escape the crowds and enjoy pristine coastal scenery. Excellent for nature enthusiasts. | Point Addis Marine National Park, Surf beaches, Walking paths |
| Lorne's Historic District | Rich in history with beautiful old architecture, this area attracts tourists interested in Lorne's heritage. It offers a unique perspective on the town's past. | Lorne Hotel, Lorne's historic buildings, Local markets |
| Lorne Roundabout | A central gathering point which acts as a hub for access to various parts of Lorne. Convenient for visitors wanting to explore the town and its surrounding attractions. | Visitor information centre, Local transportation access, Shops and cafes nearby |
Understanding Airbnb License Requirements & STR Laws in Lorne (2025)
While Lorne, Victoria, Australia currently shows low STR regulations, specific Airbnb license requirements might still exist or change. Always verify the latest short term rental regulations and Airbnb license requirements directly with local government authorities for Lorne to ensure full compliance before hosting.
(Source: AirROI data, 2025, finding no licensed listings among those analyzed)
Top Performing Airbnb Properties in Lorne (2025)
Benchmark your potential! Explore examples of top-performing Airbnb properties in Lornebased on Trailing Twelve Month (TTM) revenue. Analyze their characteristics, revenue, occupancy rate, and ADR to understand what drives success in this market.
Hilltop Hideaway House and Villas
Entire Place • 7 bedrooms

Otway Homestead Lorne
Entire Place • 7 bedrooms

Runnymede Farm
Entire Place • 5 bedrooms
Vista 180 - Dream Beach House
Entire Place • 5 bedrooms
Ocean House
Entire Place • 5 bedrooms
Coastal Views - Lorne Holiday Stays
Entire Place • 5 bedrooms
Note: Performance varies based on location, size, amenities, seasonality, and management quality. Data reflects the past 12 months.
Top Performing Airbnb Hosts in Lorne (2025)
Learn from the best! This table showcases top-performing Airbnb hosts in Lorne based on the number of properties managed and estimated total revenue over the past year. Analyze their scale and performance metrics.
| Host Name | Properties | Grossing Revenue | Stay Reviews | Avg Rating |
|---|---|---|---|---|
| Great Ocean Road Holidays | 133 | $3,436,261 | 1388 | 3.07/5.0 |
| Lorne Holiday | 24 | $1,407,058 | 1653 | 4.83/5.0 |
| Richie | 4 | $475,853 | 111 | 4.99/5.0 |
| Smyth Real Estate | 23 | $434,995 | 386 | 3.75/5.0 |
| Jasmin | 1 | $261,185 | 23 | 5.00/5.0 |
| Jack | 2 | $242,678 | 37 | 4.82/5.0 |
| Eve | 2 | $205,344 | 103 | 4.79/5.0 |
| Charles | 6 | $197,299 | 491 | 4.80/5.0 |
| Simon And Mella | 1 | $172,523 | 120 | 4.93/5.0 |
| Lorne Surf | 6 | $160,440 | 303 | 4.83/5.0 |
Analyzing the strategies of top hosts, such as their property selection, pricing, and guest communication, can offer valuable lessons for optimizing your own Airbnb operations in Lorne.
Dive Deeper: Advanced Lorne STR Market Data (2025)
Ready to unlock more insights? AirROI provides access to advanced metrics and comprehensive Airbnb data for Lorne. Explore detailed analytics beyond this report to refine your investment strategy, optimize pricing, and maximize your vacation rental profits.
Explore Advanced MetricsLorne Short-Term Rental Market Composition (2025): Property & Room Types
Room Type Distribution
Property Type Distribution
Market Composition Insights for Lorne
- The Lorne Airbnb market composition is heavily skewed towards Entire Home/Apt listings, which make up 95.9% of the 365 active rentals. This indicates strong guest preference for privacy and space.
- Looking at the property type distribution in Lorne, House properties are the most common (61.4%), reflecting the local real estate landscape.
- Houses represent a significant 61.4% portion, catering likely to families or larger groups.
- The presence of 5.2% Hotel/Boutique listings indicates integration with traditional hospitality.
- Smaller segments like others, outdoor/unique, unique stays (combined 5.5%) offer potential for unique stay experiences.
Lorne Airbnb Room Capacity Analysis (2025): Bedroom Distribution
Distribution of Listings by Number of Bedrooms
Room Capacity Insights for Lorne
- The dominant room capacity in Lorne is 3 bedrooms listings, making up 35.3% of the market. This suggests a strong demand for properties suitable for families or small groups.
- Together, 3 bedrooms and 2 bedrooms properties represent 58.0% of the active Airbnb listings in Lorne, indicating a high concentration in these sizes.
- A significant 60.5% of listings offer 3+ bedrooms, catering to larger groups and families seeking more space in Lorne.
Lorne Vacation Rental Guest Capacity Trends (2025)
Distribution of Listings by Guest Capacity
Guest Capacity Insights for Lorne
- The most common guest capacity trend in Lorne vacation rentals is listings accommodating 8+ guests (37.3%). This suggests the primary traveler segment is likely larger groups.
- Properties designed for 8+ guests and 6 guests dominate the Lorne STR market, accounting for 57.6% of listings.
- 63.4% of properties accommodate 6+ guests, serving the market segment for larger families or group travel in Lorne.
- On average, properties in Lorne are equipped to host 5.9 guests.
Lorne Airbnb Booking Patterns (2025): Available vs. Booked Days
Available Days Distribution
Booked Days Distribution
Booking Pattern Insights for Lorne
- The most common availability pattern in Lorne falls within the 271-366 days range, representing 61.4% of listings. This suggests many properties have significant open periods on their calendars.
- Approximately 81.1% of listings show high availability (181+ days open annually), indicating potential for increased bookings or specific owner usage patterns.
- For booked days, the 31-90 days range is most frequent in Lorne (38.1%), reflecting common guest stay durations or potential owner blocking patterns.
- A notable 20.3% of properties secure long booking periods (181+ days booked per year), highlighting successful long-term rental strategies or significant owner usage.
Lorne Airbnb Minimum Stay Requirements Analysis
Distribution of Listings by Minimum Night Requirement
1 Night
18 listings
5.2% of total
2 Nights
65 listings
18.7% of total
3 Nights
25 listings
7.2% of total
4-6 Nights
58 listings
16.7% of total
7-29 Nights
5 listings
1.4% of total
30+ Nights
177 listings
50.9% of total
Key Insights
- The most prevalent minimum stay requirement in Lorne is 30+ Nights, adopted by 50.9% of listings. This highlights the market's preference for longer commitments.
- A significant segment (50.9%) caters to monthly stays (30+ nights) in Lorne, pointing to opportunities in the extended-stay market.
Recommendations
- Align with the market by considering a 30+ Nights minimum stay, as 50.9% of Lorne hosts use this setting.
- If feasible, allowing 1-night stays, especially midweek or during low season, could capture last-minute bookings, as only 5.2% currently do.
- Explore offering discounts for stays of 30+ nights to attract the 50.9% of the market seeking extended stays.
- Adjust minimum nights based on seasonality – potentially shorter during low season and longer during peak demand periods in Lorne.
Lorne Airbnb Cancellation Policy Trends Analysis (2025)
Super Strict 30 Days
97 listings
31.2% of total
Super Strict 60 Days
23 listings
7.4% of total
Flexible
21 listings
6.8% of total
Moderate
44 listings
14.1% of total
Firm
41 listings
13.2% of total
Strict
85 listings
27.3% of total
Cancellation Policy Insights for Lorne
- The prevailing Airbnb cancellation policy trend in Lorne is Super Strict 30 Days, used by 31.2% of listings.
- There's a relatively balanced mix between guest-friendly (20.9%) and stricter (40.5%) policies, offering choices for different guest needs.
Recommendations for Hosts
- Consider adopting a Super Strict 30 Days policy to align with the 31.2% market standard in Lorne.
- Regularly review your cancellation policy against competitors and market demand shifts in Lorne.
Lorne STR Booking Lead Time Analysis (2025)
Average Booking Lead Time by Month
Booking Lead Time Insights for Lorne
- The overall average booking lead time for vacation rentals in Lorne is 71 days.
- Guests book furthest in advance for stays during January (average 115 days), likely coinciding with peak travel demand or local events.
- The shortest booking windows occur for stays in July (average 32 days), indicating more last-minute travel plans during this time.
- Seasonally, Winter (93 days avg.) sees the longest lead times, while Summer (39 days avg.) has the shortest, reflecting typical travel planning cycles.
Recommendations for Hosts
- Use the overall average lead time (71 days) as a baseline for your pricing and availability strategy in Lorne.
- For January stays, consider implementing length-of-stay discounts or slightly higher rates for bookings made less than 115 days out to capitalize on advance planning.
- Target marketing efforts for the Winter season well in advance (at least 93 days) to capture early planners.
- Monitor your own booking lead times against these Lorne averages to identify opportunities for dynamic pricing adjustments.
Popular & Essential Airbnb Amenities in Lorne (2025)
Amenity Prevalence
Amenity Insights for Lorne
- Essential amenities in Lorne that guests expect include: TV, Smoke alarm, Heating, Kitchen. Lacking these (any) could significantly impact bookings.
- Popular amenities like Hot water, Air conditioning, Washer are common but not universal. Offering these can provide a competitive edge.
Recommendations for Hosts
- Ensure your listing includes all essential amenities for Lorne: TV, Smoke alarm, Heating, Kitchen.
- Prioritize adding missing essentials: TV, Smoke alarm, Heating, Kitchen.
- Consider adding popular differentiators like Hot water or Air conditioning to increase appeal.
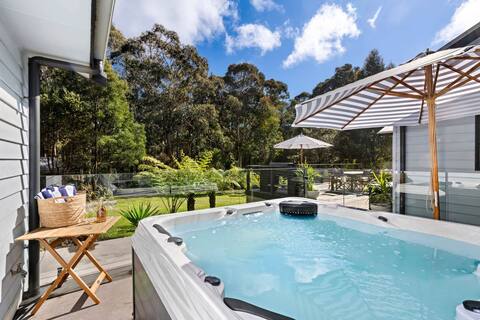
- Highlight unique or less common amenities you offer (e.g., hot tub, dedicated workspace, EV charger) in your listing description and photos.
- Regularly check competitor amenities in Lorne to stay competitive.
Lorne Airbnb Guest Demographics & Profile Analysis (2025)
Guest Profile Summary for Lorne
- The typical guest profile for Airbnb in Lorne consists of primarily domestic travelers (86%), often arriving from nearby Melbourne, typically belonging to the Post-2000s (Gen Z/Alpha) group (50%), primarily speaking English or Spanish.
- Domestic travelers account for 85.8% of guests.
- Key international markets include Australia (85.8%) and United Kingdom (3.6%).
- Top languages spoken are English (69.5%) followed by Spanish (4.3%).
- A significant demographic segment is the Post-2000s (Gen Z/Alpha) group, representing 50% of guests.
Recommendations for Hosts
- Target domestic marketing efforts towards travelers from Melbourne and Victoria.
- Tailor amenities and listing descriptions to appeal to the dominant Post-2000s (Gen Z/Alpha) demographic (e.g., highlight fast WiFi, smart home features, local guides).
- Highlight unique local experiences or amenities relevant to the primary guest profile.
- Consider seasonal promotions aligned with peak travel times for key origin markets.
Nearby Short-Term Rental Market Comparison
How does the Lorne Airbnb market stack up against its neighbors? Compare key performance metrics like average monthly revenue, ADR, and occupancy rates in surrounding areas to understand the broader regional STR landscape.
| Market | Active Properties | Monthly Revenue | Daily Rate | Avg. Occupancy |
|---|---|---|---|---|
| King Island Council | 11 | $5,231 | $550.50 | 37% |
| Lancefield | 18 | $4,069 | $343.64 | 49% |
| Leopold | 12 | $3,496 | $429.65 | 41% |
| Trentham | 52 | $3,455 | $269.84 | 41% |
| Lyonville | 10 | $3,441 | $349.65 | 35% |
| Shire of Hepburn | 283 | $3,120 | $298.86 | 36% |
| Daylesford | 462 | $3,028 | $297.26 | 35% |
| Malmsbury | 11 | $2,957 | $232.06 | 38% |
| Shire of Colac Otway | 372 | $2,948 | $292.68 | 38% |
| Buninyong | 12 | $2,872 | $169.56 | 48% |