Horsham Airbnb Market Analysis 2025: Short Term Rental Data & Vacation Rental Statistics in Victoria, Australia
Is Airbnb profitable in Horsham in 2025? Explore comprehensive Airbnb analytics for Horsham, Victoria, Australia to uncover income potential. This 2025 STR market report for Horsham, based on AirROI data from April 2024 to March 2025, reveals key trends in the niche market of 41 active listings.
Whether you're considering an Airbnb investment in Horsham, optimizing your existing vacation rental, or exploring rental arbitrage opportunities, understanding the Horsham Airbnb data is crucial. Leveraging the low regulation environment is key to maximizing your short term rental income potential. Let's dive into the specifics.
Key Horsham Airbnb Performance Metrics Overview
Monthly Airbnb Revenue Variations & Income Potential in Horsham (2025)
Understanding the monthly revenue variations for Airbnb listings in Horsham is key to maximizing your short term rental income potential. Seasonality significantly impacts earnings. Our analysis, based on data from the past 12 months, shows that the peak revenue month for STRs in Horsham is typically April, while February often presents the lowest earnings, highlighting opportunities for strategic pricing adjustments during shoulder and low seasons. Explore the typical Airbnb income in Horsham across different performance tiers:
- Best-in-class properties (Top 10%) achieve $4,080+ monthly, often utilizing dynamic pricing and superior guest experiences.
- Strong performing properties (Top 25%) earn $3,191 or more, indicating effective management and desirable locations/amenities.
- Typical properties (Median) generate around $2,342 per month, representing the average market performance.
- Entry-level properties (Bottom 25%) see earnings around $1,416, often with potential for optimization.
Average Monthly Airbnb Earnings Trend in Horsham
Horsham Airbnb Occupancy Rate Trends (2025)
Maximize your bookings by understanding the Horsham STR occupancy trends. Seasonal demand shifts significantly influence how often properties are booked. Typically, Marchsees the highest demand (peak season occupancy), while February experiences the lowest (low season). Effective strategies, like adjusting minimum stays or offering promotions, can boost occupancy during slower periods. Here's how different property tiers perform in Horsham:
- Best-in-class properties (Top 10%) achieve 87%+ occupancy, indicating high desirability and potentially optimized availability.
- Strong performing properties (Top 25%) maintain 78% or higher occupancy, suggesting good market fit and guest satisfaction.
- Typical properties (Median) have an occupancy rate around 61%.
- Entry-level properties (Bottom 25%) average 40% occupancy, potentially facing higher vacancy.
Average Monthly Occupancy Rate Trend in Horsham
Average Daily Rate (ADR) Airbnb Trends in Horsham (2025)
Effective short term rental pricing strategy in Horsham involves understanding monthly ADR fluctuations. The Average Daily Rate (ADR) for Airbnb in Horsham typically peaks in December and dips lowest during September. Leveraging Airbnb dynamic pricing tools or strategies based on this seasonality can significantly boost revenue. Here's a look at the typical nightly rates achieved:
- Best-in-class properties (Top 10%) command rates of $191+ per night, often due to premium features or locations.
- Strong performing properties (Top 25%) achieve nightly rates of $142 or more.
- Typical properties (Median) charge around $118 per night.
- Entry-level properties (Bottom 25%) earn around $101 per night.
Average Daily Rate (ADR) Trend by Month in Horsham
Get Live Horsham Market Intelligence 👇
Explore Real-time Analytics
Airbnb Seasonality Analysis & Trends in Horsham (2025)
Peak Season (April, May, June)
- Revenue averages $2,852 per month
- Occupancy rates average 57.0%
- Daily rates average $122
Shoulder Season
- Revenue averages $2,433 per month
- Occupancy maintains around 59.2%
- Daily rates hold near $129
Low Season (February, July, September)
- Revenue drops to average $2,053 per month
- Occupancy decreases to average 56.0%
- Daily rates adjust to average $124
Seasonality Insights for Horsham
- The Airbnb seasonality in Horsham shows moderate seasonality with distinct peak and low periods. While the sections above show seasonal averages, it's also insightful to look at the extremes:
- During the high season, the absolute peak month showcases Horsham's highest earning potential, with monthly revenues capable of climbing to $2,941, occupancy reaching a high of 64.9%, and ADRs peaking at $137.
- Conversely, the slowest single month of the year, typically falling within the low season, marks the market's lowest point. In this month, revenue might dip to $1,935, occupancy could drop to 52.6%, and ADRs may adjust down to $121.
- Understanding both the seasonal averages and these monthly peaks and troughs in revenue, occupancy, and ADR is crucial for maximizing your Airbnb profit potential in Horsham.
Seasonal Strategies for Maximizing Profit
- Peak Season: Maximize revenue through premium pricing and potentially longer minimum stays. Ensure high availability.
- Low Season: Offer competitive pricing, special promotions (e.g., extended stay discounts), and flexible cancellation policies. Target off-season travelers like remote workers or budget-conscious guests.
- Shoulder Seasons: Implement dynamic pricing that balances peak and low rates. Target weekend travelers or specific events. Offer slightly more flexible terms than peak season.
- Regularly analyze your own performance against these Horsham seasonality benchmarks and adjust your pricing and availability strategy accordingly.
Best Areas for Airbnb Investment in Horsham (2025)
Exploring the top neighborhoods for short-term rentals in Horsham? This section highlights key areas, outlining why they are attractive for hosts and guests, along with notable local attractions. Consider these locations based on your target guest profile and investment strategy.
| Neighborhood / Area | Why Host Here? (Target Guests & Appeal) | Key Attractions & Landmarks |
|---|---|---|
| Horsham Central Business District | The heart of Horsham with access to shops, restaurants, and services. Ideal for guests wanting convenience and proximity to urban amenities. | Horsham Botanical Gardens, Horsham Arts Centre, Wimmera River, Horsham Plaza, Horsham Golf Club |
| Riverside Vic | A tranquil area along the Wimmera River known for its scenic views and outdoor activities. Perfect for nature lovers and families. | Wimmera River Walking Trail, Riverside Park, Fishing spots, Picnic areas, Horsham Sports and Community Club |
| Dimboola | A charming town nearby Horsham known for its historic sites and relaxed country lifestyle. Great for tourists seeking a peaceful getaway. | Dimboola Landing, Wimmera River, Dimboola Railway Station, Local cafes, Nature reserves |
| Natimuk | A quirky town famous for the Grampians and outdoor rock climbing, attracting adventure seekers and nature enthusiasts. | Mt Arapiles, Natimuk Art Gallery, Local markets, Rock climbing spots, Hiking trails |
| Warrayure | A rural area with stunning landscapes, ideal for those looking to escape the urban setting. Perfect for retreats and quiet stays. | Rural vistas, Local farms, Nature walks, Bird watching |
| Telopea Downs | A residential suburb close to Horsham known for its spacious properties and family-friendly environment. Suitable for longer stays. | Parks, Schools, Community events, Local dining |
| Murtoa | Home to the iconic Murtoa Stick Shed and rich in heritage, it attracts history buffs and those interested in agriculture. | Murtoa Stick Shed, Local history museums, Agricultural shows, Community festivals |
| Longerenong | Known for its agricultural college and rural landscape, it appeals to guests interested in farming, education, and the countryside. | Longerenong Agricultural College, Local farms, Nature reserves |
Understanding Airbnb License Requirements & STR Laws in Horsham (2025)
While Horsham, Victoria, Australia currently shows low STR regulations, specific Airbnb license requirements might still exist or change. Always verify the latest short term rental regulations and Airbnb license requirements directly with local government authorities for Horsham to ensure full compliance before hosting.
(Source: AirROI data, 2025, finding no licensed listings among those analyzed)
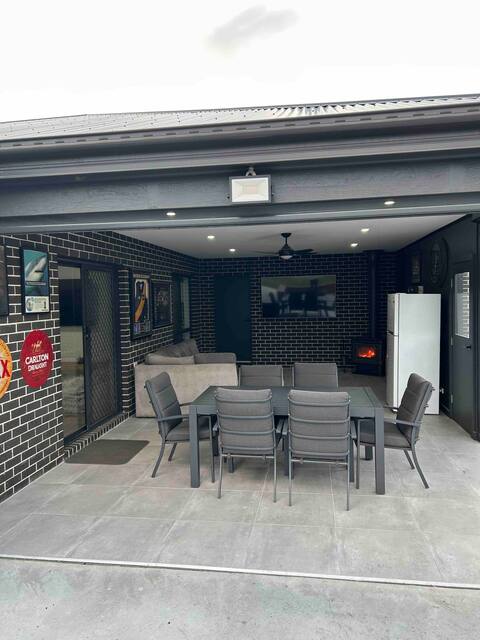
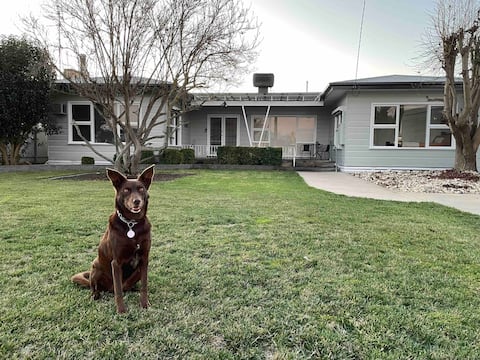
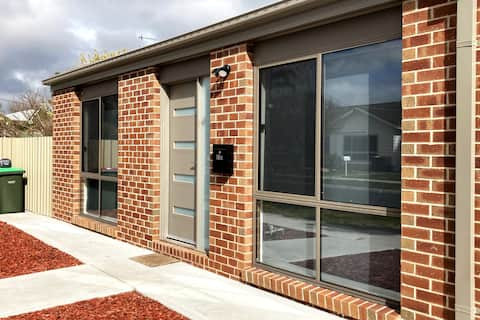
Top Performing Airbnb Properties in Horsham (2025)
Benchmark your potential! Explore examples of top-performing Airbnb properties in Horshambased on Trailing Twelve Month (TTM) revenue. Analyze their characteristics, revenue, occupancy rate, and ADR to understand what drives success in this market.

Glenare on Read
Entire Place • 2 bedrooms
Horsham
Entire Place • 3 bedrooms

Stylish Home in Horsham
Entire Place • 3 bedrooms
Beds on Fed
Entire Place • 3 bedrooms

Tropical Oasis with heated pool!
Entire Place • 3 bedrooms
Riverbank
Entire Place • 3 bedrooms
Note: Performance varies based on location, size, amenities, seasonality, and management quality. Data reflects the past 12 months.
Top Performing Airbnb Hosts in Horsham (2025)
Learn from the best! This table showcases top-performing Airbnb hosts in Horsham based on the number of properties managed and estimated total revenue over the past year. Analyze their scale and performance metrics.
| Host Name | Properties | Grossing Revenue | Stay Reviews | Avg Rating |
|---|---|---|---|---|
| Brendan And Peta | 2 | $77,700 | 611 | 4.87/5.0 |
| Sharon | 2 | $72,934 | 234 | 4.91/5.0 |
| Jessica | 1 | $69,826 | 73 | 4.86/5.0 |
| Meg | 2 | $60,970 | 222 | 4.62/5.0 |
| Darcy | 1 | $58,775 | 157 | 4.96/5.0 |
| Charlene | 2 | $55,251 | 161 | 4.88/5.0 |
| Chris | 3 | $53,742 | 377 | 4.62/5.0 |
| Kylie | 3 | $45,778 | 56 | 4.94/5.0 |
| Rebecca | 1 | $43,650 | 82 | 4.99/5.0 |
| Meredith | 2 | $41,680 | 152 | 4.77/5.0 |
Analyzing the strategies of top hosts, such as their property selection, pricing, and guest communication, can offer valuable lessons for optimizing your own Airbnb operations in Horsham.
Dive Deeper: Advanced Horsham STR Market Data (2025)
Ready to unlock more insights? AirROI provides access to advanced metrics and comprehensive Airbnb data for Horsham. Explore detailed analytics beyond this report to refine your investment strategy, optimize pricing, and maximize your vacation rental profits.
Explore Advanced MetricsHorsham Short-Term Rental Market Composition (2025): Property & Room Types
Room Type Distribution
Property Type Distribution
Market Composition Insights for Horsham
- The Horsham Airbnb market composition is heavily skewed towards Entire Home/Apt listings, which make up 95.1% of the 41 active rentals. This indicates strong guest preference for privacy and space.
- Looking at the property type distribution in Horsham, House properties are the most common (78%), reflecting the local real estate landscape.
- Houses represent a significant 78% portion, catering likely to families or larger groups.
- The presence of 7.3% Hotel/Boutique listings indicates integration with traditional hospitality.
- Smaller segments like apartment/condo (combined 4.9%) offer potential for unique stay experiences.
Horsham Airbnb Room Capacity Analysis (2025): Bedroom Distribution
Distribution of Listings by Number of Bedrooms
Room Capacity Insights for Horsham
- The dominant room capacity in Horsham is 3 bedrooms listings, making up 48.8% of the market. This suggests a strong demand for properties suitable for families or small groups.
- Together, 3 bedrooms and 2 bedrooms properties represent 65.9% of the active Airbnb listings in Horsham, indicating a high concentration in these sizes.
- A significant 63.5% of listings offer 3+ bedrooms, catering to larger groups and families seeking more space in Horsham.
Horsham Vacation Rental Guest Capacity Trends (2025)
Distribution of Listings by Guest Capacity
Guest Capacity Insights for Horsham
- The most common guest capacity trend in Horsham vacation rentals is listings accommodating 6 guests (41.5%). This suggests the primary traveler segment is likely larger groups.
- Properties designed for 6 guests and 4 guests dominate the Horsham STR market, accounting for 58.6% of listings.
- 65.9% of properties accommodate 6+ guests, serving the market segment for larger families or group travel in Horsham.
- On average, properties in Horsham are equipped to host 5.3 guests.
Horsham Airbnb Booking Patterns (2025): Available vs. Booked Days
Available Days Distribution
Booked Days Distribution
Booking Pattern Insights for Horsham
- The most common availability pattern in Horsham falls within the 91-180 days range, representing 53.7% of listings. This suggests many properties have significant open periods on their calendars.
- Approximately 29.2% of listings show high availability (181+ days open annually), indicating potential for increased bookings or specific owner usage patterns.
- For booked days, the 181-270 days range is most frequent in Horsham (53.7%), reflecting common guest stay durations or potential owner blocking patterns.
- A notable 73.2% of properties secure long booking periods (181+ days booked per year), highlighting successful long-term rental strategies or significant owner usage.
Horsham Airbnb Minimum Stay Requirements Analysis
Distribution of Listings by Minimum Night Requirement
1 Night
19 listings
48.7% of total
2 Nights
13 listings
33.3% of total
3 Nights
1 listings
2.6% of total
4-6 Nights
3 listings
7.7% of total
30+ Nights
3 listings
7.7% of total
Key Insights
- The most prevalent minimum stay requirement in Horsham is 1 Night, adopted by 48.7% of listings. This highlights the market's preference for shorter, flexible bookings.
- A strong majority (82.0%) of the Horsham Airbnb data shows acceptance of very short stays (1-2 nights), indicating a dynamic, high-turnover market.
Recommendations
- Align with the market by considering a 1 Night minimum stay, as 48.7% of Horsham hosts use this setting.
- Explore offering discounts for stays of 30+ nights to attract the 7.7% of the market seeking extended stays.
- Adjust minimum nights based on seasonality – potentially shorter during low season and longer during peak demand periods in Horsham.
Horsham Airbnb Cancellation Policy Trends Analysis (2025)
Flexible
11 listings
28.2% of total
Moderate
13 listings
33.3% of total
Firm
6 listings
15.4% of total
Strict
9 listings
23.1% of total
Cancellation Policy Insights for Horsham
- The prevailing Airbnb cancellation policy trend in Horsham is Moderate, used by 33.3% of listings.
- There's a relatively balanced mix between guest-friendly (61.5%) and stricter (38.5%) policies, offering choices for different guest needs.
Recommendations for Hosts
- Consider adopting a Moderate policy to align with the 33.3% market standard in Horsham.
- Regularly review your cancellation policy against competitors and market demand shifts in Horsham.
Horsham STR Booking Lead Time Analysis (2025)
Average Booking Lead Time by Month
Booking Lead Time Insights for Horsham
- The overall average booking lead time for vacation rentals in Horsham is 38 days.
- Guests book furthest in advance for stays during January (average 49 days), likely coinciding with peak travel demand or local events.
- The shortest booking windows occur for stays in September (average 26 days), indicating more last-minute travel plans during this time.
- Seasonally, Winter (44 days avg.) sees the longest lead times, while Summer (35 days avg.) has the shortest, reflecting typical travel planning cycles.
Recommendations for Hosts
- Use the overall average lead time (38 days) as a baseline for your pricing and availability strategy in Horsham.
- For January stays, consider implementing length-of-stay discounts or slightly higher rates for bookings made less than 49 days out to capitalize on advance planning.
- Target marketing efforts for the Winter season well in advance (at least 44 days) to capture early planners.
- Monitor your own booking lead times against these Horsham averages to identify opportunities for dynamic pricing adjustments.
Popular & Essential Airbnb Amenities in Horsham (2025)
Amenity Prevalence
Amenity Insights for Horsham
- Essential amenities in Horsham that guests expect include: TV, Air conditioning, Kitchen, Heating, Smoke alarm, Free parking on premises, Dishes and silverware. Lacking these (any) could significantly impact bookings.
- Popular amenities like Essentials, Wifi, Hot water are common but not universal. Offering these can provide a competitive edge.
- Warning: Wifi is not universally provided but is considered essential globally. Ensure reliable Wifi is offered.
Recommendations for Hosts
- Ensure your listing includes all essential amenities for Horsham: TV, Air conditioning, Kitchen, Heating, Smoke alarm, Free parking on premises, Dishes and silverware.
- Prioritize adding missing essentials: Kitchen, Heating, Smoke alarm, Free parking on premises, Dishes and silverware.
- Consider adding popular differentiators like Essentials or Wifi to increase appeal.
- Highlight unique or less common amenities you offer (e.g., hot tub, dedicated workspace, EV charger) in your listing description and photos.
- Regularly check competitor amenities in Horsham to stay competitive.
Horsham Airbnb Guest Demographics & Profile Analysis (2025)
Guest Profile Summary for Horsham
- The typical guest profile for Airbnb in Horsham consists of primarily domestic travelers (95%), often arriving from nearby Melbourne, typically belonging to the Post-2000s (Gen Z/Alpha) group (50%), primarily speaking English or Chinese.
- Domestic travelers account for 94.7% of guests.
- Key international markets include Australia (94.7%) and United Kingdom (1.1%).
- Top languages spoken are English (73.8%) followed by Chinese (6.3%).
- A significant demographic segment is the Post-2000s (Gen Z/Alpha) group, representing 50% of guests.
Recommendations for Hosts
- Target domestic marketing efforts towards travelers from Melbourne and Adelaide.
- Tailor amenities and listing descriptions to appeal to the dominant Post-2000s (Gen Z/Alpha) demographic (e.g., highlight fast WiFi, smart home features, local guides).
- Highlight unique local experiences or amenities relevant to the primary guest profile.
- Consider seasonal promotions aligned with peak travel times for key origin markets.
Nearby Short-Term Rental Market Comparison
How does the Horsham Airbnb market stack up against its neighbors? Compare key performance metrics like average monthly revenue, ADR, and occupancy rates in surrounding areas to understand the broader regional STR landscape.
| Market | Active Properties | Monthly Revenue | Daily Rate | Avg. Occupancy |
|---|---|---|---|---|
| Buninyong | 12 | $2,872 | $169.56 | 48% |
| Halls Gap | 184 | $2,669 | $191.17 | 45% |
| Swan Hill | 20 | $2,162 | $165.64 | 49% |
| Creswick | 27 | $2,156 | $164.44 | 43% |
| Pomonal | 13 | $2,153 | $173.41 | 42% |
| Dunkeld | 37 | $2,152 | $197.44 | 40% |
| Rural City of Ararat | 15 | $2,122 | $167.92 | 39% |
| Ballarat | 429 | $1,743 | $143.48 | 44% |
| Clunes | 16 | $1,738 | $190.21 | 33% |
| Bridgewater on Loddon | 10 | $1,669 | $196.15 | 27% |