Geelong Airbnb Market Analysis 2025: Short Term Rental Data & Vacation Rental Statistics in Victoria, Australia
Is Airbnb profitable in Geelong in 2025? Explore comprehensive Airbnb analytics for Geelong, Victoria, Australia to uncover income potential. This 2025 STR market report for Geelong, based on AirROI data from April 2024 to March 2025, reveals key trends in the market of 508 active listings.
Whether you're considering an Airbnb investment in Geelong, optimizing your existing vacation rental, or exploring rental arbitrage opportunities, understanding the Geelong Airbnb data is crucial. Leveraging the low regulation environment is key to maximizing your short term rental income potential. Let's dive into the specifics.
Key Geelong Airbnb Performance Metrics Overview
Monthly Airbnb Revenue Variations & Income Potential in Geelong (2025)
Understanding the monthly revenue variations for Airbnb listings in Geelong is key to maximizing your short term rental income potential. Seasonality significantly impacts earnings. Our analysis, based on data from the past 12 months, shows that the peak revenue month for STRs in Geelong is typically January, while September often presents the lowest earnings, highlighting opportunities for strategic pricing adjustments during shoulder and low seasons. Explore the typical Airbnb income in Geelong across different performance tiers:
- Best-in-class properties (Top 10%) achieve $4,667+ monthly, often utilizing dynamic pricing and superior guest experiences.
- Strong performing properties (Top 25%) earn $3,302 or more, indicating effective management and desirable locations/amenities.
- Typical properties (Median) generate around $1,981 per month, representing the average market performance.
- Entry-level properties (Bottom 25%) see earnings around $954, often with potential for optimization.
Average Monthly Airbnb Earnings Trend in Geelong
Geelong Airbnb Occupancy Rate Trends (2025)
Maximize your bookings by understanding the Geelong STR occupancy trends. Seasonal demand shifts significantly influence how often properties are booked. Typically, Januarysees the highest demand (peak season occupancy), while May experiences the lowest (low season). Effective strategies, like adjusting minimum stays or offering promotions, can boost occupancy during slower periods. Here's how different property tiers perform in Geelong:
- Best-in-class properties (Top 10%) achieve 82%+ occupancy, indicating high desirability and potentially optimized availability.
- Strong performing properties (Top 25%) maintain 67% or higher occupancy, suggesting good market fit and guest satisfaction.
- Typical properties (Median) have an occupancy rate around 44%.
- Entry-level properties (Bottom 25%) average 24% occupancy, potentially facing higher vacancy.
Average Monthly Occupancy Rate Trend in Geelong
Average Daily Rate (ADR) Airbnb Trends in Geelong (2025)
Effective short term rental pricing strategy in Geelong involves understanding monthly ADR fluctuations. The Average Daily Rate (ADR) for Airbnb in Geelong typically peaks in January and dips lowest during February. Leveraging Airbnb dynamic pricing tools or strategies based on this seasonality can significantly boost revenue. Here's a look at the typical nightly rates achieved:
- Best-in-class properties (Top 10%) command rates of $266+ per night, often due to premium features or locations.
- Strong performing properties (Top 25%) achieve nightly rates of $199 or more.
- Typical properties (Median) charge around $138 per night.
- Entry-level properties (Bottom 25%) earn around $91 per night.
Average Daily Rate (ADR) Trend by Month in Geelong
Get Live Geelong Market Intelligence 👇

Explore Real-time Analytics
Airbnb Seasonality Analysis & Trends in Geelong (2025)
Peak Season (January, December, April)
- Revenue averages $3,085 per month
- Occupancy rates average 51.3%
- Daily rates average $170
Shoulder Season
- Revenue averages $2,303 per month
- Occupancy maintains around 44.6%
- Daily rates hold near $159
Low Season (August, September, October)
- Revenue drops to average $1,831 per month
- Occupancy decreases to average 42.3%
- Daily rates adjust to average $158
Seasonality Insights for Geelong
- The Airbnb seasonality in Geelong shows moderate seasonality with distinct peak and low periods. While the sections above show seasonal averages, it's also insightful to look at the extremes:
- During the high season, the absolute peak month showcases Geelong's highest earning potential, with monthly revenues capable of climbing to $3,349, occupancy reaching a high of 57.1%, and ADRs peaking at $176.
- Conversely, the slowest single month of the year, typically falling within the low season, marks the market's lowest point. In this month, revenue might dip to $1,768, occupancy could drop to 38.0%, and ADRs may adjust down to $157.
- Understanding both the seasonal averages and these monthly peaks and troughs in revenue, occupancy, and ADR is crucial for maximizing your Airbnb profit potential in Geelong.
Seasonal Strategies for Maximizing Profit
- Peak Season: Maximize revenue through premium pricing and potentially longer minimum stays. Ensure high availability.
- Low Season: Offer competitive pricing, special promotions (e.g., extended stay discounts), and flexible cancellation policies. Target off-season travelers like remote workers or budget-conscious guests.
- Shoulder Seasons: Implement dynamic pricing that balances peak and low rates. Target weekend travelers or specific events. Offer slightly more flexible terms than peak season.
- Regularly analyze your own performance against these Geelong seasonality benchmarks and adjust your pricing and availability strategy accordingly.
Best Areas for Airbnb Investment in Geelong (2025)
Exploring the top neighborhoods for short-term rentals in Geelong? This section highlights key areas, outlining why they are attractive for hosts and guests, along with notable local attractions. Consider these locations based on your target guest profile and investment strategy.
| Neighborhood / Area | Why Host Here? (Target Guests & Appeal) | Key Attractions & Landmarks |
|---|---|---|
| Geelong Waterfront | A vibrant waterfront area with stunning views, parks, and attractions. Ideal for tourists looking for leisure and outdoor activities close to the city center. | Geelong Botanic Gardens, Eastern Beach, Geelong Art Gallery, Old Geelong Gaol, Geelong's Carousel |
| Geelong CBD | The central business district hosts a variety of cafes, shops, and cultural attractions, making it a prime spot for business travelers and urban explorers. | Westfield Geelong, Geelong Performing Arts Centre, Little Malop Street, Geelong Market, Geelong's Wool Museum |
| Pakington Street | Known for its boutique shops, cafes, and lifestyle offerings, Pakington Street attracts both locals and visitors looking for a hip urban experience. | Pakington Street shopping precinct, cafes and restaurants, local art galleries, Barwon River walking trails |
| Queens Park | A scenic residential area with parks and family-friendly amenities. Appeals to those looking for longer-term stays or family trips. | Queens Park, Geelong Golf Club, local playgrounds, Barwon River access |
| Highton | Offers a mix of suburban comfort and proximity to the city, ideal for families and those who prefer a quieter atmosphere while still being close to attractions. | Highton Village shops, local parks, Balyang Sanctuary, nearby wineries |
| Ceres | A rural setting just outside Geelong known for its natural beauty and community feel. Perfect for a getaway from the city bustle. | Ceres Community Environment Park, Bellarine Peninsula wineries, Bush walking trails |
| Torquay | The gateway to the Great Ocean Road, famous for its incredible beaches and surf culture. Perfect for beach lovers and adventurers. | Torquay Surf Beach, Bells Beach, Great Ocean Road |
| Barwon Heads | A charming coastal town perfect for relaxing getaways, featuring beaches and scenic riverside locations. Popular with families and couples. | Barwon Heads Beach, Thomson River, Local cafes and shops |
Understanding Airbnb License Requirements & STR Laws in Geelong (2025)
While Geelong, Victoria, Australia currently shows low STR regulations, specific Airbnb license requirements might still exist or change. Always verify the latest short term rental regulations and Airbnb license requirements directly with local government authorities for Geelong to ensure full compliance before hosting.
(Source: AirROI data, 2025, finding no licensed listings among those analyzed)
Top Performing Airbnb Properties in Geelong (2025)
Benchmark your potential! Explore examples of top-performing Airbnb properties in Geelongbased on Trailing Twelve Month (TTM) revenue. Analyze their characteristics, revenue, occupancy rate, and ADR to understand what drives success in this market.
Ultimate Holiday or Corporate Stay
Entire Place • 8 bedrooms
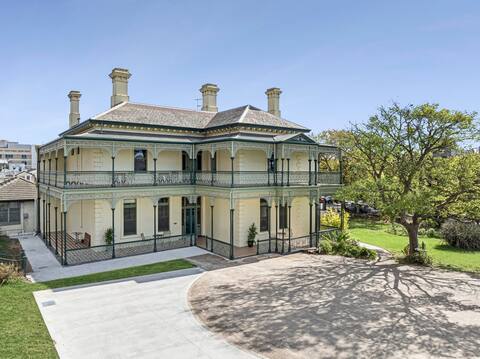
Myer’s Manor I Entire Mansion in Geelong CBD
Entire Place • 8 bedrooms
Bonnie Belle I Geelong CBD Luxury
Entire Place • 4 bedrooms
The Bail - Belmont/ Pet Friendly
Entire Place • 4 bedrooms
Kilgour Resort in Geelong CBD
Entire Place • 3 bedrooms
Warranyah - Perfect on Preston
Entire Place • 4 bedrooms
Note: Performance varies based on location, size, amenities, seasonality, and management quality. Data reflects the past 12 months.
Top Performing Airbnb Hosts in Geelong (2025)
Learn from the best! This table showcases top-performing Airbnb hosts in Geelong based on the number of properties managed and estimated total revenue over the past year. Analyze their scale and performance metrics.
| Host Name | Properties | Grossing Revenue | Stay Reviews | Avg Rating |
|---|---|---|---|---|
| Debbie Regional Escapes | 58 | $2,183,935 | 1682 | 4.58/5.0 |
| Courtney | 24 | $505,075 | 522 | 4.64/5.0 |
| Nicholas | 44 | $425,086 | 2227 | 4.59/5.0 |
| Haven Retreat | 18 | $402,749 | 373 | 4.80/5.0 |
| Host On The Coast | 10 | $319,365 | 239 | 4.67/5.0 |
| Mibnb | 7 | $203,359 | 745 | 4.71/5.0 |
| Warren | 6 | $138,774 | 221 | 4.89/5.0 |
| Qwik Real Estate | 5 | $132,649 | 133 | 3.66/5.0 |
| Eve | 3 | $131,535 | 75 | 4.78/5.0 |
| Great Ocean Road Escapes | 4 | $126,628 | 227 | 4.91/5.0 |
Analyzing the strategies of top hosts, such as their property selection, pricing, and guest communication, can offer valuable lessons for optimizing your own Airbnb operations in Geelong.
Dive Deeper: Advanced Geelong STR Market Data (2025)
Ready to unlock more insights? AirROI provides access to advanced metrics and comprehensive Airbnb data for Geelong. Explore detailed analytics beyond this report to refine your investment strategy, optimize pricing, and maximize your vacation rental profits.
Explore Advanced MetricsGeelong Short-Term Rental Market Composition (2025): Property & Room Types
Room Type Distribution
Property Type Distribution
Market Composition Insights for Geelong
- The Geelong Airbnb market composition is heavily skewed towards Entire Home/Apt listings, which make up 84.8% of the 508 active rentals. This indicates strong guest preference for privacy and space.
- Looking at the property type distribution in Geelong, House properties are the most common (54.7%), reflecting the local real estate landscape.
- Houses represent a significant 54.7% portion, catering likely to families or larger groups.
- The presence of 7.9% Hotel/Boutique listings indicates integration with traditional hospitality.
- Smaller segments like others, unique stays, outdoor/unique (combined 3.2%) offer potential for unique stay experiences.
Geelong Airbnb Room Capacity Analysis (2025): Bedroom Distribution
Distribution of Listings by Number of Bedrooms
Room Capacity Insights for Geelong
- The dominant room capacity in Geelong is 2 bedrooms listings, making up 30.5% of the market. This suggests a strong demand for properties suitable for couples or solo travelers.
- Together, 2 bedrooms and 1 bedroom properties represent 60.0% of the active Airbnb listings in Geelong, indicating a high concentration in these sizes.
- A significant 30.4% of listings offer 3+ bedrooms, catering to larger groups and families seeking more space in Geelong.
Geelong Vacation Rental Guest Capacity Trends (2025)
Distribution of Listings by Guest Capacity
Guest Capacity Insights for Geelong
- The most common guest capacity trend in Geelong vacation rentals is listings accommodating 2 guests (28%). This suggests the primary traveler segment is likely couples or solo travelers.
- Properties designed for 2 guests and 4 guests dominate the Geelong STR market, accounting for 54.8% of listings.
- 30.0% of properties accommodate 6+ guests, serving the market segment for larger families or group travel in Geelong.
- On average, properties in Geelong are equipped to host 4.0 guests.
Geelong Airbnb Booking Patterns (2025): Available vs. Booked Days
Available Days Distribution
Booked Days Distribution
Booking Pattern Insights for Geelong
- The most common availability pattern in Geelong falls within the 181-270 days range, representing 32.3% of listings. This suggests many properties have significant open periods on their calendars.
- Approximately 64.0% of listings show high availability (181+ days open annually), indicating potential for increased bookings or specific owner usage patterns.
- For booked days, the 91-180 days range is most frequent in Geelong (32.5%), reflecting common guest stay durations or potential owner blocking patterns.
- A notable 37.4% of properties secure long booking periods (181+ days booked per year), highlighting successful long-term rental strategies or significant owner usage.
Geelong Airbnb Minimum Stay Requirements Analysis
Distribution of Listings by Minimum Night Requirement
1 Night
116 listings
25.3% of total
2 Nights
177 listings
38.6% of total
3 Nights
19 listings
4.1% of total
4-6 Nights
14 listings
3.1% of total
7-29 Nights
8 listings
1.7% of total
30+ Nights
125 listings
27.2% of total
Key Insights
- The most prevalent minimum stay requirement in Geelong is 2 Nights, adopted by 38.6% of listings. This highlights the market's preference for shorter, flexible bookings.
- A strong majority (63.9%) of the Geelong Airbnb data shows acceptance of very short stays (1-2 nights), indicating a dynamic, high-turnover market.
- A significant segment (27.2%) caters to monthly stays (30+ nights) in Geelong, pointing to opportunities in the extended-stay market.
Recommendations
- Align with the market by considering a 2 Nights minimum stay, as 38.6% of Geelong hosts use this setting.
- If feasible, allowing 1-night stays, especially midweek or during low season, could capture last-minute bookings, as only 25.3% currently do.
- Explore offering discounts for stays of 30+ nights to attract the 27.2% of the market seeking extended stays.
- Adjust minimum nights based on seasonality – potentially shorter during low season and longer during peak demand periods in Geelong.
Geelong Airbnb Cancellation Policy Trends Analysis (2025)
Super Strict 30 Days
3 listings
0.7% of total
Super Strict 60 Days
1 listings
0.2% of total
Flexible
71 listings
15.9% of total
Moderate
173 listings
38.8% of total
Firm
131 listings
29.4% of total
Strict
67 listings
15% of total
Cancellation Policy Insights for Geelong
- The prevailing Airbnb cancellation policy trend in Geelong is Moderate, used by 38.8% of listings.
- There's a relatively balanced mix between guest-friendly (54.7%) and stricter (44.4%) policies, offering choices for different guest needs.
Recommendations for Hosts
- Consider adopting a Moderate policy to align with the 38.8% market standard in Geelong.
- Regularly review your cancellation policy against competitors and market demand shifts in Geelong.
Geelong STR Booking Lead Time Analysis (2025)
Average Booking Lead Time by Month
Booking Lead Time Insights for Geelong
- The overall average booking lead time for vacation rentals in Geelong is 42 days.
- Guests book furthest in advance for stays during March (average 65 days), likely coinciding with peak travel demand or local events.
- The shortest booking windows occur for stays in August (average 28 days), indicating more last-minute travel plans during this time.
- Seasonally, Spring (47 days avg.) sees the longest lead times, while Summer (33 days avg.) has the shortest, reflecting typical travel planning cycles.
Recommendations for Hosts
- Use the overall average lead time (42 days) as a baseline for your pricing and availability strategy in Geelong.
- For March stays, consider implementing length-of-stay discounts or slightly higher rates for bookings made less than 65 days out to capitalize on advance planning.
- Target marketing efforts for the Spring season well in advance (at least 47 days) to capture early planners.
- Monitor your own booking lead times against these Geelong averages to identify opportunities for dynamic pricing adjustments.
Popular & Essential Airbnb Amenities in Geelong (2025)
Amenity Prevalence
Amenity Insights for Geelong
- Essential amenities in Geelong that guests expect include: Smoke alarm, Heating, TV. Lacking these (any) could significantly impact bookings.
- Popular amenities like Wifi, Kitchen, Air conditioning are common but not universal. Offering these can provide a competitive edge.
- Warning: Wifi is not universally provided but is considered essential globally. Ensure reliable Wifi is offered.
Recommendations for Hosts
- Ensure your listing includes all essential amenities for Geelong: Smoke alarm, Heating, TV.
- Prioritize adding missing essentials: Smoke alarm, Heating, TV.
- Consider adding popular differentiators like Wifi or Kitchen to increase appeal.
- Highlight unique or less common amenities you offer (e.g., hot tub, dedicated workspace, EV charger) in your listing description and photos.
- Regularly check competitor amenities in Geelong to stay competitive.
Geelong Airbnb Guest Demographics & Profile Analysis (2025)
Guest Profile Summary for Geelong
- The typical guest profile for Airbnb in Geelong consists of primarily domestic travelers (88%), often arriving from nearby Melbourne, typically belonging to the Post-2000s (Gen Z/Alpha) group (50%), primarily speaking English or Chinese.
- Domestic travelers account for 87.7% of guests.
- Key international markets include Australia (87.7%) and United Kingdom (1.9%).
- Top languages spoken are English (70.5%) followed by Chinese (6.6%).
- A significant demographic segment is the Post-2000s (Gen Z/Alpha) group, representing 50% of guests.
Recommendations for Hosts
- Target domestic marketing efforts towards travelers from Melbourne and Victoria.
- Tailor amenities and listing descriptions to appeal to the dominant Post-2000s (Gen Z/Alpha) demographic (e.g., highlight fast WiFi, smart home features, local guides).
- Highlight unique local experiences or amenities relevant to the primary guest profile.
- Consider seasonal promotions aligned with peak travel times for key origin markets.
Nearby Short-Term Rental Market Comparison
How does the Geelong Airbnb market stack up against its neighbors? Compare key performance metrics like average monthly revenue, ADR, and occupancy rates in surrounding areas to understand the broader regional STR landscape.
| Market | Active Properties | Monthly Revenue | Daily Rate | Avg. Occupancy |
|---|---|---|---|---|
| King Island Council | 11 | $5,231 | $550.50 | 37% |
| Lancefield | 18 | $4,069 | $343.64 | 49% |
| Leopold | 12 | $3,496 | $429.65 | 41% |
| Trentham | 52 | $3,455 | $269.84 | 41% |
| Lyonville | 10 | $3,441 | $349.65 | 35% |
| Shire of Hepburn | 283 | $3,120 | $298.86 | 36% |
| Shire of Murrindindi | 70 | $3,061 | $268.84 | 40% |
| Daylesford | 462 | $3,028 | $297.26 | 35% |
| San Remo | 82 | $2,997 | $299.99 | 36% |
| Malmsbury | 11 | $2,957 | $232.06 | 38% |