Euroa Airbnb Market Analysis 2025: Short Term Rental Data & Vacation Rental Statistics in Victoria, Australia
Is Airbnb profitable in Euroa in 2025? Explore comprehensive Airbnb analytics for Euroa, Victoria, Australia to uncover income potential. This 2025 STR market report for Euroa, based on AirROI data from April 2024 to March 2025, reveals key trends in the niche market of 25 active listings.
Whether you're considering an Airbnb investment in Euroa, optimizing your existing vacation rental, or exploring rental arbitrage opportunities, understanding the Euroa Airbnb data is crucial. Leveraging the low regulation environment is key to maximizing your short term rental income potential. Let's dive into the specifics.
Key Euroa Airbnb Performance Metrics Overview
Monthly Airbnb Revenue Variations & Income Potential in Euroa (2025)
Understanding the monthly revenue variations for Airbnb listings in Euroa is key to maximizing your short term rental income potential. Seasonality significantly impacts earnings. Our analysis, based on data from the past 12 months, shows that the peak revenue month for STRs in Euroa is typically December, while August often presents the lowest earnings, highlighting opportunities for strategic pricing adjustments during shoulder and low seasons. Explore the typical Airbnb income in Euroa across different performance tiers:
- Best-in-class properties (Top 10%) achieve $4,548+ monthly, often utilizing dynamic pricing and superior guest experiences.
- Strong performing properties (Top 25%) earn $2,254 or more, indicating effective management and desirable locations/amenities.
- Typical properties (Median) generate around $1,429 per month, representing the average market performance.
- Entry-level properties (Bottom 25%) see earnings around $755, often with potential for optimization.
Average Monthly Airbnb Earnings Trend in Euroa
Euroa Airbnb Occupancy Rate Trends (2025)
Maximize your bookings by understanding the Euroa STR occupancy trends. Seasonal demand shifts significantly influence how often properties are booked. Typically, Septembersees the highest demand (peak season occupancy), while June experiences the lowest (low season). Effective strategies, like adjusting minimum stays or offering promotions, can boost occupancy during slower periods. Here's how different property tiers perform in Euroa:
- Best-in-class properties (Top 10%) achieve 76%+ occupancy, indicating high desirability and potentially optimized availability.
- Strong performing properties (Top 25%) maintain 55% or higher occupancy, suggesting good market fit and guest satisfaction.
- Typical properties (Median) have an occupancy rate around 31%.
- Entry-level properties (Bottom 25%) average 16% occupancy, potentially facing higher vacancy.
Average Monthly Occupancy Rate Trend in Euroa
Average Daily Rate (ADR) Airbnb Trends in Euroa (2025)
Effective short term rental pricing strategy in Euroa involves understanding monthly ADR fluctuations. The Average Daily Rate (ADR) for Airbnb in Euroa typically peaks in October and dips lowest during November. Leveraging Airbnb dynamic pricing tools or strategies based on this seasonality can significantly boost revenue. Here's a look at the typical nightly rates achieved:
- Best-in-class properties (Top 10%) command rates of $226+ per night, often due to premium features or locations.
- Strong performing properties (Top 25%) achieve nightly rates of $187 or more.
- Typical properties (Median) charge around $143 per night.
- Entry-level properties (Bottom 25%) earn around $121 per night.
Average Daily Rate (ADR) Trend by Month in Euroa
Get Live Euroa Market Intelligence 👇

Explore Real-time Analytics
Airbnb Seasonality Analysis & Trends in Euroa (2025)
Peak Season (December, May, January)
- Revenue averages $2,215 per month
- Occupancy rates average 40.1%
- Daily rates average $184
Shoulder Season
- Revenue averages $1,881 per month
- Occupancy maintains around 36.7%
- Daily rates hold near $198
Low Season (July, August, November)
- Revenue drops to average $1,632 per month
- Occupancy decreases to average 36.4%
- Daily rates adjust to average $191
Seasonality Insights for Euroa
- The Airbnb seasonality in Euroa shows moderate seasonality with distinct peak and low periods. While the sections above show seasonal averages, it's also insightful to look at the extremes:
- During the high season, the absolute peak month showcases Euroa's highest earning potential, with monthly revenues capable of climbing to $2,438, occupancy reaching a high of 42.2%, and ADRs peaking at $218.
- Conversely, the slowest single month of the year, typically falling within the low season, marks the market's lowest point. In this month, revenue might dip to $1,549, occupancy could drop to 27.0%, and ADRs may adjust down to $143.
- Understanding both the seasonal averages and these monthly peaks and troughs in revenue, occupancy, and ADR is crucial for maximizing your Airbnb profit potential in Euroa.
Seasonal Strategies for Maximizing Profit
- Peak Season: Maximize revenue through premium pricing and potentially longer minimum stays. Ensure high availability.
- Low Season: Offer competitive pricing, special promotions (e.g., extended stay discounts), and flexible cancellation policies. Target off-season travelers like remote workers or budget-conscious guests.
- Shoulder Seasons: Implement dynamic pricing that balances peak and low rates. Target weekend travelers or specific events. Offer slightly more flexible terms than peak season.
- Regularly analyze your own performance against these Euroa seasonality benchmarks and adjust your pricing and availability strategy accordingly.
Best Areas for Airbnb Investment in Euroa (2025)
Exploring the top neighborhoods for short-term rentals in Euroa? This section highlights key areas, outlining why they are attractive for hosts and guests, along with notable local attractions. Consider these locations based on your target guest profile and investment strategy.
| Neighborhood / Area | Why Host Here? (Target Guests & Appeal) | Key Attractions & Landmarks |
|---|---|---|
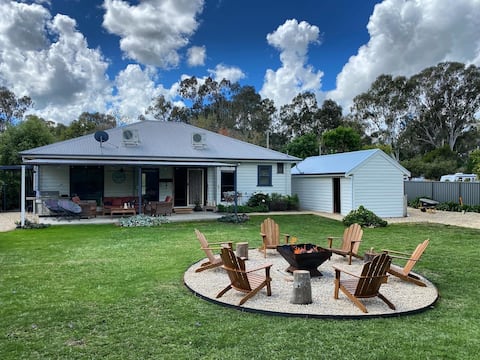
| Euroa Township | The heart of Euroa with cafes, shops, and the historic architecture. Ideal for travelers looking for a quaint rural experience with local charm and accessibility to nearby nature. | Euroa Historic Railway Station, St John's Anglican Church, Euroa Community Cinema, Euroa Botanical Gardens, Local Shops and Cafes |
| Seven Creeks Park | A beautiful natural area perfect for outdoor activities and family-friendly gatherings. Attracts nature lovers and families looking for a peaceful retreat. | Seven Creeks, Walking trails, Picnic areas, Playground, Fishing spots |
| Euroa Golf Club | A popular spot for golf enthusiasts and travelers seeking leisurely activities. Offers beautiful views and a relaxing atmosphere. | Euroa Golf Club, Scenic views, Community events, Dining areas |
| Ruffy Lake | A scenic lake allowing for recreational activities such as fishing and picnicking. Attracts visitors interested in outdoor sports and relaxation. | Fishing, Picnicking, Walking trails, Bird watching |
| Wangaratta Rd | A route that connects several locations and businesses, ideal for travelers who need convenience and accessibility to major roads and amenities. | Local businesses, Convenient access to attractions, Short drive to attractions in surrounding areas |
| Strathbogie Ranges | A stunning mountain range offering breathtaking views and opportunities for hiking and exploration. Attracts adventure seekers and nature lovers. | Hiking trails, Picnic spots, Wildlife viewing, Scenic drives |
| Euroa Showgrounds | A key location for events and community gatherings, attracts visitors during event seasons. | Local events, Markets, Community activities, Family-friendly gatherings |
| Custon Creek | A picturesque creek area that offers a tranquil escape and natural beauty. Good for guests looking for a peaceful getaway. | Walking paths, Fishing spots, Natural beauty, Picnic areas |
Understanding Airbnb License Requirements & STR Laws in Euroa (2025)
While Euroa, Victoria, Australia currently shows low STR regulations, specific Airbnb license requirements might still exist or change. Always verify the latest short term rental regulations and Airbnb license requirements directly with local government authorities for Euroa to ensure full compliance before hosting.
(Source: AirROI data, 2025, finding no licensed listings among those analyzed)
Top Performing Airbnb Properties in Euroa (2025)
Benchmark your potential! Explore examples of top-performing Airbnb properties in Euroabased on Trailing Twelve Month (TTM) revenue. Analyze their characteristics, revenue, occupancy rate, and ADR to understand what drives success in this market.

Relax in the country - 6 guests - Modern Unit
Entire Place • 3 bedrooms

welcome to the ELM
Entire Place • 3 bedrooms

Millie Rose Cottage
Entire Place • 3 bedrooms
The Kirkland Euroa
Entire Place • 3 bedrooms
Unique Stay Loft - Oaks from Acorns
Entire Place • 3 bedrooms

Little Woodland
Entire Place • 3 bedrooms
Note: Performance varies based on location, size, amenities, seasonality, and management quality. Data reflects the past 12 months.
Top Performing Airbnb Hosts in Euroa (2025)
Learn from the best! This table showcases top-performing Airbnb hosts in Euroa based on the number of properties managed and estimated total revenue over the past year. Analyze their scale and performance metrics.
| Host Name | Properties | Grossing Revenue | Stay Reviews | Avg Rating |
|---|---|---|---|---|
| Kristy | 5 | $77,641 | 72 | 4.77/5.0 |
| Phil | 1 | $60,589 | 85 | 4.96/5.0 |
| Marcus | 1 | $38,488 | 25 | 4.84/5.0 |
| Eileen | 1 | $35,929 | 96 | 4.85/5.0 |
| Host #9745232 | 1 | $33,464 | 21 | 4.62/5.0 |
| Caz | 1 | $29,409 | 38 | 4.87/5.0 |
| Mary | 1 | $27,125 | 18 | 5.00/5.0 |
| Tiny Away | 2 | $25,577 | 49 | 4.37/5.0 |
| Veronica | 1 | $20,062 | 181 | 4.88/5.0 |
| Bronwyn And Wayne | 1 | $18,972 | 240 | 4.98/5.0 |
Analyzing the strategies of top hosts, such as their property selection, pricing, and guest communication, can offer valuable lessons for optimizing your own Airbnb operations in Euroa.
Dive Deeper: Advanced Euroa STR Market Data (2025)
Ready to unlock more insights? AirROI provides access to advanced metrics and comprehensive Airbnb data for Euroa. Explore detailed analytics beyond this report to refine your investment strategy, optimize pricing, and maximize your vacation rental profits.
Explore Advanced MetricsEuroa Short-Term Rental Market Composition (2025): Property & Room Types
Room Type Distribution
Property Type Distribution
Market Composition Insights for Euroa
- The Euroa Airbnb market composition is heavily skewed towards Entire Home/Apt listings, which make up 92% of the 25 active rentals. This indicates strong guest preference for privacy and space.
- Looking at the property type distribution in Euroa, House properties are the most common (40%), reflecting the local real estate landscape.
- Houses represent a significant 40% portion, catering likely to families or larger groups.
- The presence of 20% Hotel/Boutique listings indicates integration with traditional hospitality.
- Smaller segments like apartment/condo (combined 4.0%) offer potential for unique stay experiences.
Euroa Airbnb Room Capacity Analysis (2025): Bedroom Distribution
Distribution of Listings by Number of Bedrooms
Room Capacity Insights for Euroa
- The dominant room capacity in Euroa is 1 bedroom listings, making up 64% of the market. This suggests a strong demand for properties suitable for couples or solo travelers.
- Together, 1 bedroom and 3 bedrooms properties represent 88.0% of the active Airbnb listings in Euroa, indicating a high concentration in these sizes.
- With over half the market (64%) consisting of studios or 1-bedroom units, Euroa is particularly well-suited for individuals or couples.
- A significant 24.0% of listings offer 3+ bedrooms, catering to larger groups and families seeking more space in Euroa.
Euroa Vacation Rental Guest Capacity Trends (2025)
Distribution of Listings by Guest Capacity
Guest Capacity Insights for Euroa
- The most common guest capacity trend in Euroa vacation rentals is listings accommodating 2 guests (44%). This suggests the primary traveler segment is likely couples or solo travelers.
- Properties designed for 2 guests and 6 guests dominate the Euroa STR market, accounting for 64.0% of listings.
- A significant 44.0% of listings cater specifically to 1-2 guests, highlighting strong demand from couples and solo travelers in Euroa.
- 32.0% of properties accommodate 6+ guests, serving the market segment for larger families or group travel in Euroa.
- On average, properties in Euroa are equipped to host 4.0 guests.
Euroa Airbnb Booking Patterns (2025): Available vs. Booked Days
Available Days Distribution
Booked Days Distribution
Booking Pattern Insights for Euroa
- The most common availability pattern in Euroa falls within the 181-270 days range, representing 48% of listings. This suggests many properties have significant open periods on their calendars.
- Approximately 84.0% of listings show high availability (181+ days open annually), indicating potential for increased bookings or specific owner usage patterns.
- For booked days, the 91-180 days range is most frequent in Euroa (48%), reflecting common guest stay durations or potential owner blocking patterns.
- A notable 16.0% of properties secure long booking periods (181+ days booked per year), highlighting successful long-term rental strategies or significant owner usage.
Euroa Airbnb Minimum Stay Requirements Analysis
Distribution of Listings by Minimum Night Requirement
1 Night
8 listings
36.4% of total
2 Nights
7 listings
31.8% of total
30+ Nights
7 listings
31.8% of total
Key Insights
- The most prevalent minimum stay requirement in Euroa is 1 Night, adopted by 36.4% of listings. This highlights the market's preference for shorter, flexible bookings.
- A strong majority (68.2%) of the Euroa Airbnb data shows acceptance of very short stays (1-2 nights), indicating a dynamic, high-turnover market.
- A significant segment (31.8%) caters to monthly stays (30+ nights) in Euroa, pointing to opportunities in the extended-stay market.
Recommendations
- Align with the market by considering a 1 Night minimum stay, as 36.4% of Euroa hosts use this setting.
- Explore offering discounts for stays of 30+ nights to attract the 31.8% of the market seeking extended stays.
- Adjust minimum nights based on seasonality – potentially shorter during low season and longer during peak demand periods in Euroa.
Euroa Airbnb Cancellation Policy Trends Analysis (2025)
Super Strict 30 Days
5 listings
20.8% of total
Flexible
6 listings
25% of total
Moderate
8 listings
33.3% of total
Firm
3 listings
12.5% of total
Strict
2 listings
8.3% of total
Cancellation Policy Insights for Euroa
- The prevailing Airbnb cancellation policy trend in Euroa is Moderate, used by 33.3% of listings.
- There's a relatively balanced mix between guest-friendly (58.3%) and stricter (20.8%) policies, offering choices for different guest needs.
- Strict cancellation policies are quite rare (8.3%), potentially making listings with this policy less competitive unless justified by high demand or property type.
Recommendations for Hosts
- Consider adopting a Moderate policy to align with the 33.3% market standard in Euroa.
- Using a Strict policy might deter some guests, as only 8.3% of listings use it. Evaluate if potential revenue protection outweighs possible lower booking rates.
- Regularly review your cancellation policy against competitors and market demand shifts in Euroa.
Euroa STR Booking Lead Time Analysis (2025)
Average Booking Lead Time by Month
Booking Lead Time Insights for Euroa
- The overall average booking lead time for vacation rentals in Euroa is 70 days.
- Guests book furthest in advance for stays during November (average 107 days), likely coinciding with peak travel demand or local events.
- The shortest booking windows occur for stays in August (average 34 days), indicating more last-minute travel plans during this time.
- Seasonally, Spring (86 days avg.) sees the longest lead times, while Summer (42 days avg.) has the shortest, reflecting typical travel planning cycles.
Recommendations for Hosts
- Use the overall average lead time (70 days) as a baseline for your pricing and availability strategy in Euroa.
- For November stays, consider implementing length-of-stay discounts or slightly higher rates for bookings made less than 107 days out to capitalize on advance planning.
- Target marketing efforts for the Spring season well in advance (at least 86 days) to capture early planners.
- Monitor your own booking lead times against these Euroa averages to identify opportunities for dynamic pricing adjustments.
Popular & Essential Airbnb Amenities in Euroa (2025)
Amenity Prevalence
Amenity Insights for Euroa
- Essential amenities in Euroa that guests expect include: Heating, Free parking on premises, Essentials, Air conditioning, Smoke alarm, Dishes and silverware. Lacking these (any) could significantly impact bookings.
- Popular amenities like Refrigerator, Hangers, Hot water are common but not universal. Offering these can provide a competitive edge.
Recommendations for Hosts
- Ensure your listing includes all essential amenities for Euroa: Heating, Free parking on premises, Essentials, Air conditioning, Smoke alarm, Dishes and silverware.
- Prioritize adding missing essentials: Smoke alarm, Dishes and silverware.
- Consider adding popular differentiators like Refrigerator or Hangers to increase appeal.
- Highlight unique or less common amenities you offer (e.g., hot tub, dedicated workspace, EV charger) in your listing description and photos.
- Regularly check competitor amenities in Euroa to stay competitive.
Euroa Airbnb Guest Demographics & Profile Analysis (2025)
Guest Profile Summary for Euroa
- The typical guest profile for Airbnb in Euroa consists of primarily domestic travelers (97%), often arriving from nearby Melbourne, typically belonging to the Post-2000s (Gen Z/Alpha) group (50%), primarily speaking English or German.
- Domestic travelers account for 97.4% of guests.
- Key international markets include Australia (97.4%) and United Kingdom (1%).
- Top languages spoken are English (72.9%) followed by German (2.8%).
- A significant demographic segment is the Post-2000s (Gen Z/Alpha) group, representing 50% of guests.
Recommendations for Hosts
- Target domestic marketing efforts towards travelers from Melbourne and Victoria.
- Tailor amenities and listing descriptions to appeal to the dominant Post-2000s (Gen Z/Alpha) demographic (e.g., highlight fast WiFi, smart home features, local guides).
- Highlight unique local experiences or amenities relevant to the primary guest profile.
- Consider seasonal promotions aligned with peak travel times for key origin markets.
Nearby Short-Term Rental Market Comparison
How does the Euroa Airbnb market stack up against its neighbors? Compare key performance metrics like average monthly revenue, ADR, and occupancy rates in surrounding areas to understand the broader regional STR landscape.
| Market | Active Properties | Monthly Revenue | Daily Rate | Avg. Occupancy |
|---|---|---|---|---|
| Lancefield | 18 | $4,069 | $343.64 | 49% |
| Howqua Inlet | 13 | $3,634 | $322.01 | 37% |
| Bright | 474 | $3,468 | $294.34 | 42% |
| Trentham | 52 | $3,455 | $269.84 | 41% |
| Lyonville | 10 | $3,441 | $349.65 | 35% |
| Porepunkah | 40 | $3,397 | $328.54 | 37% |
| Nagambie | 33 | $3,381 | $300.42 | 40% |
| Shire of Mansfield | 89 | $3,347 | $392.77 | 34% |
| Shire of Strathbogie | 43 | $3,173 | $314.72 | 37% |
| Jamieson | 37 | $3,138 | $283.80 | 33% |