Dunkeld Airbnb Market Analysis 2025: Short Term Rental Data & Vacation Rental Statistics in Victoria, Australia
Is Airbnb profitable in Dunkeld in 2025? Explore comprehensive Airbnb analytics for Dunkeld, Victoria, Australia to uncover income potential. This 2025 STR market report for Dunkeld, based on AirROI data from April 2024 to March 2025, reveals key trends in the niche market of 37 active listings.
Whether you're considering an Airbnb investment in Dunkeld, optimizing your existing vacation rental, or exploring rental arbitrage opportunities, understanding the Dunkeld Airbnb data is crucial. Leveraging the low regulation environment is key to maximizing your short term rental income potential. Let's dive into the specifics.
Key Dunkeld Airbnb Performance Metrics Overview
Monthly Airbnb Revenue Variations & Income Potential in Dunkeld (2025)
Understanding the monthly revenue variations for Airbnb listings in Dunkeld is key to maximizing your short term rental income potential. Seasonality significantly impacts earnings. Our analysis, based on data from the past 12 months, shows that the peak revenue month for STRs in Dunkeld is typically April, while February often presents the lowest earnings, highlighting opportunities for strategic pricing adjustments during shoulder and low seasons. Explore the typical Airbnb income in Dunkeld across different performance tiers:
- Best-in-class properties (Top 10%) achieve $4,554+ monthly, often utilizing dynamic pricing and superior guest experiences.
- Strong performing properties (Top 25%) earn $3,247 or more, indicating effective management and desirable locations/amenities.
- Typical properties (Median) generate around $2,147 per month, representing the average market performance.
- Entry-level properties (Bottom 25%) see earnings around $1,224, often with potential for optimization.
Average Monthly Airbnb Earnings Trend in Dunkeld
Dunkeld Airbnb Occupancy Rate Trends (2025)
Maximize your bookings by understanding the Dunkeld STR occupancy trends. Seasonal demand shifts significantly influence how often properties are booked. Typically, Octobersees the highest demand (peak season occupancy), while February experiences the lowest (low season). Effective strategies, like adjusting minimum stays or offering promotions, can boost occupancy during slower periods. Here's how different property tiers perform in Dunkeld:
- Best-in-class properties (Top 10%) achieve 71%+ occupancy, indicating high desirability and potentially optimized availability.
- Strong performing properties (Top 25%) maintain 57% or higher occupancy, suggesting good market fit and guest satisfaction.
- Typical properties (Median) have an occupancy rate around 37%.
- Entry-level properties (Bottom 25%) average 22% occupancy, potentially facing higher vacancy.
Average Monthly Occupancy Rate Trend in Dunkeld
Average Daily Rate (ADR) Airbnb Trends in Dunkeld (2025)
Effective short term rental pricing strategy in Dunkeld involves understanding monthly ADR fluctuations. The Average Daily Rate (ADR) for Airbnb in Dunkeld typically peaks in December and dips lowest during September. Leveraging Airbnb dynamic pricing tools or strategies based on this seasonality can significantly boost revenue. Here's a look at the typical nightly rates achieved:
- Best-in-class properties (Top 10%) command rates of $330+ per night, often due to premium features or locations.
- Strong performing properties (Top 25%) achieve nightly rates of $230 or more.
- Typical properties (Median) charge around $155 per night.
- Entry-level properties (Bottom 25%) earn around $120 per night.
Average Daily Rate (ADR) Trend by Month in Dunkeld
Get Live Dunkeld Market Intelligence 👇

Explore Real-time Analytics
Airbnb Seasonality Analysis & Trends in Dunkeld (2025)
Peak Season (April, May, June)
- Revenue averages $3,031 per month
- Occupancy rates average 39.8%
- Daily rates average $181
Shoulder Season
- Revenue averages $2,569 per month
- Occupancy maintains around 45.6%
- Daily rates hold near $187
Low Season (January, February, March)
- Revenue drops to average $1,658 per month
- Occupancy decreases to average 30.1%
- Daily rates adjust to average $196
Seasonality Insights for Dunkeld
- The Airbnb seasonality in Dunkeld shows highly seasonal trends requiring careful strategy. While the sections above show seasonal averages, it's also insightful to look at the extremes:
- During the high season, the absolute peak month showcases Dunkeld's highest earning potential, with monthly revenues capable of climbing to $3,271, occupancy reaching a high of 51.1%, and ADRs peaking at $201.
- Conversely, the slowest single month of the year, typically falling within the low season, marks the market's lowest point. In this month, revenue might dip to $1,457, occupancy could drop to 27.9%, and ADRs may adjust down to $179.
- Understanding both the seasonal averages and these monthly peaks and troughs in revenue, occupancy, and ADR is crucial for maximizing your Airbnb profit potential in Dunkeld.
Seasonal Strategies for Maximizing Profit
- Peak Season: Maximize revenue through premium pricing and potentially longer minimum stays. Ensure high availability.
- Low Season: Offer competitive pricing, special promotions (e.g., extended stay discounts), and flexible cancellation policies. Target off-season travelers like remote workers or budget-conscious guests.
- Shoulder Seasons: Implement dynamic pricing that balances peak and low rates. Target weekend travelers or specific events. Offer slightly more flexible terms than peak season.
- Regularly analyze your own performance against these Dunkeld seasonality benchmarks and adjust your pricing and availability strategy accordingly.
Best Areas for Airbnb Investment in Dunkeld (2025)
Exploring the top neighborhoods for short-term rentals in Dunkeld? This section highlights key areas, outlining why they are attractive for hosts and guests, along with notable local attractions. Consider these locations based on your target guest profile and investment strategy.
| Neighborhood / Area | Why Host Here? (Target Guests & Appeal) | Key Attractions & Landmarks |
|---|---|---|
| Dunkeld Village | Charming village atmosphere surrounded by the Grampians National Park, making it ideal for nature lovers seeking a peaceful retreat. Offers breathtaking views and access to hiking trails. | Grampians National Park, Mount Sturgeon, Dunkeld Heritage Walk, Dunkeld Arboretum, Dunkeld Old Bakery |
| Grampians Road | A major route for tourists visiting the Grampians with numerous scenic overlooks and attractions, perfect for Airbnb hosts looking for visibility and tourist traffic. | Reeds Lookout, Boroka Lookout, Halls Gap, MacKenzie Falls, Grampians Wine Region |
| Dunkeld Golf Course | A picturesque golf course that attracts golf enthusiasts and families, ideal for leisure travelers looking for recreation and relaxation in a beautiful setting. | Dunkeld Golf Club, Local eateries, Natural beauty surrounding the course |
| Wannon Falls | A stunning natural waterfall that draws visitors to the area for picnics and photography. It is appealing for those seeking outdoor experiences and natural beauty. | Wannon Falls, Parks and picnic areas, Walking trails |
| Mount William | Offers adventurous hiking experiences and scenic views, attracting outdoor enthusiasts and tourists who enjoy climbing and exploring natural landscapes. | Mount William Summit, Hiking trails, Scenic outlooks |
| Grampians Wildflower | Known for its diverse flora and fauna, ideal for eco-tourism and attracting guests interested in nature walks and photography. | Wildflower trails, Guided tours, Nature photography opportunities |
| Local wineries | The surrounding region features local wineries and vineyards, appealing to wine lovers and guests interested in culinary experiences. | Wineries and cellar doors, Wine tasting tours, Gourmet dining experiences |
| Mount Sturgeon Track | A popular hiking trail that offers stunning views of the Grampians landscapes, appealing to adventure seekers and photographers. | Scenic views, Hiking, Wildlife spotting |
Understanding Airbnb License Requirements & STR Laws in Dunkeld (2025)
While Dunkeld, Victoria, Australia currently shows low STR regulations, specific Airbnb license requirements might still exist or change. Always verify the latest short term rental regulations and Airbnb license requirements directly with local government authorities for Dunkeld to ensure full compliance before hosting.
(Source: AirROI data, 2025, finding no licensed listings among those analyzed)
Top Performing Airbnb Properties in Dunkeld (2025)
Benchmark your potential! Explore examples of top-performing Airbnb properties in Dunkeldbased on Trailing Twelve Month (TTM) revenue. Analyze their characteristics, revenue, occupancy rate, and ADR to understand what drives success in this market.

Mud Dad-jug Magic
Entire Place • 4 bedrooms
Wild Cherry | 1bdr Aquila treehouse
Entire Place • 1 bedroom

Dunkeld House - Beautiful Country Accommodation
Entire Place • 3 bedrooms
Mereweather Accommodation
Entire Place • 2 bedrooms

Peppercorn Cottage | Grampians
Entire Place • 3 bedrooms
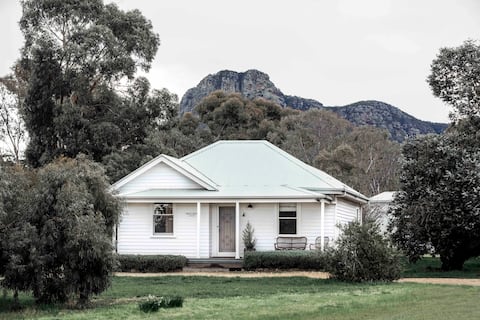
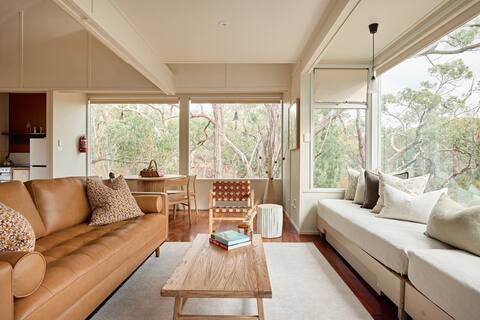
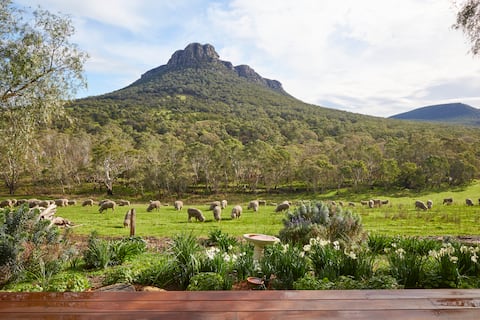
A nostalgic outpost at the foot of the Grampians
Entire Place • 2 bedrooms
Note: Performance varies based on location, size, amenities, seasonality, and management quality. Data reflects the past 12 months.
Top Performing Airbnb Hosts in Dunkeld (2025)
Learn from the best! This table showcases top-performing Airbnb hosts in Dunkeld based on the number of properties managed and estimated total revenue over the past year. Analyze their scale and performance metrics.
| Host Name | Properties | Grossing Revenue | Stay Reviews | Avg Rating |
|---|---|---|---|---|
| Paola | 4 | $124,765 | 65 | 4.92/5.0 |
| Jo | 1 | $68,910 | 44 | 5.00/5.0 |
| Di | 3 | $59,140 | 230 | 4.86/5.0 |
| Jackie | 1 | $50,054 | 64 | 4.98/5.0 |
| Heather M | 1 | $48,180 | 237 | 4.95/5.0 |
| Min | 1 | $45,694 | 8 | 5.00/5.0 |
| Amanda | 1 | $43,099 | 250 | 4.93/5.0 |
| Felicity | 1 | $37,981 | 31 | 4.97/5.0 |
| Claudia | 1 | $34,529 | 231 | 4.97/5.0 |
| Mulberry | 1 | $33,071 | 28 | 4.68/5.0 |
Analyzing the strategies of top hosts, such as their property selection, pricing, and guest communication, can offer valuable lessons for optimizing your own Airbnb operations in Dunkeld.
Dive Deeper: Advanced Dunkeld STR Market Data (2025)
Ready to unlock more insights? AirROI provides access to advanced metrics and comprehensive Airbnb data for Dunkeld. Explore detailed analytics beyond this report to refine your investment strategy, optimize pricing, and maximize your vacation rental profits.
Explore Advanced MetricsDunkeld Short-Term Rental Market Composition (2025): Property & Room Types
Room Type Distribution
Property Type Distribution
Market Composition Insights for Dunkeld
- The Dunkeld Airbnb market composition is heavily skewed towards Entire Home/Apt listings, which make up 97.3% of the 37 active rentals. This indicates strong guest preference for privacy and space.
- Looking at the property type distribution in Dunkeld, House properties are the most common (70.3%), reflecting the local real estate landscape.
- Houses represent a significant 70.3% portion, catering likely to families or larger groups.
- Smaller segments like others, hotel/boutique (combined 5.4%) offer potential for unique stay experiences.
Dunkeld Airbnb Room Capacity Analysis (2025): Bedroom Distribution
Distribution of Listings by Number of Bedrooms
Room Capacity Insights for Dunkeld
- The dominant room capacity in Dunkeld is 2 bedrooms listings, making up 45.9% of the market. This suggests a strong demand for properties suitable for couples or solo travelers.
- Together, 2 bedrooms and 3 bedrooms properties represent 72.9% of the active Airbnb listings in Dunkeld, indicating a high concentration in these sizes.
- A significant 37.8% of listings offer 3+ bedrooms, catering to larger groups and families seeking more space in Dunkeld.
Dunkeld Vacation Rental Guest Capacity Trends (2025)
Distribution of Listings by Guest Capacity
Guest Capacity Insights for Dunkeld
- The most common guest capacity trend in Dunkeld vacation rentals is listings accommodating 4 guests (43.2%). This suggests the primary traveler segment is likely small families or groups.
- Properties designed for 4 guests and 6 guests dominate the Dunkeld STR market, accounting for 64.8% of listings.
- 35.1% of properties accommodate 6+ guests, serving the market segment for larger families or group travel in Dunkeld.
- On average, properties in Dunkeld are equipped to host 4.7 guests.
Dunkeld Airbnb Booking Patterns (2025): Available vs. Booked Days
Available Days Distribution
Booked Days Distribution
Booking Pattern Insights for Dunkeld
- The most common availability pattern in Dunkeld falls within the 181-270 days range, representing 51.4% of listings. This suggests many properties have significant open periods on their calendars.
- Approximately 75.7% of listings show high availability (181+ days open annually), indicating potential for increased bookings or specific owner usage patterns.
- For booked days, the 91-180 days range is most frequent in Dunkeld (48.6%), reflecting common guest stay durations or potential owner blocking patterns.
- A notable 27.0% of properties secure long booking periods (181+ days booked per year), highlighting successful long-term rental strategies or significant owner usage.
Dunkeld Airbnb Minimum Stay Requirements Analysis
Distribution of Listings by Minimum Night Requirement
1 Night
8 listings
23.5% of total
2 Nights
20 listings
58.8% of total
3 Nights
1 listings
2.9% of total
30+ Nights
5 listings
14.7% of total
Key Insights
- The most prevalent minimum stay requirement in Dunkeld is 2 Nights, adopted by 58.8% of listings. This highlights the market's preference for shorter, flexible bookings.
- A strong majority (82.3%) of the Dunkeld Airbnb data shows acceptance of very short stays (1-2 nights), indicating a dynamic, high-turnover market.
- A significant segment (14.7%) caters to monthly stays (30+ nights) in Dunkeld, pointing to opportunities in the extended-stay market.
Recommendations
- Align with the market by considering a 2 Nights minimum stay, as 58.8% of Dunkeld hosts use this setting.
- If feasible, allowing 1-night stays, especially midweek or during low season, could capture last-minute bookings, as only 23.5% currently do.
- Explore offering discounts for stays of 30+ nights to attract the 14.7% of the market seeking extended stays.
- Adjust minimum nights based on seasonality – potentially shorter during low season and longer during peak demand periods in Dunkeld.
Dunkeld Airbnb Cancellation Policy Trends Analysis (2025)
Flexible
15 listings
41.7% of total
Moderate
10 listings
27.8% of total
Firm
6 listings
16.7% of total
Strict
5 listings
13.9% of total
Cancellation Policy Insights for Dunkeld
- The prevailing Airbnb cancellation policy trend in Dunkeld is Flexible, used by 41.7% of listings.
- There's a relatively balanced mix between guest-friendly (69.5%) and stricter (30.6%) policies, offering choices for different guest needs.
Recommendations for Hosts
- Consider adopting a Flexible policy to align with the 41.7% market standard in Dunkeld.
- Using a Strict policy might deter some guests, as only 13.9% of listings use it. Evaluate if potential revenue protection outweighs possible lower booking rates.
- Regularly review your cancellation policy against competitors and market demand shifts in Dunkeld.
Dunkeld STR Booking Lead Time Analysis (2025)
Average Booking Lead Time by Month
Booking Lead Time Insights for Dunkeld
- The overall average booking lead time for vacation rentals in Dunkeld is 58 days.
- Guests book furthest in advance for stays during March (average 94 days), likely coinciding with peak travel demand or local events.
- The shortest booking windows occur for stays in January (average 38 days), indicating more last-minute travel plans during this time.
- Seasonally, Spring (77 days avg.) sees the longest lead times, while Summer (57 days avg.) has the shortest, reflecting typical travel planning cycles.
Recommendations for Hosts
- Use the overall average lead time (58 days) as a baseline for your pricing and availability strategy in Dunkeld.
- For March stays, consider implementing length-of-stay discounts or slightly higher rates for bookings made less than 94 days out to capitalize on advance planning.
- Target marketing efforts for the Spring season well in advance (at least 77 days) to capture early planners.
- Monitor your own booking lead times against these Dunkeld averages to identify opportunities for dynamic pricing adjustments.
Popular & Essential Airbnb Amenities in Dunkeld (2025)
Amenity Prevalence
Amenity Insights for Dunkeld
- Essential amenities in Dunkeld that guests expect include: Smoke alarm. Lacking these (this) could significantly impact bookings.
- Popular amenities like Heating, Refrigerator, Hot water are common but not universal. Offering these can provide a competitive edge.
Recommendations for Hosts
- Ensure your listing includes all essential amenities for Dunkeld: Smoke alarm.
- Prioritize adding missing essentials: Smoke alarm.
- Consider adding popular differentiators like Heating or Refrigerator to increase appeal.
- Highlight unique or less common amenities you offer (e.g., hot tub, dedicated workspace, EV charger) in your listing description and photos.
- Regularly check competitor amenities in Dunkeld to stay competitive.
Dunkeld Airbnb Guest Demographics & Profile Analysis (2025)
Guest Profile Summary for Dunkeld
- The typical guest profile for Airbnb in Dunkeld consists of primarily domestic travelers (94%), often arriving from nearby Melbourne, typically belonging to the Post-2000s (Gen Z/Alpha) group (50%), primarily speaking English or Spanish.
- Domestic travelers account for 94.0% of guests.
- Key international markets include Australia (94%) and United States (1.8%).
- Top languages spoken are English (74.3%) followed by Spanish (4.1%).
- A significant demographic segment is the Post-2000s (Gen Z/Alpha) group, representing 50% of guests.
Recommendations for Hosts
- Target domestic marketing efforts towards travelers from Melbourne and Victoria.
- Tailor amenities and listing descriptions to appeal to the dominant Post-2000s (Gen Z/Alpha) demographic (e.g., highlight fast WiFi, smart home features, local guides).
- Highlight unique local experiences or amenities relevant to the primary guest profile.
- Consider seasonal promotions aligned with peak travel times for key origin markets.
Nearby Short-Term Rental Market Comparison
How does the Dunkeld Airbnb market stack up against its neighbors? Compare key performance metrics like average monthly revenue, ADR, and occupancy rates in surrounding areas to understand the broader regional STR landscape.
| Market | Active Properties | Monthly Revenue | Daily Rate | Avg. Occupancy |
|---|---|---|---|---|
| Shire of Colac Otway | 372 | $2,948 | $292.68 | 38% |
| Buninyong | 12 | $2,872 | $169.56 | 48% |
| Lorne | 365 | $2,801 | $395.21 | 33% |
| Port Campbell | 123 | $2,763 | $243.95 | 39% |
| Halls Gap | 184 | $2,669 | $191.17 | 45% |
| Forrest | 31 | $2,567 | $174.06 | 47% |
| Timboon | 16 | $2,525 | $184.54 | 41% |
| Apollo Bay | 412 | $2,511 | $261.55 | 37% |
| Shire of Moyne | 52 | $2,390 | $227.32 | 40% |
| Warrnambool | 263 | $2,281 | $206.62 | 43% |