Creswick Airbnb Market Analysis 2025: Short Term Rental Data & Vacation Rental Statistics in Victoria, Australia
Is Airbnb profitable in Creswick in 2025? Explore comprehensive Airbnb analytics for Creswick, Victoria, Australia to uncover income potential. This 2025 STR market report for Creswick, based on AirROI data from April 2024 to March 2025, reveals key trends in the niche market of 27 active listings.
Whether you're considering an Airbnb investment in Creswick, optimizing your existing vacation rental, or exploring rental arbitrage opportunities, understanding the Creswick Airbnb data is crucial. Leveraging the low regulation environment is key to maximizing your short term rental income potential. Let's dive into the specifics.
Key Creswick Airbnb Performance Metrics Overview
Monthly Airbnb Revenue Variations & Income Potential in Creswick (2025)
Understanding the monthly revenue variations for Airbnb listings in Creswick is key to maximizing your short term rental income potential. Seasonality significantly impacts earnings. Our analysis, based on data from the past 12 months, shows that the peak revenue month for STRs in Creswick is typically April, while February often presents the lowest earnings, highlighting opportunities for strategic pricing adjustments during shoulder and low seasons. Explore the typical Airbnb income in Creswick across different performance tiers:
- Best-in-class properties (Top 10%) achieve $4,752+ monthly, often utilizing dynamic pricing and superior guest experiences.
- Strong performing properties (Top 25%) earn $3,255 or more, indicating effective management and desirable locations/amenities.
- Typical properties (Median) generate around $1,831 per month, representing the average market performance.
- Entry-level properties (Bottom 25%) see earnings around $1,023, often with potential for optimization.
Average Monthly Airbnb Earnings Trend in Creswick
Creswick Airbnb Occupancy Rate Trends (2025)
Maximize your bookings by understanding the Creswick STR occupancy trends. Seasonal demand shifts significantly influence how often properties are booked. Typically, Aprilsees the highest demand (peak season occupancy), while August experiences the lowest (low season). Effective strategies, like adjusting minimum stays or offering promotions, can boost occupancy during slower periods. Here's how different property tiers perform in Creswick:
- Best-in-class properties (Top 10%) achieve 80%+ occupancy, indicating high desirability and potentially optimized availability.
- Strong performing properties (Top 25%) maintain 66% or higher occupancy, suggesting good market fit and guest satisfaction.
- Typical properties (Median) have an occupancy rate around 41%.
- Entry-level properties (Bottom 25%) average 23% occupancy, potentially facing higher vacancy.
Average Monthly Occupancy Rate Trend in Creswick
Average Daily Rate (ADR) Airbnb Trends in Creswick (2025)
Effective short term rental pricing strategy in Creswick involves understanding monthly ADR fluctuations. The Average Daily Rate (ADR) for Airbnb in Creswick typically peaks in December and dips lowest during March. Leveraging Airbnb dynamic pricing tools or strategies based on this seasonality can significantly boost revenue. Here's a look at the typical nightly rates achieved:
- Best-in-class properties (Top 10%) command rates of $217+ per night, often due to premium features or locations.
- Strong performing properties (Top 25%) achieve nightly rates of $185 or more.
- Typical properties (Median) charge around $155 per night.
- Entry-level properties (Bottom 25%) earn around $117 per night.
Average Daily Rate (ADR) Trend by Month in Creswick
Get Live Creswick Market Intelligence 👇

Explore Real-time Analytics
Airbnb Seasonality Analysis & Trends in Creswick (2025)
Peak Season (April, October, May)
- Revenue averages $2,728 per month
- Occupancy rates average 45.7%
- Daily rates average $158
Shoulder Season
- Revenue averages $2,414 per month
- Occupancy maintains around 46.6%
- Daily rates hold near $162
Low Season (February, July, August)
- Revenue drops to average $2,052 per month
- Occupancy decreases to average 40.8%
- Daily rates adjust to average $159
Seasonality Insights for Creswick
- The Airbnb seasonality in Creswick shows moderate seasonality with distinct peak and low periods. While the sections above show seasonal averages, it's also insightful to look at the extremes:
- During the high season, the absolute peak month showcases Creswick's highest earning potential, with monthly revenues capable of climbing to $2,774, occupancy reaching a high of 50.8%, and ADRs peaking at $170.
- Conversely, the slowest single month of the year, typically falling within the low season, marks the market's lowest point. In this month, revenue might dip to $1,879, occupancy could drop to 37.9%, and ADRs may adjust down to $151.
- Understanding both the seasonal averages and these monthly peaks and troughs in revenue, occupancy, and ADR is crucial for maximizing your Airbnb profit potential in Creswick.
Seasonal Strategies for Maximizing Profit
- Peak Season: Maximize revenue through premium pricing and potentially longer minimum stays. Ensure high availability.
- Low Season: Offer competitive pricing, special promotions (e.g., extended stay discounts), and flexible cancellation policies. Target off-season travelers like remote workers or budget-conscious guests.
- Shoulder Seasons: Implement dynamic pricing that balances peak and low rates. Target weekend travelers or specific events. Offer slightly more flexible terms than peak season.
- Regularly analyze your own performance against these Creswick seasonality benchmarks and adjust your pricing and availability strategy accordingly.
Best Areas for Airbnb Investment in Creswick (2025)
Exploring the top neighborhoods for short-term rentals in Creswick? This section highlights key areas, outlining why they are attractive for hosts and guests, along with notable local attractions. Consider these locations based on your target guest profile and investment strategy.
| Neighborhood / Area | Why Host Here? (Target Guests & Appeal) | Key Attractions & Landmarks |
|---|---|---|
| Creswick Town Centre | The heart of Creswick, featuring charming cafes, shops, and a rich local history. It attracts visitors interested in exploring the regional culture of Victoria. | Creswick Woollen Mills, Creswick Neighbourhood House, Creswick Historical Society, local markets, Creswick Golf Course |
| Creswick Regional Park | A nature lover's paradise with walking trails and scenic views, making it a great option for those seeking relaxation and outdoor activities. | Forest trails, Wildlife watching, Picnic areas, Scenic lookouts, Photography opportunities |
| Creswick Mineral Springs | Known for its natural mineral springs, this area attracts visitors looking for wellness and relaxation experiences. | Mineral springs, Spa facilities, Nature walks, Picnic spots, Botanical gardens |
| Creswick Railway Station | An important heritage site that appeals to rail enthusiasts and tourists interested in historical excursions. | Historic train rides, Heritage railway exhibitions, Creswick Station architecture |
| Creswick Cemetery | A site rich in history and heritage, offering a unique perspective on the local history and pioneer stories of the region. | Historical grave sites, Guided tours, Photography, Local history exhibitions |
| Creswick Nature Conservation Reserve | A tranquil area for nature walks and wildlife enthusiasts, popular with visitors looking to connect with nature. | Wildflower trails, Birdwatching, Picnic areas, Educational tours |
| Creswick Kidstown | A family-friendly area with a playground and activities for children, appealing to families visiting the region. | Playground, Family events, Community gatherings, Outdoor games |
| Creswick Arts and Culture Centre | A hub for local artists and cultural events, attracting those interested in the arts and crafts scene. | Art exhibitions, Workshops, Local artisan markets, Cultural performances |
Understanding Airbnb License Requirements & STR Laws in Creswick (2025)
While Creswick, Victoria, Australia currently shows low STR regulations, specific Airbnb license requirements might still exist or change. Always verify the latest short term rental regulations and Airbnb license requirements directly with local government authorities for Creswick to ensure full compliance before hosting.
(Source: AirROI data, 2025, finding no licensed listings among those analyzed)
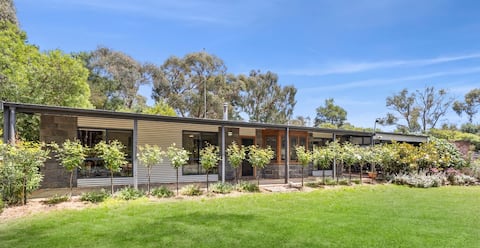
Top Performing Airbnb Properties in Creswick (2025)
Benchmark your potential! Explore examples of top-performing Airbnb properties in Creswickbased on Trailing Twelve Month (TTM) revenue. Analyze their characteristics, revenue, occupancy rate, and ADR to understand what drives success in this market.

Luxury farm stay, stunning views (near Daylesford)
Entire Place • 4 bedrooms

House on the Hill, pet friendly cottage
Entire Place • 3 bedrooms
Secluded Forrest Find
Entire Place • 4 bedrooms
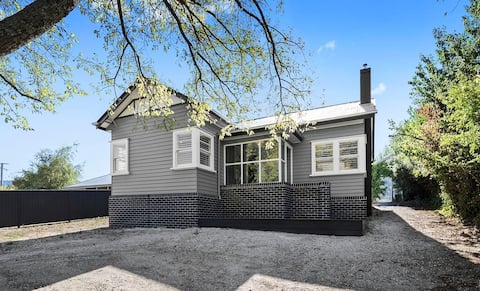
Creswick - Renovated home in the heart of town
Entire Place • 3 bedrooms
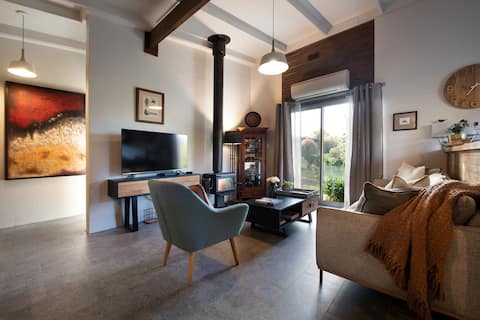
Memphis Cottage Creswick. Pet friendly
Entire Place • 2 bedrooms

Renovated Retreat with outdoor bath (Pet friendly)
Entire Place • 3 bedrooms
Note: Performance varies based on location, size, amenities, seasonality, and management quality. Data reflects the past 12 months.
Top Performing Airbnb Hosts in Creswick (2025)
Learn from the best! This table showcases top-performing Airbnb hosts in Creswick based on the number of properties managed and estimated total revenue over the past year. Analyze their scale and performance metrics.
| Host Name | Properties | Grossing Revenue | Stay Reviews | Avg Rating |
|---|---|---|---|---|
| Sarah | 1 | $101,913 | 85 | 4.99/5.0 |
| Sharon | 2 | $66,496 | 292 | 4.97/5.0 |
| James | 2 | $64,027 | 219 | 4.97/5.0 |
| Lisa | 1 | $42,165 | 13 | 4.69/5.0 |
| Sean | 1 | $38,851 | 105 | 4.92/5.0 |
| Tabitha | 1 | $37,551 | 15 | 4.80/5.0 |
| Marie Therese | 1 | $30,433 | 39 | 4.97/5.0 |
| Marie | 1 | $29,751 | 8 | 4.88/5.0 |
| Chris | 1 | $26,629 | 130 | 4.88/5.0 |
| Kylie | 1 | $24,659 | 81 | 4.98/5.0 |
Analyzing the strategies of top hosts, such as their property selection, pricing, and guest communication, can offer valuable lessons for optimizing your own Airbnb operations in Creswick.
Dive Deeper: Advanced Creswick STR Market Data (2025)
Ready to unlock more insights? AirROI provides access to advanced metrics and comprehensive Airbnb data for Creswick. Explore detailed analytics beyond this report to refine your investment strategy, optimize pricing, and maximize your vacation rental profits.
Explore Advanced MetricsCreswick Short-Term Rental Market Composition (2025): Property & Room Types
Room Type Distribution
Property Type Distribution
Market Composition Insights for Creswick
- The Creswick Airbnb market composition is heavily skewed towards Entire Home/Apt listings, which make up 100% of the 27 active rentals. This indicates strong guest preference for privacy and space.
- Looking at the property type distribution in Creswick, House properties are the most common (88.9%), reflecting the local real estate landscape.
- Houses represent a significant 88.9% portion, catering likely to families or larger groups.
- Smaller segments like others, hotel/boutique, outdoor/unique (combined 11.1%) offer potential for unique stay experiences.
Creswick Airbnb Room Capacity Analysis (2025): Bedroom Distribution
Distribution of Listings by Number of Bedrooms
Room Capacity Insights for Creswick
- The dominant room capacity in Creswick is 3 bedrooms listings, making up 29.6% of the market. This suggests a strong demand for properties suitable for families or small groups.
- Together, 3 bedrooms and 2 bedrooms properties represent 59.2% of the active Airbnb listings in Creswick, indicating a high concentration in these sizes.
- A significant 44.4% of listings offer 3+ bedrooms, catering to larger groups and families seeking more space in Creswick.
Creswick Vacation Rental Guest Capacity Trends (2025)
Distribution of Listings by Guest Capacity
Guest Capacity Insights for Creswick
- The most common guest capacity trend in Creswick vacation rentals is listings accommodating 2 guests (25.9%). This suggests the primary traveler segment is likely couples or solo travelers.
- Properties designed for 2 guests and 4 guests dominate the Creswick STR market, accounting for 51.8% of listings.
- 44.4% of properties accommodate 6+ guests, serving the market segment for larger families or group travel in Creswick.
- On average, properties in Creswick are equipped to host 4.7 guests.
Creswick Airbnb Booking Patterns (2025): Available vs. Booked Days
Available Days Distribution
Booked Days Distribution
Booking Pattern Insights for Creswick
- The most common availability pattern in Creswick falls within the 91-180 days range, representing 44.4% of listings. This suggests many properties have significant open periods on their calendars.
- Approximately 55.5% of listings show high availability (181+ days open annually), indicating potential for increased bookings or specific owner usage patterns.
- For booked days, the 181-270 days range is most frequent in Creswick (51.9%), reflecting common guest stay durations or potential owner blocking patterns.
- A notable 51.9% of properties secure long booking periods (181+ days booked per year), highlighting successful long-term rental strategies or significant owner usage.
Creswick Airbnb Minimum Stay Requirements Analysis
Distribution of Listings by Minimum Night Requirement
1 Night
7 listings
26.9% of total
2 Nights
10 listings
38.5% of total
30+ Nights
9 listings
34.6% of total
Key Insights
- The most prevalent minimum stay requirement in Creswick is 2 Nights, adopted by 38.5% of listings. This highlights the market's preference for shorter, flexible bookings.
- A strong majority (65.4%) of the Creswick Airbnb data shows acceptance of very short stays (1-2 nights), indicating a dynamic, high-turnover market.
- A significant segment (34.6%) caters to monthly stays (30+ nights) in Creswick, pointing to opportunities in the extended-stay market.
Recommendations
- Align with the market by considering a 2 Nights minimum stay, as 38.5% of Creswick hosts use this setting.
- If feasible, allowing 1-night stays, especially midweek or during low season, could capture last-minute bookings, as only 26.9% currently do.
- Explore offering discounts for stays of 30+ nights to attract the 34.6% of the market seeking extended stays.
- Adjust minimum nights based on seasonality – potentially shorter during low season and longer during peak demand periods in Creswick.
Creswick Airbnb Cancellation Policy Trends Analysis (2025)
Flexible
6 listings
24% of total
Moderate
13 listings
52% of total
Firm
2 listings
8% of total
Strict
4 listings
16% of total
Cancellation Policy Insights for Creswick
- The prevailing Airbnb cancellation policy trend in Creswick is Moderate, used by 52% of listings.
- The market strongly favors guest-friendly terms, with 76.0% of listings offering Flexible or Moderate policies. This suggests guests in Creswick may expect booking flexibility.
Recommendations for Hosts
- Consider adopting a Moderate policy to align with the 52% market standard in Creswick.
- Regularly review your cancellation policy against competitors and market demand shifts in Creswick.
Creswick STR Booking Lead Time Analysis (2025)
Average Booking Lead Time by Month
Booking Lead Time Insights for Creswick
- The overall average booking lead time for vacation rentals in Creswick is 46 days.
- Guests book furthest in advance for stays during June (average 88 days), likely coinciding with peak travel demand or local events.
- The shortest booking windows occur for stays in July (average 29 days), indicating more last-minute travel plans during this time.
- Seasonally, Summer (55 days avg.) sees the longest lead times, while Winter (48 days avg.) has the shortest, reflecting typical travel planning cycles.
Recommendations for Hosts
- Use the overall average lead time (46 days) as a baseline for your pricing and availability strategy in Creswick.
- For June stays, consider implementing length-of-stay discounts or slightly higher rates for bookings made less than 88 days out to capitalize on advance planning.
- Target marketing efforts for the Summer season well in advance (at least 55 days) to capture early planners.
- Monitor your own booking lead times against these Creswick averages to identify opportunities for dynamic pricing adjustments.
Popular & Essential Airbnb Amenities in Creswick (2025)
Amenity Prevalence
Amenity Insights for Creswick
- Essential amenities in Creswick that guests expect include: Dishes and silverware, Air conditioning, Heating, Hot water, Smoke alarm, Bed linens, Kitchen. Lacking these (any) could significantly impact bookings.
- Popular amenities like Microwave, Essentials, Free parking on premises are common but not universal. Offering these can provide a competitive edge.
Recommendations for Hosts
- Ensure your listing includes all essential amenities for Creswick: Dishes and silverware, Air conditioning, Heating, Hot water, Smoke alarm, Bed linens, Kitchen.
- Prioritize adding missing essentials: Hot water, Smoke alarm, Bed linens, Kitchen.
- Consider adding popular differentiators like Microwave or Essentials to increase appeal.
- Highlight unique or less common amenities you offer (e.g., hot tub, dedicated workspace, EV charger) in your listing description and photos.
- Regularly check competitor amenities in Creswick to stay competitive.
Creswick Airbnb Guest Demographics & Profile Analysis (2025)
Guest Profile Summary for Creswick
- The typical guest profile for Airbnb in Creswick consists of primarily domestic travelers (96%), often arriving from nearby Melbourne, typically belonging to the Post-2000s (Gen Z/Alpha) group (50%), primarily speaking English or Chinese.
- Domestic travelers account for 95.9% of guests.
- Key international markets include Australia (95.9%) and United States (1%).
- Top languages spoken are English (68.4%) followed by Chinese (6.1%).
- A significant demographic segment is the Post-2000s (Gen Z/Alpha) group, representing 50% of guests.
Recommendations for Hosts
- Target domestic marketing efforts towards travelers from Melbourne and Victoria.
- Tailor amenities and listing descriptions to appeal to the dominant Post-2000s (Gen Z/Alpha) demographic (e.g., highlight fast WiFi, smart home features, local guides).
- Highlight unique local experiences or amenities relevant to the primary guest profile.
- Consider seasonal promotions aligned with peak travel times for key origin markets.
Nearby Short-Term Rental Market Comparison
How does the Creswick Airbnb market stack up against its neighbors? Compare key performance metrics like average monthly revenue, ADR, and occupancy rates in surrounding areas to understand the broader regional STR landscape.
| Market | Active Properties | Monthly Revenue | Daily Rate | Avg. Occupancy |
|---|---|---|---|---|
| Lancefield | 18 | $4,069 | $343.64 | 49% |
| Leopold | 12 | $3,496 | $429.65 | 41% |
| Trentham | 52 | $3,455 | $269.84 | 41% |
| Lyonville | 10 | $3,441 | $349.65 | 35% |
| Shire of Hepburn | 283 | $3,120 | $298.86 | 36% |
| Daylesford | 462 | $3,028 | $297.26 | 35% |
| Moama | 53 | $2,999 | $310.37 | 35% |
| Malmsbury | 11 | $2,957 | $232.06 | 38% |
| Shire of Colac Otway | 372 | $2,948 | $292.68 | 38% |
| Buninyong | 12 | $2,872 | $169.56 | 48% |