City of Greater Bendigo Airbnb Market Analysis 2025: Short Term Rental Data & Vacation Rental Statistics in Victoria, Australia
Is Airbnb profitable in City of Greater Bendigo in 2025? Explore comprehensive Airbnb analytics for City of Greater Bendigo, Victoria, Australia to uncover income potential. This 2025 STR market report for City of Greater Bendigo, based on AirROI data from April 2024 to March 2025, reveals key trends in the niche market of 27 active listings.
Whether you're considering an Airbnb investment in City of Greater Bendigo, optimizing your existing vacation rental, or exploring rental arbitrage opportunities, understanding the City of Greater Bendigo Airbnb data is crucial. Leveraging the low regulation environment is key to maximizing your short term rental income potential. Let's dive into the specifics.
Key City of Greater Bendigo Airbnb Performance Metrics Overview
Monthly Airbnb Revenue Variations & Income Potential in City of Greater Bendigo (2025)
Understanding the monthly revenue variations for Airbnb listings in City of Greater Bendigo is key to maximizing your short term rental income potential. Seasonality significantly impacts earnings. Our analysis, based on data from the past 12 months, shows that the peak revenue month for STRs in City of Greater Bendigo is typically April, while February often presents the lowest earnings, highlighting opportunities for strategic pricing adjustments during shoulder and low seasons. Explore the typical Airbnb income in City of Greater Bendigo across different performance tiers:
- Best-in-class properties (Top 10%) achieve $3,441+ monthly, often utilizing dynamic pricing and superior guest experiences.
- Strong performing properties (Top 25%) earn $2,618 or more, indicating effective management and desirable locations/amenities.
- Typical properties (Median) generate around $1,294 per month, representing the average market performance.
- Entry-level properties (Bottom 25%) see earnings around $590, often with potential for optimization.
Average Monthly Airbnb Earnings Trend in City of Greater Bendigo
City of Greater Bendigo Airbnb Occupancy Rate Trends (2025)
Maximize your bookings by understanding the City of Greater Bendigo STR occupancy trends. Seasonal demand shifts significantly influence how often properties are booked. Typically, Aprilsees the highest demand (peak season occupancy), while February experiences the lowest (low season). Effective strategies, like adjusting minimum stays or offering promotions, can boost occupancy during slower periods. Here's how different property tiers perform in City of Greater Bendigo:
- Best-in-class properties (Top 10%) achieve 80%+ occupancy, indicating high desirability and potentially optimized availability.
- Strong performing properties (Top 25%) maintain 64% or higher occupancy, suggesting good market fit and guest satisfaction.
- Typical properties (Median) have an occupancy rate around 37%.
- Entry-level properties (Bottom 25%) average 20% occupancy, potentially facing higher vacancy.
Average Monthly Occupancy Rate Trend in City of Greater Bendigo
Average Daily Rate (ADR) Airbnb Trends in City of Greater Bendigo (2025)
Effective short term rental pricing strategy in City of Greater Bendigo involves understanding monthly ADR fluctuations. The Average Daily Rate (ADR) for Airbnb in City of Greater Bendigo typically peaks in October and dips lowest during March. Leveraging Airbnb dynamic pricing tools or strategies based on this seasonality can significantly boost revenue. Here's a look at the typical nightly rates achieved:
- Best-in-class properties (Top 10%) command rates of $241+ per night, often due to premium features or locations.
- Strong performing properties (Top 25%) achieve nightly rates of $163 or more.
- Typical properties (Median) charge around $105 per night.
- Entry-level properties (Bottom 25%) earn around $49 per night.
Average Daily Rate (ADR) Trend by Month in City of Greater Bendigo
Get Live City of Greater Bendigo Market Intelligence 👇

Explore Real-time Analytics
Airbnb Seasonality Analysis & Trends in City of Greater Bendigo (2025)
Peak Season (April, December, January)
- Revenue averages $1,986 per month
- Occupancy rates average 46.8%
- Daily rates average $123
Shoulder Season
- Revenue averages $1,621 per month
- Occupancy maintains around 41.1%
- Daily rates hold near $125
Low Season (February, September, November)
- Revenue drops to average $1,434 per month
- Occupancy decreases to average 36.8%
- Daily rates adjust to average $119
Seasonality Insights for City of Greater Bendigo
- The Airbnb seasonality in City of Greater Bendigo shows moderate seasonality with distinct peak and low periods. While the sections above show seasonal averages, it's also insightful to look at the extremes:
- During the high season, the absolute peak month showcases City of Greater Bendigo's highest earning potential, with monthly revenues capable of climbing to $2,209, occupancy reaching a high of 52.4%, and ADRs peaking at $128.
- Conversely, the slowest single month of the year, typically falling within the low season, marks the market's lowest point. In this month, revenue might dip to $1,383, occupancy could drop to 31.3%, and ADRs may adjust down to $113.
- Understanding both the seasonal averages and these monthly peaks and troughs in revenue, occupancy, and ADR is crucial for maximizing your Airbnb profit potential in City of Greater Bendigo.
Seasonal Strategies for Maximizing Profit
- Peak Season: Maximize revenue through premium pricing and potentially longer minimum stays. Ensure high availability.
- Low Season: Offer competitive pricing, special promotions (e.g., extended stay discounts), and flexible cancellation policies. Target off-season travelers like remote workers or budget-conscious guests.
- Shoulder Seasons: Implement dynamic pricing that balances peak and low rates. Target weekend travelers or specific events. Offer slightly more flexible terms than peak season.
- Regularly analyze your own performance against these City of Greater Bendigo seasonality benchmarks and adjust your pricing and availability strategy accordingly.
Best Areas for Airbnb Investment in City of Greater Bendigo (2025)
Exploring the top neighborhoods for short-term rentals in City of Greater Bendigo? This section highlights key areas, outlining why they are attractive for hosts and guests, along with notable local attractions. Consider these locations based on your target guest profile and investment strategy.
| Neighborhood / Area | Why Host Here? (Target Guests & Appeal) | Key Attractions & Landmarks |
|---|---|---|
| Bendigo CBD | The central business district of Bendigo, offering easy access to restaurants, shops, and cultural attractions. A popular choice for visitors looking to explore the city's history and art scene. | Bendigo Art Gallery, Central Deborah Gold Mine, Bendigo Botanic Gardens, The Capital Theatre, Eaglehawk Heritage Museum |
| Strathdale | A residential area with beautiful parks and close proximity to the Bendigo Golf Club. Attractive for families and those seeking a quieter stay while still being close to the city. | Strathdale Park, Bendigo Golf Club, Bendigo Marketplace, All Seasons Resort, Lake Weeroona |
| Eaglehawk | A suburb with historical significance and a blend of residential and rural charm. Offers a unique perspective on Bendigo's gold rush era, appealing to history enthusiasts. | Eaglehawk Heritage Museum, Bendigo Pottery, Bendigo Pre-School Centre, Balgownie Estate Vineyard Resort, Bendigo Dandenong Ranges |
| White Hills | A serene area known for its natural beauty and open spaces, ideal for guests wanting outdoor experiences and close proximity to the city’s amenities. | White Hills Botanic Gardens, Bendigo Bushland Trail, Bendigo Joss House, Bendigo Art Gallery, Ulumbarra Theatre |
| Flora Hill | Home to La Trobe University and nearby parks, this area attracts students and academics, making it a great spot for short-term rentals catering to educational visitors. | La Trobe University, Bendigo Regional Institute of TAFE, Bendigo Cemetery, Bendigo Golf Course, Kennington Reservoir |
| Kangaroo Flat | A growing suburb with a mix of residential and commercial offerings. Easily accessible and appealing to guests looking to explore Bendigo and surrounding areas. | Kangaroo Flat Shopping Centre, Bendigo Racecourse, Bendigo South East College, Bendigo Tree Dojo, Lower California Gully |
| Bendigo East | Close to the city with easy transport links, offering a range of local amenities and a friendly community atmosphere, appealing to both families and visitors. | Bendigo East Primary School, Bendigo Hospital, Bendigo East Shopping Centre, Bendigo Goldfields, White Hills Botanical Gardens |
| Bendigo West | This area features a variety of recreational facilities and parks. Ideal for families and individuals looking for a busy, vibrant neighborhood atmosphere. | Gardiner Reserve, Bendigo Art Gallery, Bendigo Railway Station, Bendigo Sports Stadium, Bendigo Oval |
Understanding Airbnb License Requirements & STR Laws in City of Greater Bendigo (2025)
While City of Greater Bendigo, Victoria, Australia currently shows low STR regulations, specific Airbnb license requirements might still exist or change. Always verify the latest short term rental regulations and Airbnb license requirements directly with local government authorities for City of Greater Bendigo to ensure full compliance before hosting.
(Source: AirROI data, 2025, finding no licensed listings among those analyzed)
Top Performing Airbnb Properties in City of Greater Bendigo (2025)
Benchmark your potential! Explore examples of top-performing Airbnb properties in City of Greater Bendigobased on Trailing Twelve Month (TTM) revenue. Analyze their characteristics, revenue, occupancy rate, and ADR to understand what drives success in this market.
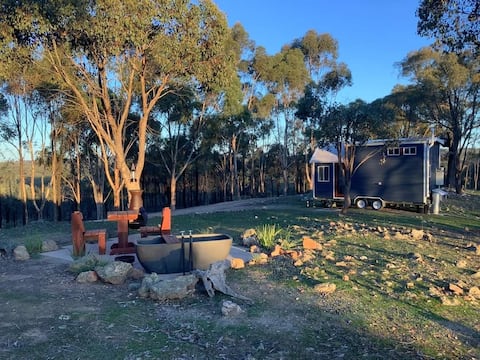
Bushland Tiny Home with Outdoor Hot Tub & Hamper
Entire Place • 1 bedroom

Heathcote Wine Country Retreat~ Mia Mia Vistas 3BR
Entire Place • 3 bedrooms
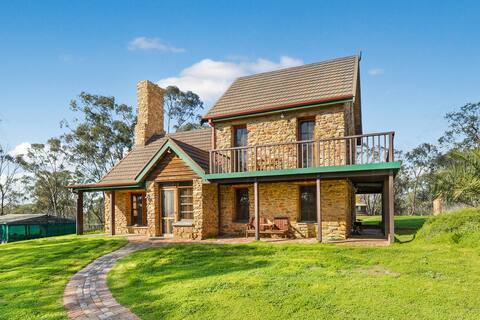
Eppalock Getaway House
Entire Place • 2 bedrooms
Ravenswood Tiny House
Entire Place • 1 bedroom
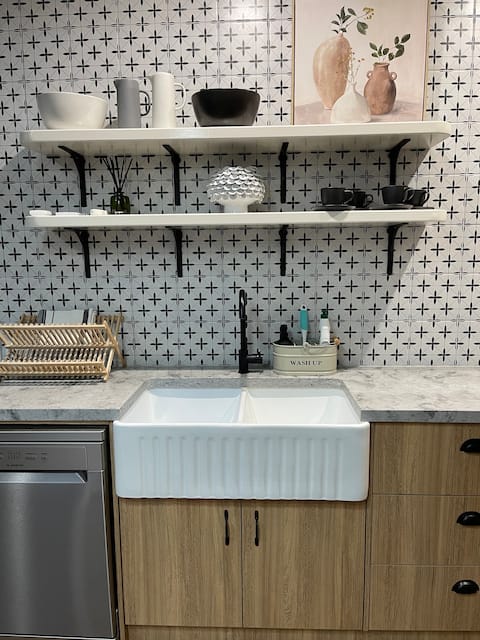
Cool Harcourt shed conversion.
Entire Place • 1 bedroom

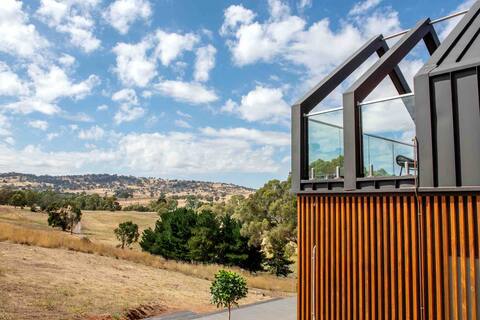
Olive Grove couple's getaway with amazing views
Entire Place • 1 bedroom
Note: Performance varies based on location, size, amenities, seasonality, and management quality. Data reflects the past 12 months.
Top Performing Airbnb Hosts in City of Greater Bendigo (2025)
Learn from the best! This table showcases top-performing Airbnb hosts in City of Greater Bendigo based on the number of properties managed and estimated total revenue over the past year. Analyze their scale and performance metrics.
| Host Name | Properties | Grossing Revenue | Stay Reviews | Avg Rating |
|---|---|---|---|---|
| Victoria | 3 | $62,961 | 71 | 5.00/5.0 |
| Jade | 4 | $50,752 | 144 | 4.89/5.0 |
| Kym And Matt | 1 | $43,371 | 214 | 4.97/5.0 |
| Maree | 1 | $36,483 | 200 | 4.90/5.0 |
| Michelle | 1 | $34,141 | 272 | 4.98/5.0 |
| Jacinta | 1 | $32,868 | 23 | 5.00/5.0 |
| Paul And Janet | 1 | $26,225 | 107 | 4.98/5.0 |
| Leigha | 1 | $19,699 | 57 | 4.77/5.0 |
| Michelle | 1 | $17,700 | 102 | 4.56/5.0 |
| Peter | 1 | $15,077 | 28 | 4.86/5.0 |
Analyzing the strategies of top hosts, such as their property selection, pricing, and guest communication, can offer valuable lessons for optimizing your own Airbnb operations in City of Greater Bendigo.
Dive Deeper: Advanced City of Greater Bendigo STR Market Data (2025)
Ready to unlock more insights? AirROI provides access to advanced metrics and comprehensive Airbnb data for City of Greater Bendigo. Explore detailed analytics beyond this report to refine your investment strategy, optimize pricing, and maximize your vacation rental profits.
Explore Advanced MetricsCity of Greater Bendigo Short-Term Rental Market Composition (2025): Property & Room Types
Room Type Distribution
Property Type Distribution
Market Composition Insights for City of Greater Bendigo
- The City of Greater Bendigo Airbnb market composition is heavily skewed towards Entire Home/Apt listings, which make up 81.5% of the 27 active rentals. This indicates strong guest preference for privacy and space.
- Looking at the property type distribution in City of Greater Bendigo, Outdoor/Unique properties are the most common (48.1%), reflecting the local real estate landscape.
- Houses represent a significant 33.3% portion, catering likely to families or larger groups.
- The presence of 11.1% Hotel/Boutique listings indicates integration with traditional hospitality.
- Smaller segments like others, unique stays (combined 7.4%) offer potential for unique stay experiences.
City of Greater Bendigo Airbnb Room Capacity Analysis (2025): Bedroom Distribution
Distribution of Listings by Number of Bedrooms
Room Capacity Insights for City of Greater Bendigo
- The dominant room capacity in City of Greater Bendigo is 1 bedroom listings, making up 48.1% of the market. This suggests a strong demand for properties suitable for couples or solo travelers.
- Together, 1 bedroom and 2 bedrooms properties represent 66.6% of the active Airbnb listings in City of Greater Bendigo, indicating a high concentration in these sizes.
City of Greater Bendigo Vacation Rental Guest Capacity Trends (2025)
Distribution of Listings by Guest Capacity
Guest Capacity Insights for City of Greater Bendigo
- The most common guest capacity trend in City of Greater Bendigo vacation rentals is listings accommodating 2 guests (33.3%). This suggests the primary traveler segment is likely couples or solo travelers.
- Properties designed for 2 guests and 8+ guests dominate the City of Greater Bendigo STR market, accounting for 51.8% of listings.
- 33.3% of properties accommodate 6+ guests, serving the market segment for larger families or group travel in City of Greater Bendigo.
- On average, properties in City of Greater Bendigo are equipped to host 3.8 guests.
City of Greater Bendigo Airbnb Booking Patterns (2025): Available vs. Booked Days
Available Days Distribution
Booked Days Distribution
Booking Pattern Insights for City of Greater Bendigo
- The most common availability pattern in City of Greater Bendigo falls within the 271-366 days range, representing 48.1% of listings. This suggests many properties have significant open periods on their calendars.
- Approximately 70.3% of listings show high availability (181+ days open annually), indicating potential for increased bookings or specific owner usage patterns.
- For booked days, the 31-90 days range is most frequent in City of Greater Bendigo (37%), reflecting common guest stay durations or potential owner blocking patterns.
- A notable 29.6% of properties secure long booking periods (181+ days booked per year), highlighting successful long-term rental strategies or significant owner usage.
City of Greater Bendigo Airbnb Minimum Stay Requirements Analysis
Distribution of Listings by Minimum Night Requirement
1 Night
10 listings
38.5% of total
2 Nights
8 listings
30.8% of total
3 Nights
2 listings
7.7% of total
4-6 Nights
1 listings
3.8% of total
30+ Nights
5 listings
19.2% of total
Key Insights
- The most prevalent minimum stay requirement in City of Greater Bendigo is 1 Night, adopted by 38.5% of listings. This highlights the market's preference for shorter, flexible bookings.
- A strong majority (69.3%) of the City of Greater Bendigo Airbnb data shows acceptance of very short stays (1-2 nights), indicating a dynamic, high-turnover market.
- A significant segment (19.2%) caters to monthly stays (30+ nights) in City of Greater Bendigo, pointing to opportunities in the extended-stay market.
Recommendations
- Align with the market by considering a 1 Night minimum stay, as 38.5% of City of Greater Bendigo hosts use this setting.
- Explore offering discounts for stays of 30+ nights to attract the 19.2% of the market seeking extended stays.
- Adjust minimum nights based on seasonality – potentially shorter during low season and longer during peak demand periods in City of Greater Bendigo.
City of Greater Bendigo Airbnb Cancellation Policy Trends Analysis (2025)
Flexible
14 listings
58.3% of total
Moderate
4 listings
16.7% of total
Firm
4 listings
16.7% of total
Strict
2 listings
8.3% of total
Cancellation Policy Insights for City of Greater Bendigo
- The prevailing Airbnb cancellation policy trend in City of Greater Bendigo is Flexible, used by 58.3% of listings.
- The market strongly favors guest-friendly terms, with 75.0% of listings offering Flexible or Moderate policies. This suggests guests in City of Greater Bendigo may expect booking flexibility.
- Strict cancellation policies are quite rare (8.3%), potentially making listings with this policy less competitive unless justified by high demand or property type.
Recommendations for Hosts
- Consider adopting a Flexible policy to align with the 58.3% market standard in City of Greater Bendigo.
- Given the high prevalence of Flexible policies (58.3%), offering this can enhance booking appeal, especially during shoulder seasons.
- Using a Strict policy might deter some guests, as only 8.3% of listings use it. Evaluate if potential revenue protection outweighs possible lower booking rates.
- Regularly review your cancellation policy against competitors and market demand shifts in City of Greater Bendigo.
City of Greater Bendigo STR Booking Lead Time Analysis (2025)
Average Booking Lead Time by Month
Booking Lead Time Insights for City of Greater Bendigo
- The overall average booking lead time for vacation rentals in City of Greater Bendigo is 36 days.
- Guests book furthest in advance for stays during April (average 47 days), likely coinciding with peak travel demand or local events.
- The shortest booking windows occur for stays in September (average 26 days), indicating more last-minute travel plans during this time.
- Seasonally, Spring (41 days avg.) sees the longest lead times, while Fall (32 days avg.) has the shortest, reflecting typical travel planning cycles.
Recommendations for Hosts
- Use the overall average lead time (36 days) as a baseline for your pricing and availability strategy in City of Greater Bendigo.
- For April stays, consider implementing length-of-stay discounts or slightly higher rates for bookings made less than 47 days out to capitalize on advance planning.
- Target marketing efforts for the Spring season well in advance (at least 41 days) to capture early planners.
- Monitor your own booking lead times against these City of Greater Bendigo averages to identify opportunities for dynamic pricing adjustments.
Popular & Essential Airbnb Amenities in City of Greater Bendigo (2025)
Amenity Prevalence
Amenity Insights for City of Greater Bendigo
- Essential amenities in City of Greater Bendigo that guests expect include: Free parking on premises. Lacking these (this) could significantly impact bookings.
- Popular amenities like Smoke alarm, Heating, Hot water are common but not universal. Offering these can provide a competitive edge.
Recommendations for Hosts
- Ensure your listing includes all essential amenities for City of Greater Bendigo: Free parking on premises.
- Consider adding popular differentiators like Smoke alarm or Heating to increase appeal.
- Highlight unique or less common amenities you offer (e.g., hot tub, dedicated workspace, EV charger) in your listing description and photos.
- Regularly check competitor amenities in City of Greater Bendigo to stay competitive.
City of Greater Bendigo Airbnb Guest Demographics & Profile Analysis (2025)
Guest Profile Summary for City of Greater Bendigo
- The typical guest profile for Airbnb in City of Greater Bendigo consists of primarily domestic travelers (96%), often arriving from nearby Melbourne, typically belonging to the Post-2000s (Gen Z/Alpha) group (50%), primarily speaking English or French.
- Domestic travelers account for 96.0% of guests.
- Key international markets include Australia (96%) and United Kingdom (1.8%).
- Top languages spoken are English (68.8%) followed by French (8.3%).
- A significant demographic segment is the Post-2000s (Gen Z/Alpha) group, representing 50% of guests.
Recommendations for Hosts
- Target domestic marketing efforts towards travelers from Melbourne and Victoria.
- Tailor amenities and listing descriptions to appeal to the dominant Post-2000s (Gen Z/Alpha) demographic (e.g., highlight fast WiFi, smart home features, local guides).
- Highlight unique local experiences or amenities relevant to the primary guest profile.
- Consider seasonal promotions aligned with peak travel times for key origin markets.
Nearby Short-Term Rental Market Comparison
How does the City of Greater Bendigo Airbnb market stack up against its neighbors? Compare key performance metrics like average monthly revenue, ADR, and occupancy rates in surrounding areas to understand the broader regional STR landscape.
| Market | Active Properties | Monthly Revenue | Daily Rate | Avg. Occupancy |
|---|---|---|---|---|
| Lancefield | 18 | $4,069 | $343.64 | 49% |
| Trentham | 52 | $3,455 | $269.84 | 41% |
| Lyonville | 10 | $3,441 | $349.65 | 35% |
| Nagambie | 33 | $3,381 | $300.42 | 40% |
| Shire of Strathbogie | 43 | $3,173 | $314.72 | 37% |
| Shire of Hepburn | 283 | $3,120 | $298.86 | 36% |
| Shire of Murrindindi | 70 | $3,061 | $268.84 | 40% |
| Daylesford | 462 | $3,028 | $297.26 | 35% |
| Moama | 53 | $2,999 | $310.37 | 35% |
| Malmsbury | 11 | $2,957 | $232.06 | 38% |