Borough of Queenscliffe Airbnb Market Analysis 2025: Short Term Rental Data & Vacation Rental Statistics in Victoria, Australia
Is Airbnb profitable in Borough of Queenscliffe in 2025? Explore comprehensive Airbnb analytics for Borough of Queenscliffe, Victoria, Australia to uncover income potential. This 2025 STR market report for Borough of Queenscliffe, based on AirROI data from April 2024 to March 2025, reveals key trends in the niche market of 94 active listings.
Whether you're considering an Airbnb investment in Borough of Queenscliffe, optimizing your existing vacation rental, or exploring rental arbitrage opportunities, understanding the Borough of Queenscliffe Airbnb data is crucial. Leveraging the low regulation environment is key to maximizing your short term rental income potential. Let's dive into the specifics.
Key Borough of Queenscliffe Airbnb Performance Metrics Overview
Monthly Airbnb Revenue Variations & Income Potential in Borough of Queenscliffe (2025)
Understanding the monthly revenue variations for Airbnb listings in Borough of Queenscliffe is key to maximizing your short term rental income potential. Seasonality significantly impacts earnings. Our analysis, based on data from the past 12 months, shows that the peak revenue month for STRs in Borough of Queenscliffe is typically January, while July often presents the lowest earnings, highlighting opportunities for strategic pricing adjustments during shoulder and low seasons. Explore the typical Airbnb income in Borough of Queenscliffe across different performance tiers:
- Best-in-class properties (Top 10%) achieve $5,839+ monthly, often utilizing dynamic pricing and superior guest experiences.
- Strong performing properties (Top 25%) earn $3,707 or more, indicating effective management and desirable locations/amenities.
- Typical properties (Median) generate around $2,105 per month, representing the average market performance.
- Entry-level properties (Bottom 25%) see earnings around $999, often with potential for optimization.
Average Monthly Airbnb Earnings Trend in Borough of Queenscliffe
Borough of Queenscliffe Airbnb Occupancy Rate Trends (2025)
Maximize your bookings by understanding the Borough of Queenscliffe STR occupancy trends. Seasonal demand shifts significantly influence how often properties are booked. Typically, Januarysees the highest demand (peak season occupancy), while May experiences the lowest (low season). Effective strategies, like adjusting minimum stays or offering promotions, can boost occupancy during slower periods. Here's how different property tiers perform in Borough of Queenscliffe:
- Best-in-class properties (Top 10%) achieve 65%+ occupancy, indicating high desirability and potentially optimized availability.
- Strong performing properties (Top 25%) maintain 44% or higher occupancy, suggesting good market fit and guest satisfaction.
- Typical properties (Median) have an occupancy rate around 26%.
- Entry-level properties (Bottom 25%) average 11% occupancy, potentially facing higher vacancy.
Average Monthly Occupancy Rate Trend in Borough of Queenscliffe
Average Daily Rate (ADR) Airbnb Trends in Borough of Queenscliffe (2025)
Effective short term rental pricing strategy in Borough of Queenscliffe involves understanding monthly ADR fluctuations. The Average Daily Rate (ADR) for Airbnb in Borough of Queenscliffe typically peaks in January and dips lowest during March. Leveraging Airbnb dynamic pricing tools or strategies based on this seasonality can significantly boost revenue. Here's a look at the typical nightly rates achieved:
- Best-in-class properties (Top 10%) command rates of $465+ per night, often due to premium features or locations.
- Strong performing properties (Top 25%) achieve nightly rates of $369 or more.
- Typical properties (Median) charge around $291 per night.
- Entry-level properties (Bottom 25%) earn around $217 per night.
Average Daily Rate (ADR) Trend by Month in Borough of Queenscliffe
Get Live Borough of Queenscliffe Market Intelligence 👇

Explore Real-time Analytics
Airbnb Seasonality Analysis & Trends in Borough of Queenscliffe (2025)
Peak Season (January, December, April)
- Revenue averages $3,822 per month
- Occupancy rates average 39.0%
- Daily rates average $318
Shoulder Season
- Revenue averages $2,580 per month
- Occupancy maintains around 29.1%
- Daily rates hold near $308
Low Season (July, August, September)
- Revenue drops to average $1,846 per month
- Occupancy decreases to average 24.1%
- Daily rates adjust to average $309
Seasonality Insights for Borough of Queenscliffe
- The Airbnb seasonality in Borough of Queenscliffe shows highly seasonal trends requiring careful strategy. While the sections above show seasonal averages, it's also insightful to look at the extremes:
- During the high season, the absolute peak month showcases Borough of Queenscliffe's highest earning potential, with monthly revenues capable of climbing to $5,094, occupancy reaching a high of 49.4%, and ADRs peaking at $331.
- Conversely, the slowest single month of the year, typically falling within the low season, marks the market's lowest point. In this month, revenue might dip to $1,792, occupancy could drop to 21.4%, and ADRs may adjust down to $298.
- Understanding both the seasonal averages and these monthly peaks and troughs in revenue, occupancy, and ADR is crucial for maximizing your Airbnb profit potential in Borough of Queenscliffe.
Seasonal Strategies for Maximizing Profit
- Peak Season: Maximize revenue through premium pricing and potentially longer minimum stays. Ensure high availability.
- Low Season: Offer competitive pricing, special promotions (e.g., extended stay discounts), and flexible cancellation policies. Target off-season travelers like remote workers or budget-conscious guests.
- Shoulder Seasons: Implement dynamic pricing that balances peak and low rates. Target weekend travelers or specific events. Offer slightly more flexible terms than peak season.
- Regularly analyze your own performance against these Borough of Queenscliffe seasonality benchmarks and adjust your pricing and availability strategy accordingly.
Best Areas for Airbnb Investment in Borough of Queenscliffe (2025)
Exploring the top neighborhoods for short-term rentals in Borough of Queenscliffe? This section highlights key areas, outlining why they are attractive for hosts and guests, along with notable local attractions. Consider these locations based on your target guest profile and investment strategy.
| Neighborhood / Area | Why Host Here? (Target Guests & Appeal) | Key Attractions & Landmarks |
|---|---|---|
| Point Lonsdale | Charming coastal village perfect for beach lovers and families, with stunning views of the ocean and close proximity to the iconic Point Lonsdale Beach. | Point Lonsdale Beach, Point Lonsdale Lighthouse, Marine and Freshwater Discovery Centre, Queenscliffe Historical Museum, Rip View Lookout |
| Queenscliff | Historic seaside town with a rich maritime history, appealing to tourists for its beautiful waterfront and ferry service to Sorrento. | Queenscliff Harbour, Fort Queenscliff, Queenscliff Historical Museum, Emerald Hill Lighthouse, Queenscliff Jetty |
| Sorrento | Popular summer destination known for its stunning beaches and upscale boutiques, ideal for those looking for a luxurious escape from the city. | Sorrento Beach, Sorrento Main Street, London Bridge, Point Nepean National Park, Sorrento Historic Walk |
| Ocean Grove | Family-friendly beach town with a laid-back vibe, perfect for summer getaways and outdoor activities. | Ocean Grove Beach, Collendina Beach, Ocean Grove Nature Reserve, Grove Beach, Ocean Grove Golf Club |
| Barwon Heads | Scenic coastal town with a relaxed atmosphere, drawing visitors with its beautiful beaches and boutique shops. | Barwon Heads River, Main Beach, Barwon Heads Golf Club, Thomson River Cruises, Barwon Heads Village |
| Portarlington | Serene coastal town known for its wineries and seafood, attractive to visitors looking for a relaxful retreat and wine tasting experiences. | Portarlington Beach, Portarlington Pier, Portarlington Mussel Festival, Point Richards Coastal Reserve, Kurtz Fisheries |
| Drysdale | Growing suburb with local wineries and close proximity to both the beach and the Bellarine Rail Trail, appealing to outdoor enthusiasts. | Drysdale Railway Station, Gordon Park, Bellarine Railway, McLeod's Waterholes, local wineries |
| Indented Head | Quiet and picturesque coastline, great for those who enjoy water activities and peaceful surroundings. | Indented Head Beach, Jetty at Indented Head, Walking trails, Wildlife spotting, Local bushland |
Understanding Airbnb License Requirements & STR Laws in Borough of Queenscliffe (2025)
While Borough of Queenscliffe, Victoria, Australia currently shows low STR regulations, specific Airbnb license requirements might still exist or change. Always verify the latest short term rental regulations and Airbnb license requirements directly with local government authorities for Borough of Queenscliffe to ensure full compliance before hosting.
(Source: AirROI data, 2025, finding no licensed listings among those analyzed)
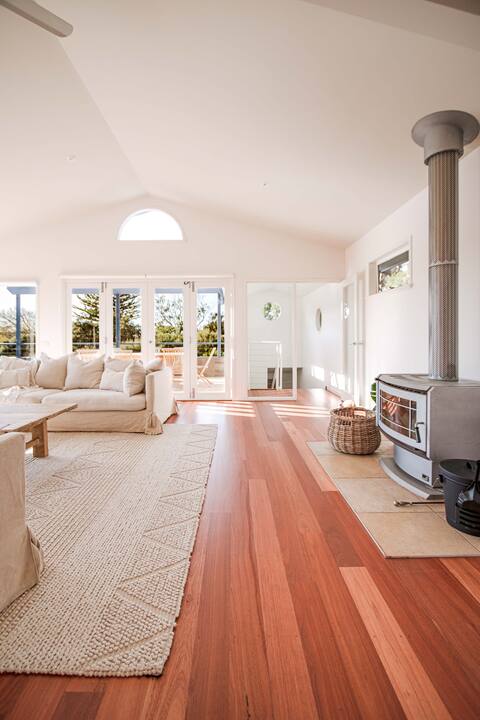
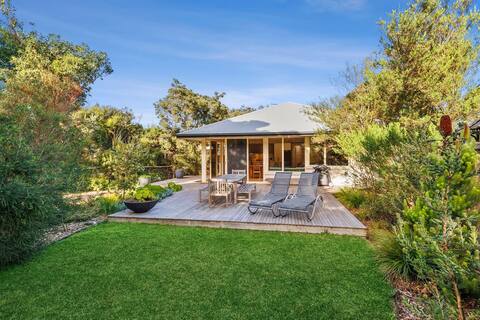
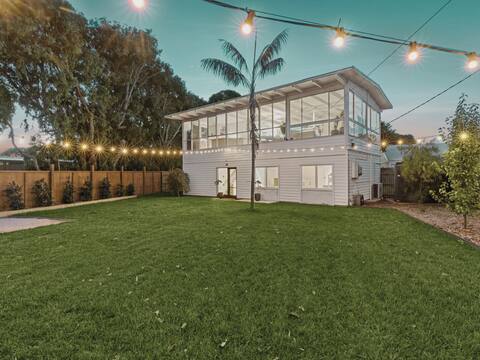
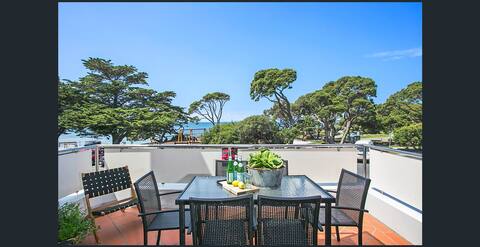
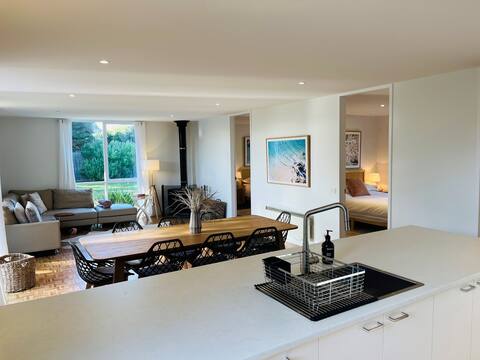
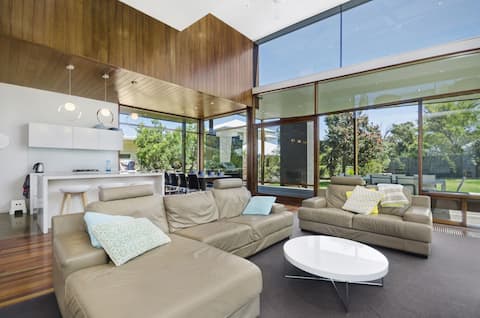
Top Performing Airbnb Properties in Borough of Queenscliffe (2025)
Benchmark your potential! Explore examples of top-performing Airbnb properties in Borough of Queenscliffebased on Trailing Twelve Month (TTM) revenue. Analyze their characteristics, revenue, occupancy rate, and ADR to understand what drives success in this market.
Steps to beach & shops | Pt Lonsdale | 4 bedrooms
Entire Place • 4 bedrooms
Alexander in Old Lonnie
Entire Place • 4 bedrooms
Springs at Lonsdale
Entire Place • 5 bedrooms
Lonnie Beach View Apartment
Entire Place • 2 bedrooms
Sara by the Sea
Entire Place • 4 bedrooms
Glaneuse Getaway
Entire Place • 5 bedrooms
Note: Performance varies based on location, size, amenities, seasonality, and management quality. Data reflects the past 12 months.
Top Performing Airbnb Hosts in Borough of Queenscliffe (2025)
Learn from the best! This table showcases top-performing Airbnb hosts in Borough of Queenscliffe based on the number of properties managed and estimated total revenue over the past year. Analyze their scale and performance metrics.
| Host Name | Properties | Grossing Revenue | Stay Reviews | Avg Rating |
|---|---|---|---|---|
| Kerleys Coastal Holidays | 39 | $650,284 | 428 | 2.29/5.0 |
| Queenscliff And Coastal | 15 | $326,411 | 108 | 3.73/5.0 |
| Richard | 3 | $92,001 | 91 | 4.94/5.0 |
| Kate | 1 | $66,465 | 59 | 4.93/5.0 |
| Georgia | 1 | $57,223 | 4 | 5.00/5.0 |
| Claudia | 1 | $50,920 | 38 | 4.95/5.0 |
| Sarah | 1 | $49,278 | 9 | 5.00/5.0 |
| Sarah | 1 | $47,943 | 19 | 4.89/5.0 |
| John & Suzy | 1 | $44,014 | 391 | 4.95/5.0 |
| Julia And Marcus | 1 | $40,860 | 53 | 4.91/5.0 |
Analyzing the strategies of top hosts, such as their property selection, pricing, and guest communication, can offer valuable lessons for optimizing your own Airbnb operations in Borough of Queenscliffe.
Dive Deeper: Advanced Borough of Queenscliffe STR Market Data (2025)
Ready to unlock more insights? AirROI provides access to advanced metrics and comprehensive Airbnb data for Borough of Queenscliffe. Explore detailed analytics beyond this report to refine your investment strategy, optimize pricing, and maximize your vacation rental profits.
Explore Advanced MetricsBorough of Queenscliffe Short-Term Rental Market Composition (2025): Property & Room Types
Room Type Distribution
Property Type Distribution
Market Composition Insights for Borough of Queenscliffe
- The Borough of Queenscliffe Airbnb market composition is heavily skewed towards Entire Home/Apt listings, which make up 97.9% of the 94 active rentals. This indicates strong guest preference for privacy and space.
- Looking at the property type distribution in Borough of Queenscliffe, House properties are the most common (86.2%), reflecting the local real estate landscape.
- Houses represent a significant 86.2% portion, catering likely to families or larger groups.
- Smaller segments like hotel/boutique (combined 2.1%) offer potential for unique stay experiences.
Borough of Queenscliffe Airbnb Room Capacity Analysis (2025): Bedroom Distribution
Distribution of Listings by Number of Bedrooms
Room Capacity Insights for Borough of Queenscliffe
- The dominant room capacity in Borough of Queenscliffe is 3 bedrooms listings, making up 41.5% of the market. This suggests a strong demand for properties suitable for families or small groups.
- Together, 3 bedrooms and 4 bedrooms properties represent 70.2% of the active Airbnb listings in Borough of Queenscliffe, indicating a high concentration in these sizes.
- A significant 78.7% of listings offer 3+ bedrooms, catering to larger groups and families seeking more space in Borough of Queenscliffe.
Borough of Queenscliffe Vacation Rental Guest Capacity Trends (2025)
Distribution of Listings by Guest Capacity
Guest Capacity Insights for Borough of Queenscliffe
- The most common guest capacity trend in Borough of Queenscliffe vacation rentals is listings accommodating 8+ guests (51.1%). This suggests the primary traveler segment is likely larger groups.
- Properties designed for 8+ guests and 6 guests dominate the Borough of Queenscliffe STR market, accounting for 72.4% of listings.
- 80.9% of properties accommodate 6+ guests, serving the market segment for larger families or group travel in Borough of Queenscliffe.
- On average, properties in Borough of Queenscliffe are equipped to host 6.6 guests.
Borough of Queenscliffe Airbnb Booking Patterns (2025): Available vs. Booked Days
Available Days Distribution
Booked Days Distribution
Booking Pattern Insights for Borough of Queenscliffe
- The most common availability pattern in Borough of Queenscliffe falls within the 271-366 days range, representing 71.3% of listings. This suggests many properties have significant open periods on their calendars.
- Approximately 92.6% of listings show high availability (181+ days open annually), indicating potential for increased bookings or specific owner usage patterns.
- For booked days, the 31-90 days range is most frequent in Borough of Queenscliffe (40.4%), reflecting common guest stay durations or potential owner blocking patterns.
- A notable 8.5% of properties secure long booking periods (181+ days booked per year), highlighting successful long-term rental strategies or significant owner usage.
Borough of Queenscliffe Airbnb Minimum Stay Requirements Analysis
Distribution of Listings by Minimum Night Requirement
2 Nights
21 listings
23.9% of total
3 Nights
16 listings
18.2% of total
4-6 Nights
10 listings
11.4% of total
30+ Nights
41 listings
46.6% of total
Key Insights
- The most prevalent minimum stay requirement in Borough of Queenscliffe is 30+ Nights, adopted by 46.6% of listings. This highlights the market's preference for longer commitments.
- A significant segment (46.6%) caters to monthly stays (30+ nights) in Borough of Queenscliffe, pointing to opportunities in the extended-stay market.
Recommendations
- Align with the market by considering a 30+ Nights minimum stay, as 46.6% of Borough of Queenscliffe hosts use this setting.
- Explore offering discounts for stays of 30+ nights to attract the 46.6% of the market seeking extended stays.
- Adjust minimum nights based on seasonality – potentially shorter during low season and longer during peak demand periods in Borough of Queenscliffe.
Borough of Queenscliffe Airbnb Cancellation Policy Trends Analysis (2025)
Flexible
5 listings
7.7% of total
Moderate
11 listings
16.9% of total
Firm
28 listings
43.1% of total
Strict
21 listings
32.3% of total
Cancellation Policy Insights for Borough of Queenscliffe
- The prevailing Airbnb cancellation policy trend in Borough of Queenscliffe is Firm, used by 43.1% of listings.
- A majority (75.4%) of hosts in Borough of Queenscliffe utilize Firm or Strict policies, indicating a market where hosts prioritize booking security.
Recommendations for Hosts
- Consider adopting a Firm policy to align with the 43.1% market standard in Borough of Queenscliffe.
- With 32.3% using Strict terms, this is a viable option in Borough of Queenscliffe, particularly for high-value properties or during peak demand periods.
- Regularly review your cancellation policy against competitors and market demand shifts in Borough of Queenscliffe.
Borough of Queenscliffe STR Booking Lead Time Analysis (2025)
Average Booking Lead Time by Month
Booking Lead Time Insights for Borough of Queenscliffe
- The overall average booking lead time for vacation rentals in Borough of Queenscliffe is 68 days.
- Guests book furthest in advance for stays during January (average 131 days), likely coinciding with peak travel demand or local events.
- The shortest booking windows occur for stays in July (average 34 days), indicating more last-minute travel plans during this time.
- Seasonally, Winter (101 days avg.) sees the longest lead times, while Summer (45 days avg.) has the shortest, reflecting typical travel planning cycles.
Recommendations for Hosts
- Use the overall average lead time (68 days) as a baseline for your pricing and availability strategy in Borough of Queenscliffe.
- For January stays, consider implementing length-of-stay discounts or slightly higher rates for bookings made less than 131 days out to capitalize on advance planning.
- Target marketing efforts for the Winter season well in advance (at least 101 days) to capture early planners.
- Monitor your own booking lead times against these Borough of Queenscliffe averages to identify opportunities for dynamic pricing adjustments.
Popular & Essential Airbnb Amenities in Borough of Queenscliffe (2025)
Amenity Prevalence
Amenity Insights for Borough of Queenscliffe
- Essential amenities in Borough of Queenscliffe that guests expect include: Heating, Washer, Kitchen, TV, Smoke alarm, Air conditioning. Lacking these (any) could significantly impact bookings.
- Popular amenities like Refrigerator, Microwave, Iron are common but not universal. Offering these can provide a competitive edge.
Recommendations for Hosts
- Ensure your listing includes all essential amenities for Borough of Queenscliffe: Heating, Washer, Kitchen, TV, Smoke alarm, Air conditioning.
- Prioritize adding missing essentials: Heating, Washer, Kitchen, TV, Smoke alarm, Air conditioning.
- Consider adding popular differentiators like Refrigerator or Microwave to increase appeal.
- Highlight unique or less common amenities you offer (e.g., hot tub, dedicated workspace, EV charger) in your listing description and photos.
- Regularly check competitor amenities in Borough of Queenscliffe to stay competitive.
Borough of Queenscliffe Airbnb Guest Demographics & Profile Analysis (2025)
Guest Profile Summary for Borough of Queenscliffe
- The typical guest profile for Airbnb in Borough of Queenscliffe consists of primarily domestic travelers (95%), often arriving from nearby Melbourne, typically belonging to the Post-2000s (Gen Z/Alpha) group (50%), primarily speaking English or Spanish.
- Domestic travelers account for 95.4% of guests.
- Key international markets include Australia (95.4%) and United Kingdom (1.5%).
- Top languages spoken are English (78.3%) followed by Spanish (3.6%).
- A significant demographic segment is the Post-2000s (Gen Z/Alpha) group, representing 50% of guests.
Recommendations for Hosts
- Target domestic marketing efforts towards travelers from Melbourne and Victoria.
- Tailor amenities and listing descriptions to appeal to the dominant Post-2000s (Gen Z/Alpha) demographic (e.g., highlight fast WiFi, smart home features, local guides).
- Highlight unique local experiences or amenities relevant to the primary guest profile.
- Consider seasonal promotions aligned with peak travel times for key origin markets.
Nearby Short-Term Rental Market Comparison
How does the Borough of Queenscliffe Airbnb market stack up against its neighbors? Compare key performance metrics like average monthly revenue, ADR, and occupancy rates in surrounding areas to understand the broader regional STR landscape.
| Market | Active Properties | Monthly Revenue | Daily Rate | Avg. Occupancy |
|---|---|---|---|---|
| King Island Council | 11 | $5,231 | $550.50 | 37% |
| Lancefield | 18 | $4,069 | $343.64 | 49% |
| Leopold | 12 | $3,496 | $429.65 | 41% |
| Trentham | 52 | $3,455 | $269.84 | 41% |
| Lyonville | 10 | $3,441 | $349.65 | 35% |
| Shire of Hepburn | 283 | $3,120 | $298.86 | 36% |
| Shire of Murrindindi | 70 | $3,061 | $268.84 | 40% |
| Daylesford | 462 | $3,028 | $297.26 | 35% |
| San Remo | 82 | $2,997 | $299.99 | 36% |
| Malmsbury | 11 | $2,957 | $232.06 | 38% |