Alpine Shire Airbnb Market Analysis 2025: Short Term Rental Data & Vacation Rental Statistics in Victoria, Australia
Is Airbnb profitable in Alpine Shire in 2025? Explore comprehensive Airbnb analytics for Alpine Shire, Victoria, Australia to uncover income potential. This 2025 STR market report for Alpine Shire, based on AirROI data from April 2024 to March 2025, reveals key trends in the niche market of 79 active listings.
Whether you're considering an Airbnb investment in Alpine Shire, optimizing your existing vacation rental, or exploring rental arbitrage opportunities, understanding the Alpine Shire Airbnb data is crucial. Leveraging the low regulation environment is key to maximizing your short term rental income potential. Let's dive into the specifics.
Key Alpine Shire Airbnb Performance Metrics Overview
Monthly Airbnb Revenue Variations & Income Potential in Alpine Shire (2025)
Understanding the monthly revenue variations for Airbnb listings in Alpine Shire is key to maximizing your short term rental income potential. Seasonality significantly impacts earnings. Our analysis, based on data from the past 12 months, shows that the peak revenue month for STRs in Alpine Shire is typically July, while February often presents the lowest earnings, highlighting opportunities for strategic pricing adjustments during shoulder and low seasons. Explore the typical Airbnb income in Alpine Shire across different performance tiers:
- Best-in-class properties (Top 10%) achieve $6,522+ monthly, often utilizing dynamic pricing and superior guest experiences.
- Strong performing properties (Top 25%) earn $4,178 or more, indicating effective management and desirable locations/amenities.
- Typical properties (Median) generate around $2,564 per month, representing the average market performance.
- Entry-level properties (Bottom 25%) see earnings around $1,199, often with potential for optimization.
Average Monthly Airbnb Earnings Trend in Alpine Shire
Alpine Shire Airbnb Occupancy Rate Trends (2025)
Maximize your bookings by understanding the Alpine Shire STR occupancy trends. Seasonal demand shifts significantly influence how often properties are booked. Typically, Julysees the highest demand (peak season occupancy), while February experiences the lowest (low season). Effective strategies, like adjusting minimum stays or offering promotions, can boost occupancy during slower periods. Here's how different property tiers perform in Alpine Shire:
- Best-in-class properties (Top 10%) achieve 70%+ occupancy, indicating high desirability and potentially optimized availability.
- Strong performing properties (Top 25%) maintain 55% or higher occupancy, suggesting good market fit and guest satisfaction.
- Typical properties (Median) have an occupancy rate around 35%.
- Entry-level properties (Bottom 25%) average 17% occupancy, potentially facing higher vacancy.
Average Monthly Occupancy Rate Trend in Alpine Shire
Average Daily Rate (ADR) Airbnb Trends in Alpine Shire (2025)
Effective short term rental pricing strategy in Alpine Shire involves understanding monthly ADR fluctuations. The Average Daily Rate (ADR) for Airbnb in Alpine Shire typically peaks in August and dips lowest during March. Leveraging Airbnb dynamic pricing tools or strategies based on this seasonality can significantly boost revenue. Here's a look at the typical nightly rates achieved:
- Best-in-class properties (Top 10%) command rates of $598+ per night, often due to premium features or locations.
- Strong performing properties (Top 25%) achieve nightly rates of $314 or more.
- Typical properties (Median) charge around $224 per night.
- Entry-level properties (Bottom 25%) earn around $150 per night.
Average Daily Rate (ADR) Trend by Month in Alpine Shire
Get Live Alpine Shire Market Intelligence 👇

Explore Real-time Analytics
Airbnb Seasonality Analysis & Trends in Alpine Shire (2025)
Peak Season (July, August, June)
- Revenue averages $4,142 per month
- Occupancy rates average 43.1%
- Daily rates average $353
Shoulder Season
- Revenue averages $3,303 per month
- Occupancy maintains around 37.9%
- Daily rates hold near $306
Low Season (February, March, October)
- Revenue drops to average $2,459 per month
- Occupancy decreases to average 32.8%
- Daily rates adjust to average $287
Seasonality Insights for Alpine Shire
- The Airbnb seasonality in Alpine Shire shows highly seasonal trends requiring careful strategy. While the sections above show seasonal averages, it's also insightful to look at the extremes:
- During the high season, the absolute peak month showcases Alpine Shire's highest earning potential, with monthly revenues capable of climbing to $4,806, occupancy reaching a high of 54.5%, and ADRs peaking at $357.
- Conversely, the slowest single month of the year, typically falling within the low season, marks the market's lowest point. In this month, revenue might dip to $2,074, occupancy could drop to 28.8%, and ADRs may adjust down to $262.
- Understanding both the seasonal averages and these monthly peaks and troughs in revenue, occupancy, and ADR is crucial for maximizing your Airbnb profit potential in Alpine Shire.
Seasonal Strategies for Maximizing Profit
- Peak Season: Maximize revenue through premium pricing and potentially longer minimum stays. Ensure high availability.
- Low Season: Offer competitive pricing, special promotions (e.g., extended stay discounts), and flexible cancellation policies. Target off-season travelers like remote workers or budget-conscious guests.
- Shoulder Seasons: Implement dynamic pricing that balances peak and low rates. Target weekend travelers or specific events. Offer slightly more flexible terms than peak season.
- Regularly analyze your own performance against these Alpine Shire seasonality benchmarks and adjust your pricing and availability strategy accordingly.
Best Areas for Airbnb Investment in Alpine Shire (2025)
Exploring the top neighborhoods for short-term rentals in Alpine Shire? This section highlights key areas, outlining why they are attractive for hosts and guests, along with notable local attractions. Consider these locations based on your target guest profile and investment strategy.
| Neighborhood / Area | Why Host Here? (Target Guests & Appeal) | Key Attractions & Landmarks |
|---|---|---|
| Bright | A picturesque town known for its stunning mountainous scenery and outdoor activities. It is a popular destination for skiing and snowboarding in winter, and hiking and cycling in summer, attracting both adventure seekers and families. | Mount Hotham, Bright Brewery, Canyon Walk, Bright Splash Park, Morses Creek Walking Track |
| Mount Hotham | A renowned ski resort that draws winter sports enthusiasts. The area offers breathtaking alpine views and a chance to experience the thrill of skiing and snowboarding, making it a prime spot for wintertime visitors. | Mount Hotham Ski Resort, Dinner Plain, The Summit, Explore the Alpine National Park |
| Porepunkah | Located near Bright, Porepunkah offers a tranquil atmosphere and is perfect for those wanting to escape the city. It has close proximity to hiking trails and the Ovens River, appealing to nature lovers and families. | Ovens River, Mt Buffalo National Park, Porepunkah Wineries, Porepunkah History Walk |
| Harrietville | A quaint village at the foothills of Mount Hotham, known for its natural beauty and history. The area is famous for its berry farms and scenic views, making it a family-friendly destination. | Harrietville Berry Farm, Mount Hotham Winery, Feathertop Walking Track, Alpine Hotel Harrietville |
| Brighton | Despite being mainly a residential area, Brighton sees a steady flow of visitors due to its beach atmosphere and proximity to Melbourne. It's popular with those looking for coastal experiences and urban amenities. | Brighton Beach, Brighton Baths, Dendy Street Beach, Kahuna Brighton |
| Myrtleford | Known for its agricultural richness and close proximity to various natural attractions. Myrtleford is a great insight into the region’s history and offers a base for various outdoor activities. | Myrtleford Butter Factory, Ovens River Rail Trail, Myrtleford Historical Precinct, Pinnacle Lookout |
| Wandiligong | A charming small community featuring beautiful landscapes and historic sites. It provides easy access to a variety of outdoor activities, making it popular among those who enjoy exploring alpine regions. | Wandiligong Tunnel, Wandiligong Maze, Bicycle path to Bright |
| Lake Buffalo | A stunning lake surrounded by nature, providing ample opportunities for fishing, boating, and picnicking. It is suitable for families and those looking for water activities in a serene environment. | Lake Buffalo, Buffalo River, Buffalo Dam, Mountain biking tracks |
Understanding Airbnb License Requirements & STR Laws in Alpine Shire (2025)
While Alpine Shire, Victoria, Australia currently shows low STR regulations, specific Airbnb license requirements might still exist or change. Always verify the latest short term rental regulations and Airbnb license requirements directly with local government authorities for Alpine Shire to ensure full compliance before hosting.
(Source: AirROI data, 2025, finding no licensed listings among those analyzed)
Top Performing Airbnb Properties in Alpine Shire (2025)
Benchmark your potential! Explore examples of top-performing Airbnb properties in Alpine Shirebased on Trailing Twelve Month (TTM) revenue. Analyze their characteristics, revenue, occupancy rate, and ADR to understand what drives success in this market.
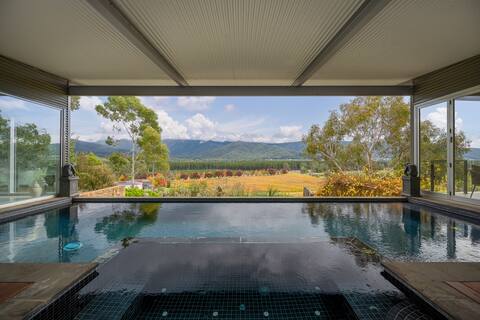
The Vineyard Residence
Entire Place • 4 bedrooms
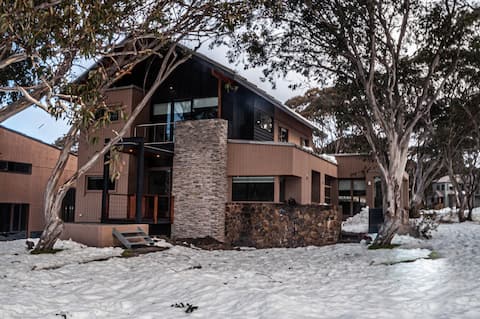
'Last Run' 4 Bedroom Presidential House, Mt Hotham
Entire Place • 4 bedrooms
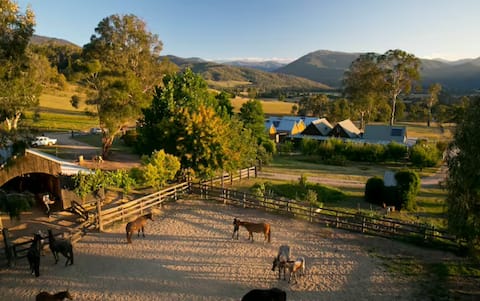
Group Accommodation horse farm
Entire Place • 6 bedrooms
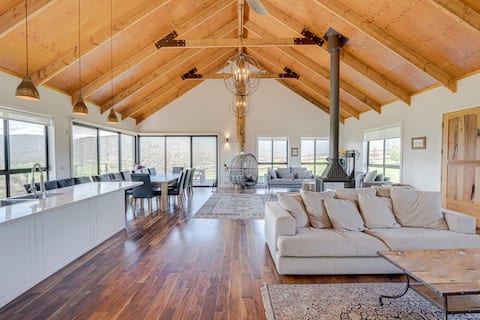
Sunset Ridge - Stunning 360 degree views
Entire Place • 3 bedrooms

Rosewhite House; quiet, comfortable, great views
Entire Place • N/A

"View 180" - magnificent mountain and valley views
Entire Place • 3 bedrooms
Note: Performance varies based on location, size, amenities, seasonality, and management quality. Data reflects the past 12 months.
Top Performing Airbnb Hosts in Alpine Shire (2025)
Learn from the best! This table showcases top-performing Airbnb hosts in Alpine Shire based on the number of properties managed and estimated total revenue over the past year. Analyze their scale and performance metrics.
| Host Name | Properties | Grossing Revenue | Stay Reviews | Avg Rating |
|---|---|---|---|---|
| Lin | 4 | $133,151 | 140 | 4.92/5.0 |
| Priscilla | 3 | $127,577 | 105 | 4.94/5.0 |
| Cindy | 5 | $120,583 | 92 | 4.94/5.0 |
| Host #377264406 | 1 | $117,095 | 0 | 0.00/5.0 |
| Michael And Ashleigh | 3 | $112,395 | 84 | 4.75/5.0 |
| Luke | 1 | $101,983 | 7 | 5.00/5.0 |
| Alex-Family | 2 | $93,559 | 190 | 4.83/5.0 |
| Bright-Holidays | 2 | $90,488 | 30 | 4.77/5.0 |
| Host #411167444 | 1 | $84,196 | 8 | 5.00/5.0 |
| Belinda & Brendan | 2 | $79,371 | 718 | 4.96/5.0 |
Analyzing the strategies of top hosts, such as their property selection, pricing, and guest communication, can offer valuable lessons for optimizing your own Airbnb operations in Alpine Shire.
Dive Deeper: Advanced Alpine Shire STR Market Data (2025)
Ready to unlock more insights? AirROI provides access to advanced metrics and comprehensive Airbnb data for Alpine Shire. Explore detailed analytics beyond this report to refine your investment strategy, optimize pricing, and maximize your vacation rental profits.
Explore Advanced MetricsAlpine Shire Short-Term Rental Market Composition (2025): Property & Room Types
Room Type Distribution
Property Type Distribution
Market Composition Insights for Alpine Shire
- The Alpine Shire Airbnb market composition is heavily skewed towards Entire Home/Apt listings, which make up 87.3% of the 79 active rentals. This indicates strong guest preference for privacy and space.
- Looking at the property type distribution in Alpine Shire, House properties are the most common (55.7%), reflecting the local real estate landscape.
- Houses represent a significant 55.7% portion, catering likely to families or larger groups.
- The presence of 7.6% Hotel/Boutique listings indicates integration with traditional hospitality.
- Smaller segments like unique stays (combined 1.3%) offer potential for unique stay experiences.
Alpine Shire Airbnb Room Capacity Analysis (2025): Bedroom Distribution
Distribution of Listings by Number of Bedrooms
Room Capacity Insights for Alpine Shire
- The dominant room capacity in Alpine Shire is 1 bedroom listings, making up 25.3% of the market. This suggests a strong demand for properties suitable for couples or solo travelers.
- Together, 1 bedroom and 2 bedrooms properties represent 49.4% of the active Airbnb listings in Alpine Shire, indicating a high concentration in these sizes.
- A significant 38.0% of listings offer 3+ bedrooms, catering to larger groups and families seeking more space in Alpine Shire.
Alpine Shire Vacation Rental Guest Capacity Trends (2025)
Distribution of Listings by Guest Capacity
Guest Capacity Insights for Alpine Shire
- The most common guest capacity trend in Alpine Shire vacation rentals is listings accommodating 8+ guests (22.8%). This suggests the primary traveler segment is likely larger groups.
- Properties designed for 8+ guests and 2 guests dominate the Alpine Shire STR market, accounting for 43.1% of listings.
- 41.8% of properties accommodate 6+ guests, serving the market segment for larger families or group travel in Alpine Shire.
- On average, properties in Alpine Shire are equipped to host 4.5 guests.
Alpine Shire Airbnb Booking Patterns (2025): Available vs. Booked Days
Available Days Distribution
Booked Days Distribution
Booking Pattern Insights for Alpine Shire
- The most common availability pattern in Alpine Shire falls within the 271-366 days range, representing 40.5% of listings. This suggests many properties have significant open periods on their calendars.
- Approximately 73.4% of listings show high availability (181+ days open annually), indicating potential for increased bookings or specific owner usage patterns.
- For booked days, the 91-180 days range is most frequent in Alpine Shire (35.4%), reflecting common guest stay durations or potential owner blocking patterns.
- A notable 26.6% of properties secure long booking periods (181+ days booked per year), highlighting successful long-term rental strategies or significant owner usage.
Alpine Shire Airbnb Minimum Stay Requirements Analysis
Distribution of Listings by Minimum Night Requirement
1 Night
9 listings
12% of total
2 Nights
41 listings
54.7% of total
3 Nights
6 listings
8% of total
4-6 Nights
4 listings
5.3% of total
30+ Nights
15 listings
20% of total
Key Insights
- The most prevalent minimum stay requirement in Alpine Shire is 2 Nights, adopted by 54.7% of listings. This highlights the market's preference for shorter, flexible bookings.
- A strong majority (66.7%) of the Alpine Shire Airbnb data shows acceptance of very short stays (1-2 nights), indicating a dynamic, high-turnover market.
- A significant segment (20%) caters to monthly stays (30+ nights) in Alpine Shire, pointing to opportunities in the extended-stay market.
Recommendations
- Align with the market by considering a 2 Nights minimum stay, as 54.7% of Alpine Shire hosts use this setting.
- If feasible, allowing 1-night stays, especially midweek or during low season, could capture last-minute bookings, as only 12% currently do.
- A 2-night minimum appears standard (54.7%). Consider this for weekends or peak periods.
- Explore offering discounts for stays of 30+ nights to attract the 20% of the market seeking extended stays.
- Adjust minimum nights based on seasonality – potentially shorter during low season and longer during peak demand periods in Alpine Shire.
Alpine Shire Airbnb Cancellation Policy Trends Analysis (2025)
Super Strict 60 Days
1 listings
1.4% of total
Super Strict 30 Days
2 listings
2.7% of total
Flexible
9 listings
12.2% of total
Moderate
25 listings
33.8% of total
Firm
19 listings
25.7% of total
Strict
18 listings
24.3% of total
Cancellation Policy Insights for Alpine Shire
- The prevailing Airbnb cancellation policy trend in Alpine Shire is Moderate, used by 33.8% of listings.
- There's a relatively balanced mix between guest-friendly (46.0%) and stricter (50.0%) policies, offering choices for different guest needs.
Recommendations for Hosts
- Consider adopting a Moderate policy to align with the 33.8% market standard in Alpine Shire.
- Regularly review your cancellation policy against competitors and market demand shifts in Alpine Shire.
Alpine Shire STR Booking Lead Time Analysis (2025)
Average Booking Lead Time by Month
Booking Lead Time Insights for Alpine Shire
- The overall average booking lead time for vacation rentals in Alpine Shire is 59 days.
- Guests book furthest in advance for stays during November (average 82 days), likely coinciding with peak travel demand or local events.
- The shortest booking windows occur for stays in September (average 47 days), indicating more last-minute travel plans during this time.
- Seasonally, Winter (65 days avg.) sees the longest lead times, while Summer (57 days avg.) has the shortest, reflecting typical travel planning cycles.
Recommendations for Hosts
- Use the overall average lead time (59 days) as a baseline for your pricing and availability strategy in Alpine Shire.
- For November stays, consider implementing length-of-stay discounts or slightly higher rates for bookings made less than 82 days out to capitalize on advance planning.
- Target marketing efforts for the Winter season well in advance (at least 65 days) to capture early planners.
- Monitor your own booking lead times against these Alpine Shire averages to identify opportunities for dynamic pricing adjustments.
Popular & Essential Airbnb Amenities in Alpine Shire (2025)
Amenity Prevalence
Amenity Insights for Alpine Shire
- Essential amenities in Alpine Shire that guests expect include: Smoke alarm, Heating, Free parking on premises. Lacking these (any) could significantly impact bookings.
- Popular amenities like Hot water, TV, Air conditioning are common but not universal. Offering these can provide a competitive edge.
Recommendations for Hosts
- Ensure your listing includes all essential amenities for Alpine Shire: Smoke alarm, Heating, Free parking on premises.
- Prioritize adding missing essentials: Smoke alarm, Heating, Free parking on premises.
- Consider adding popular differentiators like Hot water or TV to increase appeal.
- Highlight unique or less common amenities you offer (e.g., hot tub, dedicated workspace, EV charger) in your listing description and photos.
- Regularly check competitor amenities in Alpine Shire to stay competitive.
Alpine Shire Airbnb Guest Demographics & Profile Analysis (2025)
Guest Profile Summary for Alpine Shire
- The typical guest profile for Airbnb in Alpine Shire consists of primarily domestic travelers (96%), often arriving from nearby Melbourne, typically belonging to the Post-2000s (Gen Z/Alpha) group (50%), primarily speaking English or Chinese.
- Domestic travelers account for 95.9% of guests.
- Key international markets include Australia (95.9%) and United Kingdom (1%).
- Top languages spoken are English (68.8%) followed by Chinese (4.9%).
- A significant demographic segment is the Post-2000s (Gen Z/Alpha) group, representing 50% of guests.
Recommendations for Hosts
- Target domestic marketing efforts towards travelers from Melbourne and Victoria.
- Tailor amenities and listing descriptions to appeal to the dominant Post-2000s (Gen Z/Alpha) demographic (e.g., highlight fast WiFi, smart home features, local guides).
- Highlight unique local experiences or amenities relevant to the primary guest profile.
- Consider seasonal promotions aligned with peak travel times for key origin markets.
Nearby Short-Term Rental Market Comparison
How does the Alpine Shire Airbnb market stack up against its neighbors? Compare key performance metrics like average monthly revenue, ADR, and occupancy rates in surrounding areas to understand the broader regional STR landscape.
| Market | Active Properties | Monthly Revenue | Daily Rate | Avg. Occupancy |
|---|---|---|---|---|
| Howqua Inlet | 13 | $3,634 | $322.01 | 37% |
| Bright | 474 | $3,468 | $294.34 | 42% |
| Porepunkah | 40 | $3,397 | $328.54 | 37% |
| Nagambie | 33 | $3,381 | $300.42 | 40% |
| Shire of Mansfield | 89 | $3,347 | $392.77 | 34% |
| Shire of Strathbogie | 43 | $3,173 | $314.72 | 37% |
| Jamieson | 37 | $3,138 | $283.80 | 33% |
| Wandiligong | 20 | $3,137 | $271.79 | 41% |
| Shire of Murrindindi | 70 | $3,061 | $268.84 | 40% |
| Beechworth | 110 | $3,056 | $251.89 | 41% |