Waratah-Wynyard Airbnb Market Analysis 2025: Short Term Rental Data & Vacation Rental Statistics in Tasmania, Australia
Is Airbnb profitable in Waratah-Wynyard in 2025? Explore comprehensive Airbnb analytics for Waratah-Wynyard, Tasmania, Australia to uncover income potential. This 2025 STR market report for Waratah-Wynyard, based on AirROI data from April 2024 to March 2025, reveals key trends in the niche market of 38 active listings.
Whether you're considering an Airbnb investment in Waratah-Wynyard, optimizing your existing vacation rental, or exploring rental arbitrage opportunities, understanding the Waratah-Wynyard Airbnb data is crucial. Navigating the high regulation landscape is key to maximizing your short term rental income potential. Let's dive into the specifics.
Key Waratah-Wynyard Airbnb Performance Metrics Overview
Monthly Airbnb Revenue Variations & Income Potential in Waratah-Wynyard (2025)
Understanding the monthly revenue variations for Airbnb listings in Waratah-Wynyard is key to maximizing your short term rental income potential. Seasonality significantly impacts earnings. Our analysis, based on data from the past 12 months, shows that the peak revenue month for STRs in Waratah-Wynyard is typically January, while September often presents the lowest earnings, highlighting opportunities for strategic pricing adjustments during shoulder and low seasons. Explore the typical Airbnb income in Waratah-Wynyard across different performance tiers:
- Best-in-class properties (Top 10%) achieve $6,351+ monthly, often utilizing dynamic pricing and superior guest experiences.
- Strong performing properties (Top 25%) earn $4,624 or more, indicating effective management and desirable locations/amenities.
- Typical properties (Median) generate around $2,984 per month, representing the average market performance.
- Entry-level properties (Bottom 25%) see earnings around $1,715, often with potential for optimization.
Average Monthly Airbnb Earnings Trend in Waratah-Wynyard
Waratah-Wynyard Airbnb Occupancy Rate Trends (2025)
Maximize your bookings by understanding the Waratah-Wynyard STR occupancy trends. Seasonal demand shifts significantly influence how often properties are booked. Typically, Januarysees the highest demand (peak season occupancy), while May experiences the lowest (low season). Effective strategies, like adjusting minimum stays or offering promotions, can boost occupancy during slower periods. Here's how different property tiers perform in Waratah-Wynyard:
- Best-in-class properties (Top 10%) achieve 83%+ occupancy, indicating high desirability and potentially optimized availability.
- Strong performing properties (Top 25%) maintain 68% or higher occupancy, suggesting good market fit and guest satisfaction.
- Typical properties (Median) have an occupancy rate around 49%.
- Entry-level properties (Bottom 25%) average 32% occupancy, potentially facing higher vacancy.
Average Monthly Occupancy Rate Trend in Waratah-Wynyard
Average Daily Rate (ADR) Airbnb Trends in Waratah-Wynyard (2025)
Effective short term rental pricing strategy in Waratah-Wynyard involves understanding monthly ADR fluctuations. The Average Daily Rate (ADR) for Airbnb in Waratah-Wynyard typically peaks in January and dips lowest during September. Leveraging Airbnb dynamic pricing tools or strategies based on this seasonality can significantly boost revenue. Here's a look at the typical nightly rates achieved:
- Best-in-class properties (Top 10%) command rates of $259+ per night, often due to premium features or locations.
- Strong performing properties (Top 25%) achieve nightly rates of $210 or more.
- Typical properties (Median) charge around $168 per night.
- Entry-level properties (Bottom 25%) earn around $126 per night.
Average Daily Rate (ADR) Trend by Month in Waratah-Wynyard
Get Live Waratah-Wynyard Market Intelligence 👇

Explore Real-time Analytics
Airbnb Seasonality Analysis & Trends in Waratah-Wynyard (2025)
Peak Season (January, December, February)
- Revenue averages $4,706 per month
- Occupancy rates average 68.8%
- Daily rates average $192
Shoulder Season
- Revenue averages $3,432 per month
- Occupancy maintains around 45.8%
- Daily rates hold near $181
Low Season (August, September, October)
- Revenue drops to average $2,578 per month
- Occupancy decreases to average 40.2%
- Daily rates adjust to average $178
Seasonality Insights for Waratah-Wynyard
- The Airbnb seasonality in Waratah-Wynyard shows highly seasonal trends requiring careful strategy. While the sections above show seasonal averages, it's also insightful to look at the extremes:
- During the high season, the absolute peak month showcases Waratah-Wynyard's highest earning potential, with monthly revenues capable of climbing to $5,251, occupancy reaching a high of 73.5%, and ADRs peaking at $196.
- Conversely, the slowest single month of the year, typically falling within the low season, marks the market's lowest point. In this month, revenue might dip to $2,265, occupancy could drop to 30.9%, and ADRs may adjust down to $177.
- Understanding both the seasonal averages and these monthly peaks and troughs in revenue, occupancy, and ADR is crucial for maximizing your Airbnb profit potential in Waratah-Wynyard.
Seasonal Strategies for Maximizing Profit
- Peak Season: Maximize revenue through premium pricing and potentially longer minimum stays. Ensure high availability.
- Low Season: Offer competitive pricing, special promotions (e.g., extended stay discounts), and flexible cancellation policies. Target off-season travelers like remote workers or budget-conscious guests.
- Shoulder Seasons: Implement dynamic pricing that balances peak and low rates. Target weekend travelers or specific events. Offer slightly more flexible terms than peak season.
- Regularly analyze your own performance against these Waratah-Wynyard seasonality benchmarks and adjust your pricing and availability strategy accordingly.
Best Areas for Airbnb Investment in Waratah-Wynyard (2025)
Exploring the top neighborhoods for short-term rentals in Waratah-Wynyard? This section highlights key areas, outlining why they are attractive for hosts and guests, along with notable local attractions. Consider these locations based on your target guest profile and investment strategy.
| Neighborhood / Area | Why Host Here? (Target Guests & Appeal) | Key Attractions & Landmarks |
|---|---|---|
| Burnie | A growing regional hub with a beautiful coastal location. It attracts visitors for its beaches, cultural experiences, and outdoor activities. | Burnie Beach, Makers Workshop, Burnie Park, Fern Glade Reserve, Penguin Observation Centre |
| Wynyard | Known for its stunning beaches and laid-back atmosphere. A popular spot for families and those seeking natural beauty and outdoor adventures. | Table Cape Lighthouse, Wynyard Foreshore, The Boat Harbour Beach, Wynyard Floral Designer, Makers Workshop |
| Sandy Cape | Famous for its scenic beauty and untouched beaches. Ideal for those wanting to escape into nature and enjoy beachside activities. | Sandy Cape Conservation Area, Binalong Bay, Bay of Fires, Camel Rock, St. Helens Point National Park |
| Stanley | A historic town with breathtaking coastal views and rich history. Visitors enjoy its charming atmosphere and the famous Nut mountain. | The Nut State Reserve, Stanley Discovery Museum, Highfield Historic Site, Stanley Seaquarium, Godfreys Beach |
| Circular Head | Known for its rugged coastline, stunning landscapes, and wildlife. Offers unique experiences for nature lovers and adventure seekers. | The Nut, Cow's Head, Table Cape, Green Point Nature Reserve, Smithton |
| Devonport | A bustling regional city with a vibrant arts scene and attractions such as the iconic Spirit of Tasmania ferry terminal. Great for cultural tourism. | Devonport Regional Gallery, Mersey Bluff Lighthouse, The Tasmanian Arboretum, Devonport Ferry Terminal, Coles Beach |
| Tasman Peninsula | Famous for its dramatic cliffs and nature reserves. A top choice for tourists looking for stunning coastal landscapes and outdoor activities. | Port Arthur Historic Site, Eaglehawk Neck, Tasman National Park, Three Capes Track, Fortescue Bay |
| Currie | Located on King Island, known for its rugged coastline and dairy farming. It attracts foodies and nature enthusiasts alike. | King Island Dairy, Currie Lighthouse, Henty Beach, King Island Golf Club, Sea Elephant River |
Understanding Airbnb License Requirements & STR Laws in Waratah-Wynyard (2025)
Yes, Waratah-Wynyard, Tasmania, Australia enforces high STR regulations. Obtaining a license and ensuring compliance is almost certainly required according to current 2025 STR laws. Always verify the latest short term rental regulations and Airbnb license requirements directly with local government authorities for Waratah-Wynyard to ensure full compliance before hosting.
(Source: AirROI data, 2025, based on 92% licensed listings)
Top Performing Airbnb Properties in Waratah-Wynyard (2025)
Benchmark your potential! Explore examples of top-performing Airbnb properties in Waratah-Wynyardbased on Trailing Twelve Month (TTM) revenue. Analyze their characteristics, revenue, occupancy rate, and ADR to understand what drives success in this market.
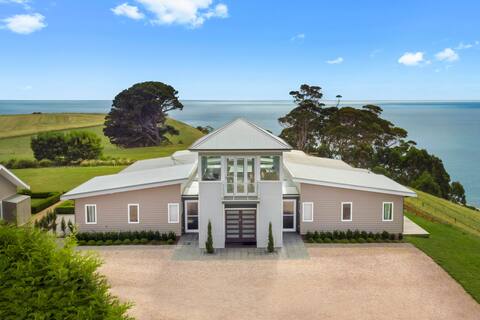
Table House Farm -Luxury villa, secluded beach
Entire Place • 4 bedrooms

The Winged House
Entire Place • 2 bedrooms

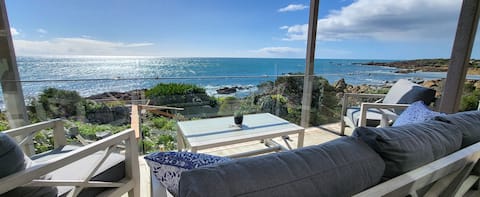
Seventeen Steps to the Beach
Entire Place • 2 bedrooms
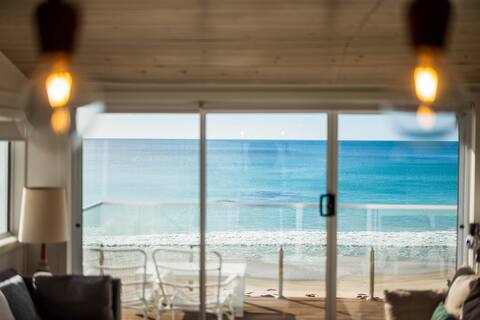
Heathcliff. Stunning ocean views!
Entire Place • 3 bedrooms
'Just Relax &' - Boat Harbour Beachfront home
Entire Place • 3 bedrooms
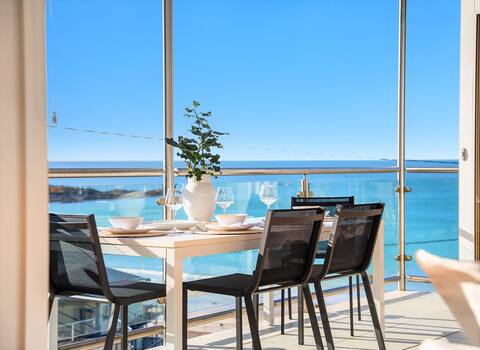
Superb, White House Tasmania Boat Harbour Beach.
Entire Place • 2 bedrooms
Note: Performance varies based on location, size, amenities, seasonality, and management quality. Data reflects the past 12 months.
Top Performing Airbnb Hosts in Waratah-Wynyard (2025)
Learn from the best! This table showcases top-performing Airbnb hosts in Waratah-Wynyard based on the number of properties managed and estimated total revenue over the past year. Analyze their scale and performance metrics.
| Host Name | Properties | Grossing Revenue | Stay Reviews | Avg Rating |
|---|---|---|---|---|
| Sonya | 9 | $292,549 | 600 | 4.84/5.0 |
| Alan & Wendy | 2 | $174,706 | 172 | 5.00/5.0 |
| Andrea | 3 | $123,803 | 76 | 4.98/5.0 |
| Quentin | 1 | $103,669 | 316 | 4.97/5.0 |
| Joesephine | 2 | $81,404 | 93 | 4.91/5.0 |
| Arthur | 1 | $78,249 | 17 | 4.94/5.0 |
| Virginia | 1 | $63,071 | 37 | 4.95/5.0 |
| David | 1 | $60,667 | 66 | 4.94/5.0 |
| Linda | 1 | $51,409 | 132 | 4.98/5.0 |
| Roger & Miranda | 1 | $36,455 | 214 | 4.82/5.0 |
Analyzing the strategies of top hosts, such as their property selection, pricing, and guest communication, can offer valuable lessons for optimizing your own Airbnb operations in Waratah-Wynyard.
Dive Deeper: Advanced Waratah-Wynyard STR Market Data (2025)
Ready to unlock more insights? AirROI provides access to advanced metrics and comprehensive Airbnb data for Waratah-Wynyard. Explore detailed analytics beyond this report to refine your investment strategy, optimize pricing, and maximize your vacation rental profits.
Explore Advanced MetricsWaratah-Wynyard Short-Term Rental Market Composition (2025): Property & Room Types
Room Type Distribution
Property Type Distribution
Market Composition Insights for Waratah-Wynyard
- The Waratah-Wynyard Airbnb market composition is heavily skewed towards Entire Home/Apt listings, which make up 92.1% of the 38 active rentals. This indicates strong guest preference for privacy and space.
- Looking at the property type distribution in Waratah-Wynyard, House properties are the most common (55.3%), reflecting the local real estate landscape.
- Houses represent a significant 55.3% portion, catering likely to families or larger groups.
- The presence of 5.3% Hotel/Boutique listings indicates integration with traditional hospitality.
Waratah-Wynyard Airbnb Room Capacity Analysis (2025): Bedroom Distribution
Distribution of Listings by Number of Bedrooms
Room Capacity Insights for Waratah-Wynyard
- The dominant room capacity in Waratah-Wynyard is 3 bedrooms listings, making up 34.2% of the market. This suggests a strong demand for properties suitable for families or small groups.
- Together, 3 bedrooms and 2 bedrooms properties represent 63.1% of the active Airbnb listings in Waratah-Wynyard, indicating a high concentration in these sizes.
- A significant 39.5% of listings offer 3+ bedrooms, catering to larger groups and families seeking more space in Waratah-Wynyard.
Waratah-Wynyard Vacation Rental Guest Capacity Trends (2025)
Distribution of Listings by Guest Capacity
Guest Capacity Insights for Waratah-Wynyard
- The most common guest capacity trend in Waratah-Wynyard vacation rentals is listings accommodating 2 guests (26.3%). This suggests the primary traveler segment is likely couples or solo travelers.
- Properties designed for 2 guests and 6 guests dominate the Waratah-Wynyard STR market, accounting for 50.0% of listings.
- 42.2% of properties accommodate 6+ guests, serving the market segment for larger families or group travel in Waratah-Wynyard.
- On average, properties in Waratah-Wynyard are equipped to host 4.3 guests.
Waratah-Wynyard Airbnb Booking Patterns (2025): Available vs. Booked Days
Available Days Distribution
Booked Days Distribution
Booking Pattern Insights for Waratah-Wynyard
- The most common availability pattern in Waratah-Wynyard falls within the 181-270 days range, representing 42.1% of listings. This suggests many properties have significant open periods on their calendars.
- Approximately 55.3% of listings show high availability (181+ days open annually), indicating potential for increased bookings or specific owner usage patterns.
- For booked days, the 91-180 days range is most frequent in Waratah-Wynyard (36.8%), reflecting common guest stay durations or potential owner blocking patterns.
- A notable 50.0% of properties secure long booking periods (181+ days booked per year), highlighting successful long-term rental strategies or significant owner usage.
Waratah-Wynyard Airbnb Minimum Stay Requirements Analysis
Distribution of Listings by Minimum Night Requirement
1 Night
9 listings
24.3% of total
2 Nights
23 listings
62.2% of total
3 Nights
3 listings
8.1% of total
30+ Nights
2 listings
5.4% of total
Key Insights
- The most prevalent minimum stay requirement in Waratah-Wynyard is 2 Nights, adopted by 62.2% of listings. This highlights the market's preference for shorter, flexible bookings.
- A strong majority (86.5%) of the Waratah-Wynyard Airbnb data shows acceptance of very short stays (1-2 nights), indicating a dynamic, high-turnover market.
Recommendations
- Align with the market by considering a 2 Nights minimum stay, as 62.2% of Waratah-Wynyard hosts use this setting.
- If feasible, allowing 1-night stays, especially midweek or during low season, could capture last-minute bookings, as only 24.3% currently do.
- Explore offering discounts for stays of 30+ nights to attract the 5.4% of the market seeking extended stays.
- Adjust minimum nights based on seasonality – potentially shorter during low season and longer during peak demand periods in Waratah-Wynyard.
Waratah-Wynyard Airbnb Cancellation Policy Trends Analysis (2025)
Flexible
8 listings
21.6% of total
Moderate
8 listings
21.6% of total
Firm
10 listings
27% of total
Strict
11 listings
29.7% of total
Cancellation Policy Insights for Waratah-Wynyard
- The prevailing Airbnb cancellation policy trend in Waratah-Wynyard is Strict, used by 29.7% of listings.
- A majority (56.7%) of hosts in Waratah-Wynyard utilize Firm or Strict policies, indicating a market where hosts prioritize booking security.
Recommendations for Hosts
- Consider adopting a Strict policy to align with the 29.7% market standard in Waratah-Wynyard.
- Regularly review your cancellation policy against competitors and market demand shifts in Waratah-Wynyard.
Waratah-Wynyard STR Booking Lead Time Analysis (2025)
Average Booking Lead Time by Month
Booking Lead Time Insights for Waratah-Wynyard
- The overall average booking lead time for vacation rentals in Waratah-Wynyard is 70 days.
- Guests book furthest in advance for stays during January (average 138 days), likely coinciding with peak travel demand or local events.
- The shortest booking windows occur for stays in August (average 34 days), indicating more last-minute travel plans during this time.
- Seasonally, Winter (119 days avg.) sees the longest lead times, while Summer (50 days avg.) has the shortest, reflecting typical travel planning cycles.
Recommendations for Hosts
- Use the overall average lead time (70 days) as a baseline for your pricing and availability strategy in Waratah-Wynyard.
- For January stays, consider implementing length-of-stay discounts or slightly higher rates for bookings made less than 138 days out to capitalize on advance planning.
- Target marketing efforts for the Winter season well in advance (at least 119 days) to capture early planners.
- Monitor your own booking lead times against these Waratah-Wynyard averages to identify opportunities for dynamic pricing adjustments.
Popular & Essential Airbnb Amenities in Waratah-Wynyard (2025)
Amenity Prevalence
Amenity Insights for Waratah-Wynyard
- Essential amenities in Waratah-Wynyard that guests expect include: TV, Smoke alarm, Free parking on premises. Lacking these (any) could significantly impact bookings.
- Popular amenities like Wifi, Kitchen, Hair dryer are common but not universal. Offering these can provide a competitive edge.
- Warning: Wifi is not universally provided but is considered essential globally. Ensure reliable Wifi is offered.
Recommendations for Hosts
- Ensure your listing includes all essential amenities for Waratah-Wynyard: TV, Smoke alarm, Free parking on premises.
- Prioritize adding missing essentials: Free parking on premises.
- Consider adding popular differentiators like Wifi or Kitchen to increase appeal.
- Highlight unique or less common amenities you offer (e.g., hot tub, dedicated workspace, EV charger) in your listing description and photos.
- Regularly check competitor amenities in Waratah-Wynyard to stay competitive.
Waratah-Wynyard Airbnb Guest Demographics & Profile Analysis (2025)
Guest Profile Summary for Waratah-Wynyard
- The typical guest profile for Airbnb in Waratah-Wynyard consists of primarily domestic travelers (92%), often arriving from nearby Hobart, typically belonging to the Post-2000s (Gen Z/Alpha) group (50%), primarily speaking English or German.
- Domestic travelers account for 91.5% of guests.
- Key international markets include Australia (91.5%) and United States (1.8%).
- Top languages spoken are English (75.2%) followed by German (6.4%).
- A significant demographic segment is the Post-2000s (Gen Z/Alpha) group, representing 50% of guests.
Recommendations for Hosts
- Target domestic marketing efforts towards travelers from Hobart and Launceston.
- Tailor amenities and listing descriptions to appeal to the dominant Post-2000s (Gen Z/Alpha) demographic (e.g., highlight fast WiFi, smart home features, local guides).
- Highlight unique local experiences or amenities relevant to the primary guest profile.
- Consider seasonal promotions aligned with peak travel times for key origin markets.
Nearby Short-Term Rental Market Comparison
How does the Waratah-Wynyard Airbnb market stack up against its neighbors? Compare key performance metrics like average monthly revenue, ADR, and occupancy rates in surrounding areas to understand the broader regional STR landscape.
| Market | Active Properties | Monthly Revenue | Daily Rate | Avg. Occupancy |
|---|---|---|---|---|
| Kentish | 66 | $2,894 | $190.06 | 53% |
| Turners Beach | 11 | $2,654 | $242.16 | 50% |
| Sisters Beach | 26 | $2,605 | $177.40 | 49% |
| Meander Valley | 32 | $2,437 | $176.14 | 50% |
| Arthur River | 10 | $2,403 | $159.75 | 50% |
| Miena | 11 | $2,357 | $143.38 | 51% |
| West Tamar | 63 | $2,326 | $164.36 | 51% |
| Penguin | 48 | $2,250 | $164.42 | 51% |
| Sheffield | 22 | $2,154 | $144.51 | 50% |
| Stanley | 68 | $2,124 | $196.83 | 43% |