St Helens Airbnb Market Analysis 2025: Short Term Rental Data & Vacation Rental Statistics in Tasmania, Australia
Is Airbnb profitable in St Helens in 2025? Explore comprehensive Airbnb analytics for St Helens, Tasmania, Australia to uncover income potential. This 2025 STR market report for St Helens, based on AirROI data from April 2024 to March 2025, reveals key trends in the niche market of 78 active listings.
Whether you're considering an Airbnb investment in St Helens, optimizing your existing vacation rental, or exploring rental arbitrage opportunities, understanding the St Helens Airbnb data is crucial. Navigating the high regulation landscape is key to maximizing your short term rental income potential. Let's dive into the specifics.
Key St Helens Airbnb Performance Metrics Overview
Monthly Airbnb Revenue Variations & Income Potential in St Helens (2025)
Understanding the monthly revenue variations for Airbnb listings in St Helens is key to maximizing your short term rental income potential. Seasonality significantly impacts earnings. Our analysis, based on data from the past 12 months, shows that the peak revenue month for STRs in St Helens is typically January, while August often presents the lowest earnings, highlighting opportunities for strategic pricing adjustments during shoulder and low seasons. Explore the typical Airbnb income in St Helens across different performance tiers:
- Best-in-class properties (Top 10%) achieve $4,254+ monthly, often utilizing dynamic pricing and superior guest experiences.
- Strong performing properties (Top 25%) earn $3,025 or more, indicating effective management and desirable locations/amenities.
- Typical properties (Median) generate around $2,017 per month, representing the average market performance.
- Entry-level properties (Bottom 25%) see earnings around $1,093, often with potential for optimization.
Average Monthly Airbnb Earnings Trend in St Helens
St Helens Airbnb Occupancy Rate Trends (2025)
Maximize your bookings by understanding the St Helens STR occupancy trends. Seasonal demand shifts significantly influence how often properties are booked. Typically, Januarysees the highest demand (peak season occupancy), while August experiences the lowest (low season). Effective strategies, like adjusting minimum stays or offering promotions, can boost occupancy during slower periods. Here's how different property tiers perform in St Helens:
- Best-in-class properties (Top 10%) achieve 76%+ occupancy, indicating high desirability and potentially optimized availability.
- Strong performing properties (Top 25%) maintain 58% or higher occupancy, suggesting good market fit and guest satisfaction.
- Typical properties (Median) have an occupancy rate around 38%.
- Entry-level properties (Bottom 25%) average 23% occupancy, potentially facing higher vacancy.
Average Monthly Occupancy Rate Trend in St Helens
Average Daily Rate (ADR) Airbnb Trends in St Helens (2025)
Effective short term rental pricing strategy in St Helens involves understanding monthly ADR fluctuations. The Average Daily Rate (ADR) for Airbnb in St Helens typically peaks in January and dips lowest during August. Leveraging Airbnb dynamic pricing tools or strategies based on this seasonality can significantly boost revenue. Here's a look at the typical nightly rates achieved:
- Best-in-class properties (Top 10%) command rates of $270+ per night, often due to premium features or locations.
- Strong performing properties (Top 25%) achieve nightly rates of $210 or more.
- Typical properties (Median) charge around $149 per night.
- Entry-level properties (Bottom 25%) earn around $112 per night.
Average Daily Rate (ADR) Trend by Month in St Helens
Get Live St Helens Market Intelligence 👇

Explore Real-time Analytics
Airbnb Seasonality Analysis & Trends in St Helens (2025)
Peak Season (January, December, February)
- Revenue averages $3,325 per month
- Occupancy rates average 59.0%
- Daily rates average $186
Shoulder Season
- Revenue averages $2,041 per month
- Occupancy maintains around 38.2%
- Daily rates hold near $163
Low Season (July, August, September)
- Revenue drops to average $1,567 per month
- Occupancy decreases to average 33.1%
- Daily rates adjust to average $156
Seasonality Insights for St Helens
- The Airbnb seasonality in St Helens shows highly seasonal trends requiring careful strategy. While the sections above show seasonal averages, it's also insightful to look at the extremes:
- During the high season, the absolute peak month showcases St Helens's highest earning potential, with monthly revenues capable of climbing to $4,271, occupancy reaching a high of 69.3%, and ADRs peaking at $195.
- Conversely, the slowest single month of the year, typically falling within the low season, marks the market's lowest point. In this month, revenue might dip to $1,327, occupancy could drop to 28.7%, and ADRs may adjust down to $154.
- Understanding both the seasonal averages and these monthly peaks and troughs in revenue, occupancy, and ADR is crucial for maximizing your Airbnb profit potential in St Helens.
Seasonal Strategies for Maximizing Profit
- Peak Season: Maximize revenue through premium pricing and potentially longer minimum stays. Ensure high availability.
- Low Season: Offer competitive pricing, special promotions (e.g., extended stay discounts), and flexible cancellation policies. Target off-season travelers like remote workers or budget-conscious guests.
- Shoulder Seasons: Implement dynamic pricing that balances peak and low rates. Target weekend travelers or specific events. Offer slightly more flexible terms than peak season.
- Regularly analyze your own performance against these St Helens seasonality benchmarks and adjust your pricing and availability strategy accordingly.
Best Areas for Airbnb Investment in St Helens (2025)
Exploring the top neighborhoods for short-term rentals in St Helens? This section highlights key areas, outlining why they are attractive for hosts and guests, along with notable local attractions. Consider these locations based on your target guest profile and investment strategy.
| Neighborhood / Area | Why Host Here? (Target Guests & Appeal) | Key Attractions & Landmarks |
|---|---|---|
| St Helens | A charming coastal town known for its access to beautiful beaches, national parks, and local seafood. It's a popular destination for tourists seeking outdoor adventures and a relaxed atmosphere. | St Helens Beach, Bay of Fires, Freycinet National Park, St Helens Point Conservation Area, Binalong Bay, The Gardens |
| Binalong Bay | Famous for its pristine beaches and clear waters, Binalong Bay is a sought-after location for beach lovers and those seeking a tranquil getaway. | Binalong Bay Beach, The Gardens, Bay of Fires, Binalong Bay Lookout, Fisherman's Memorial |
| Freycinet National Park | A stunning national park known for its beautiful landscapes and hiking trails. An ideal area for nature enthusiasts and adventure-seekers. | Wineglass Bay, Hazards Beach, Freycinet Marine Farm, Cape Tourville Lighthouse, Freycinet Peninsula Track |
| Swansea | Located nearby, Swansea offers beautiful coastal views and is close to several wineries, making it ideal for tourists seeking both relaxation and culinary experiences. | Swansea Beach, East Coast Heritage Museum, Spiky Bridge, Swansea Golf Club, Melshell Oysters |
| Pyengana | Known for its cheese factory and scenic countryside, Pyengana is a quaint village that attracts visitors looking for gourmet experiences and local produce. | Pyengana Dairy, St Columba Falls, The Pub in the Paddock, Pyengana Mine, Scenic views of the North East Tasmania |
| Bicheno | A popular holiday destination known for its stunning coastline, wildlife, and opportunities for snorkeling and diving. Perfect for a family beach holiday. | Bicheno Blowhole, Bicheno Beach, East Coast Natureworld, Bicheno Penguin Tours, Wineglass Bay Cruise |
| Coastal Trail | The East Coast Coastal Trail is known for its breathtaking views and walking paths along the coast. It attracts hikers and outdoor enthusiasts. | East Coast Walking Track, St Helens to Binalong Bay Trail, Coastal Parks, Wildlife observation, Scenic lookouts |
| Marion Bay | A small coastal town offering beautiful beaches and close proximity to the stunning Marion Bay. Ideal for fishing and beach activities. | Marion Bay Beach, Southwest National Park, Fishing spots, Local markets, Scenic vistas |
Understanding Airbnb License Requirements & STR Laws in St Helens (2025)
Yes, St Helens, Tasmania, Australia enforces high STR regulations. Obtaining a license and ensuring compliance is almost certainly required according to current 2025 STR laws. Always verify the latest short term rental regulations and Airbnb license requirements directly with local government authorities for St Helens to ensure full compliance before hosting.
(Source: AirROI data, 2025, based on 87% licensed listings)
Top Performing Airbnb Properties in St Helens (2025)
Benchmark your potential! Explore examples of top-performing Airbnb properties in St Helensbased on Trailing Twelve Month (TTM) revenue. Analyze their characteristics, revenue, occupancy rate, and ADR to understand what drives success in this market.
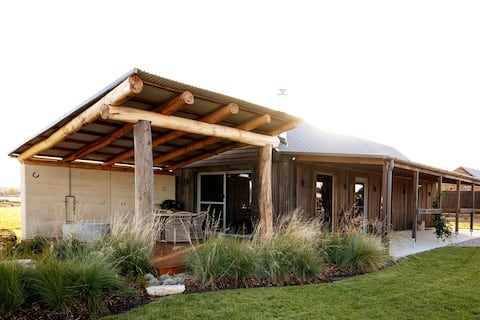
Martha Vale Park - The Stables
Entire Place • 1 bedroom

Humbug Bunk House & Hot Tub!
Entire Place • 3 bedrooms
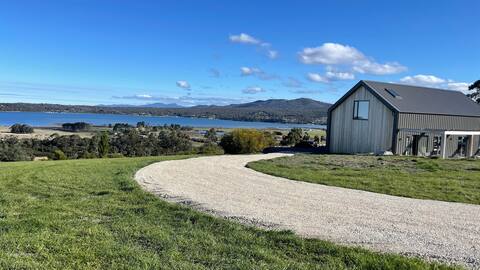
The Barn - Georges Bay, St Helens
Entire Place • 1 bedroom
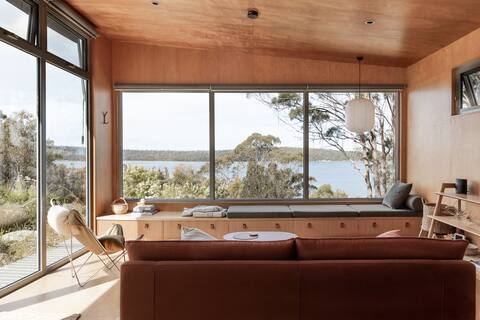
Swansong - Experience simple environmental living
Entire Place • 1 bedroom
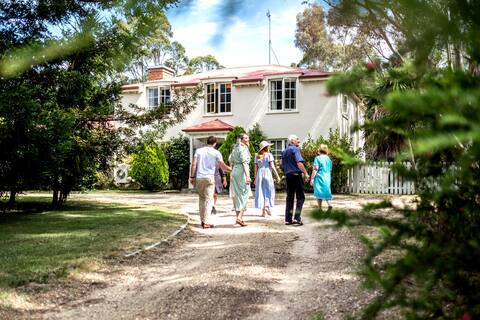
The French House
Entire Place • 5 bedrooms
Bay Of Fires Apartments - Suite 6
Private Room • 1 bedroom
Note: Performance varies based on location, size, amenities, seasonality, and management quality. Data reflects the past 12 months.
Top Performing Airbnb Hosts in St Helens (2025)
Learn from the best! This table showcases top-performing Airbnb hosts in St Helens based on the number of properties managed and estimated total revenue over the past year. Analyze their scale and performance metrics.
| Host Name | Properties | Grossing Revenue | Stay Reviews | Avg Rating |
|---|---|---|---|---|
| Emily | 15 | $488,352 | 744 | 4.84/5.0 |
| Heidi | 6 | $151,227 | 225 | 4.76/5.0 |
| Gail | 3 | $76,692 | 114 | 4.89/5.0 |
| Georges Bay | 2 | $67,789 | 16 | 4.80/5.0 |
| Zachary | 5 | $65,245 | 381 | 4.35/5.0 |
| Anna | 1 | $65,024 | 30 | 5.00/5.0 |
| Moxxi Property | 2 | $55,583 | 73 | 4.99/5.0 |
| Joanne | 7 | $48,787 | 1205 | 4.57/5.0 |
| Gary & Trish | 1 | $41,148 | 287 | 4.96/5.0 |
| Pearce | 1 | $38,954 | 17 | 4.76/5.0 |
Analyzing the strategies of top hosts, such as their property selection, pricing, and guest communication, can offer valuable lessons for optimizing your own Airbnb operations in St Helens.
Dive Deeper: Advanced St Helens STR Market Data (2025)
Ready to unlock more insights? AirROI provides access to advanced metrics and comprehensive Airbnb data for St Helens. Explore detailed analytics beyond this report to refine your investment strategy, optimize pricing, and maximize your vacation rental profits.
Explore Advanced MetricsSt Helens Short-Term Rental Market Composition (2025): Property & Room Types
Room Type Distribution
Property Type Distribution
Market Composition Insights for St Helens
- The St Helens Airbnb market composition is heavily skewed towards Entire Home/Apt listings, which make up 82.1% of the 78 active rentals. This indicates strong guest preference for privacy and space.
- Looking at the property type distribution in St Helens, House properties are the most common (53.8%), reflecting the local real estate landscape.
- Houses represent a significant 53.8% portion, catering likely to families or larger groups.
- The presence of 16.7% Hotel/Boutique listings indicates integration with traditional hospitality.
- Smaller segments like unique stays (combined 1.3%) offer potential for unique stay experiences.
St Helens Airbnb Room Capacity Analysis (2025): Bedroom Distribution
Distribution of Listings by Number of Bedrooms
Room Capacity Insights for St Helens
- The dominant room capacity in St Helens is 1 bedroom listings, making up 35.9% of the market. This suggests a strong demand for properties suitable for couples or solo travelers.
- Together, 1 bedroom and 3 bedrooms properties represent 64.1% of the active Airbnb listings in St Helens, indicating a high concentration in these sizes.
- A significant 37.2% of listings offer 3+ bedrooms, catering to larger groups and families seeking more space in St Helens.
St Helens Vacation Rental Guest Capacity Trends (2025)
Distribution of Listings by Guest Capacity
Guest Capacity Insights for St Helens
- The most common guest capacity trend in St Helens vacation rentals is listings accommodating 2 guests (25.6%). This suggests the primary traveler segment is likely couples or solo travelers.
- Properties designed for 2 guests and 6 guests dominate the St Helens STR market, accounting for 48.7% of listings.
- 43.6% of properties accommodate 6+ guests, serving the market segment for larger families or group travel in St Helens.
- On average, properties in St Helens are equipped to host 4.6 guests.
St Helens Airbnb Booking Patterns (2025): Available vs. Booked Days
Available Days Distribution
Booked Days Distribution
Booking Pattern Insights for St Helens
- The most common availability pattern in St Helens falls within the 181-270 days range, representing 43.6% of listings. This suggests many properties have significant open periods on their calendars.
- Approximately 74.4% of listings show high availability (181+ days open annually), indicating potential for increased bookings or specific owner usage patterns.
- For booked days, the 91-180 days range is most frequent in St Helens (43.6%), reflecting common guest stay durations or potential owner blocking patterns.
- A notable 26.9% of properties secure long booking periods (181+ days booked per year), highlighting successful long-term rental strategies or significant owner usage.
St Helens Airbnb Minimum Stay Requirements Analysis
Distribution of Listings by Minimum Night Requirement
1 Night
30 listings
39% of total
2 Nights
25 listings
32.5% of total
30+ Nights
22 listings
28.6% of total
Key Insights
- The most prevalent minimum stay requirement in St Helens is 1 Night, adopted by 39% of listings. This highlights the market's preference for shorter, flexible bookings.
- A strong majority (71.5%) of the St Helens Airbnb data shows acceptance of very short stays (1-2 nights), indicating a dynamic, high-turnover market.
- A significant segment (28.6%) caters to monthly stays (30+ nights) in St Helens, pointing to opportunities in the extended-stay market.
Recommendations
- Align with the market by considering a 1 Night minimum stay, as 39% of St Helens hosts use this setting.
- Explore offering discounts for stays of 30+ nights to attract the 28.6% of the market seeking extended stays.
- Adjust minimum nights based on seasonality – potentially shorter during low season and longer during peak demand periods in St Helens.
St Helens Airbnb Cancellation Policy Trends Analysis (2025)
Flexible
20 listings
26.3% of total
Moderate
36 listings
47.4% of total
Firm
15 listings
19.7% of total
Strict
5 listings
6.6% of total
Cancellation Policy Insights for St Helens
- The prevailing Airbnb cancellation policy trend in St Helens is Moderate, used by 47.4% of listings.
- The market strongly favors guest-friendly terms, with 73.7% of listings offering Flexible or Moderate policies. This suggests guests in St Helens may expect booking flexibility.
- Strict cancellation policies are quite rare (6.6%), potentially making listings with this policy less competitive unless justified by high demand or property type.
Recommendations for Hosts
- Consider adopting a Moderate policy to align with the 47.4% market standard in St Helens.
- Using a Strict policy might deter some guests, as only 6.6% of listings use it. Evaluate if potential revenue protection outweighs possible lower booking rates.
- Regularly review your cancellation policy against competitors and market demand shifts in St Helens.
St Helens STR Booking Lead Time Analysis (2025)
Average Booking Lead Time by Month
Booking Lead Time Insights for St Helens
- The overall average booking lead time for vacation rentals in St Helens is 56 days.
- Guests book furthest in advance for stays during December (average 93 days), likely coinciding with peak travel demand or local events.
- The shortest booking windows occur for stays in August (average 29 days), indicating more last-minute travel plans during this time.
- Seasonally, Winter (77 days avg.) sees the longest lead times, while Summer (44 days avg.) has the shortest, reflecting typical travel planning cycles.
Recommendations for Hosts
- Use the overall average lead time (56 days) as a baseline for your pricing and availability strategy in St Helens.
- For December stays, consider implementing length-of-stay discounts or slightly higher rates for bookings made less than 93 days out to capitalize on advance planning.
- Target marketing efforts for the Winter season well in advance (at least 77 days) to capture early planners.
- Monitor your own booking lead times against these St Helens averages to identify opportunities for dynamic pricing adjustments.
Popular & Essential Airbnb Amenities in St Helens (2025)
Amenity Prevalence
Amenity Insights for St Helens
- Popular amenities like Free parking on premises, Smoke alarm, TV are common but not universal. Offering these can provide a competitive edge.
- Warning: Wifi is not universally provided but is considered essential globally. Ensure reliable Wifi is offered.
Recommendations for Hosts
- Consider adding popular differentiators like Free parking on premises or Smoke alarm to increase appeal.
- Highlight unique or less common amenities you offer (e.g., hot tub, dedicated workspace, EV charger) in your listing description and photos.
- Regularly check competitor amenities in St Helens to stay competitive.
St Helens Airbnb Guest Demographics & Profile Analysis (2025)
Guest Profile Summary for St Helens
- The typical guest profile for Airbnb in St Helens consists of primarily domestic travelers (82%), often arriving from nearby Hobart, typically belonging to the Post-2000s (Gen Z/Alpha) group (50%), primarily speaking English or French.
- Domestic travelers account for 82.1% of guests.
- Key international markets include Australia (82.1%) and United Kingdom (4.1%).
- Top languages spoken are English (68.3%) followed by French (5.3%).
- A significant demographic segment is the Post-2000s (Gen Z/Alpha) group, representing 50% of guests.
Recommendations for Hosts
- Target domestic marketing efforts towards travelers from Hobart and Melbourne.
- Tailor amenities and listing descriptions to appeal to the dominant Post-2000s (Gen Z/Alpha) demographic (e.g., highlight fast WiFi, smart home features, local guides).
- Highlight unique local experiences or amenities relevant to the primary guest profile.
- Consider seasonal promotions aligned with peak travel times for key origin markets.
Nearby Short-Term Rental Market Comparison
How does the St Helens Airbnb market stack up against its neighbors? Compare key performance metrics like average monthly revenue, ADR, and occupancy rates in surrounding areas to understand the broader regional STR landscape.
| Market | Active Properties | Monthly Revenue | Daily Rate | Avg. Occupancy |
|---|---|---|---|---|
| Sandford | 13 | $4,097 | $208.63 | 62% |
| Coles Bay | 133 | $3,787 | $254.89 | 51% |
| Glamorgan-Spring Bay | 59 | $3,701 | $241.67 | 52% |
| Swansea | 57 | $3,006 | $262.55 | 43% |
| Bicheno | 177 | $2,935 | $183.51 | 53% |
| Break O'Day | 81 | $2,792 | $235.68 | 41% |
| Binalong Bay | 85 | $2,689 | $206.84 | 47% |
| Hobart | 1,542 | $2,513 | $176.78 | 53% |
| City of Clarence | 18 | $2,464 | $237.50 | 43% |
| Opossum Bay | 12 | $2,411 | $283.02 | 32% |