Sorell Airbnb Market Analysis 2025: Short Term Rental Data & Vacation Rental Statistics in Tasmania, Australia
Is Airbnb profitable in Sorell in 2025? Explore comprehensive Airbnb analytics for Sorell, Tasmania, Australia to uncover income potential. This 2025 STR market report for Sorell, based on AirROI data from April 2024 to March 2025, reveals key trends in the niche market of 72 active listings.
Whether you're considering an Airbnb investment in Sorell, optimizing your existing vacation rental, or exploring rental arbitrage opportunities, understanding the Sorell Airbnb data is crucial. Navigating the high regulation landscape is key to maximizing your short term rental income potential. Let's dive into the specifics.
Key Sorell Airbnb Performance Metrics Overview
Monthly Airbnb Revenue Variations & Income Potential in Sorell (2025)
Understanding the monthly revenue variations for Airbnb listings in Sorell is key to maximizing your short term rental income potential. Seasonality significantly impacts earnings. Our analysis, based on data from the past 12 months, shows that the peak revenue month for STRs in Sorell is typically January, while August often presents the lowest earnings, highlighting opportunities for strategic pricing adjustments during shoulder and low seasons. Explore the typical Airbnb income in Sorell across different performance tiers:
- Best-in-class properties (Top 10%) achieve $4,911+ monthly, often utilizing dynamic pricing and superior guest experiences.
- Strong performing properties (Top 25%) earn $3,454 or more, indicating effective management and desirable locations/amenities.
- Typical properties (Median) generate around $2,071 per month, representing the average market performance.
- Entry-level properties (Bottom 25%) see earnings around $1,157, often with potential for optimization.
Average Monthly Airbnb Earnings Trend in Sorell
Sorell Airbnb Occupancy Rate Trends (2025)
Maximize your bookings by understanding the Sorell STR occupancy trends. Seasonal demand shifts significantly influence how often properties are booked. Typically, Januarysees the highest demand (peak season occupancy), while August experiences the lowest (low season). Effective strategies, like adjusting minimum stays or offering promotions, can boost occupancy during slower periods. Here's how different property tiers perform in Sorell:
- Best-in-class properties (Top 10%) achieve 78%+ occupancy, indicating high desirability and potentially optimized availability.
- Strong performing properties (Top 25%) maintain 63% or higher occupancy, suggesting good market fit and guest satisfaction.
- Typical properties (Median) have an occupancy rate around 44%.
- Entry-level properties (Bottom 25%) average 25% occupancy, potentially facing higher vacancy.
Average Monthly Occupancy Rate Trend in Sorell
Average Daily Rate (ADR) Airbnb Trends in Sorell (2025)
Effective short term rental pricing strategy in Sorell involves understanding monthly ADR fluctuations. The Average Daily Rate (ADR) for Airbnb in Sorell typically peaks in January and dips lowest during August. Leveraging Airbnb dynamic pricing tools or strategies based on this seasonality can significantly boost revenue. Here's a look at the typical nightly rates achieved:
- Best-in-class properties (Top 10%) command rates of $267+ per night, often due to premium features or locations.
- Strong performing properties (Top 25%) achieve nightly rates of $204 or more.
- Typical properties (Median) charge around $143 per night.
- Entry-level properties (Bottom 25%) earn around $106 per night.
Average Daily Rate (ADR) Trend by Month in Sorell
Get Live Sorell Market Intelligence 👇

Explore Real-time Analytics
Airbnb Seasonality Analysis & Trends in Sorell (2025)
Peak Season (January, December, February)
- Revenue averages $3,683 per month
- Occupancy rates average 61.0%
- Daily rates average $193
Shoulder Season
- Revenue averages $2,402 per month
- Occupancy maintains around 40.7%
- Daily rates hold near $162
Low Season (July, August, November)
- Revenue drops to average $1,888 per month
- Occupancy decreases to average 36.5%
- Daily rates adjust to average $163
Seasonality Insights for Sorell
- The Airbnb seasonality in Sorell shows highly seasonal trends requiring careful strategy. While the sections above show seasonal averages, it's also insightful to look at the extremes:
- During the high season, the absolute peak month showcases Sorell's highest earning potential, with monthly revenues capable of climbing to $4,466, occupancy reaching a high of 68.6%, and ADRs peaking at $199.
- Conversely, the slowest single month of the year, typically falling within the low season, marks the market's lowest point. In this month, revenue might dip to $1,574, occupancy could drop to 32.5%, and ADRs may adjust down to $157.
- Understanding both the seasonal averages and these monthly peaks and troughs in revenue, occupancy, and ADR is crucial for maximizing your Airbnb profit potential in Sorell.
Seasonal Strategies for Maximizing Profit
- Peak Season: Maximize revenue through premium pricing and potentially longer minimum stays. Ensure high availability.
- Low Season: Offer competitive pricing, special promotions (e.g., extended stay discounts), and flexible cancellation policies. Target off-season travelers like remote workers or budget-conscious guests.
- Shoulder Seasons: Implement dynamic pricing that balances peak and low rates. Target weekend travelers or specific events. Offer slightly more flexible terms than peak season.
- Regularly analyze your own performance against these Sorell seasonality benchmarks and adjust your pricing and availability strategy accordingly.
Best Areas for Airbnb Investment in Sorell (2025)
Exploring the top neighborhoods for short-term rentals in Sorell? This section highlights key areas, outlining why they are attractive for hosts and guests, along with notable local attractions. Consider these locations based on your target guest profile and investment strategy.
| Neighborhood / Area | Why Host Here? (Target Guests & Appeal) | Key Attractions & Landmarks |
|---|---|---|
| Sorell Town Center | The bustling heart of Sorell, offering shops, cafes, and services. A key area for visitors who want to experience local culture and convenience in their stay. | Sorell Farmers Market, Sorell Memorial Hall, Sorell Arts and Crafts, local cafes and restaurants |
| Seven Mile Beach | A beautiful beach area known for its stunning coastline and recreational activities. Popular for families and beach lovers looking for a relaxing getaway. | Seven Mile Beach, local surf schools, fishing spots, scenic walking trails |
| Cambridge | A suburban area just a short drive from Hobart, known for its quiet neighborhood and proximity to both city attractions and natural beauty. | Cambridge Park, local wineries, Hobart International Airport, close to Richmond |
| Orielton Lagoon | A natural paradise that attracts nature lovers and bird watchers. Perfect for those looking for tranquility and outdoor experiences. | Orielton Lagoon, bird watching, fishing spots, walking trails around the lagoon |
| Dunalley | A quaint coastal town famous for its seafood community. Offers a unique seaside experience and a chance to explore the Tasman Peninsula. | Dunalley Canal, local seafood restaurants, fishing experiences, historic sites in the area |
| Fortescue Bay | A picturesque spot within the Tasman National Park, ideal for adventurous travelers and nature enthusiasts seeking stunning scenery. | Fortescue Bay Beach, hiking trails, camping areas, wildlife spotting |
| Bangor | A rural area famous for its vineyards and orchards. Attracts guests looking for a countryside retreat with wine and food experiences. | Bangor Vineyard, local farms, wine tasting, scenic views |
| Risdon Cove | A historical site that offers a glimpse into Tasmania's colonial past, attracting tourists interested in history and culture. | Risdon Cove Historic Site, Heritage tours, local parks, river walks |
Understanding Airbnb License Requirements & STR Laws in Sorell (2025)
Yes, Sorell, Tasmania, Australia enforces high STR regulations. Obtaining a license and ensuring compliance is almost certainly required according to current 2025 STR laws. Always verify the latest short term rental regulations and Airbnb license requirements directly with local government authorities for Sorell to ensure full compliance before hosting.
(Source: AirROI data, 2025, based on 93% licensed listings)
Top Performing Airbnb Properties in Sorell (2025)
Benchmark your potential! Explore examples of top-performing Airbnb properties in Sorellbased on Trailing Twelve Month (TTM) revenue. Analyze their characteristics, revenue, occupancy rate, and ADR to understand what drives success in this market.

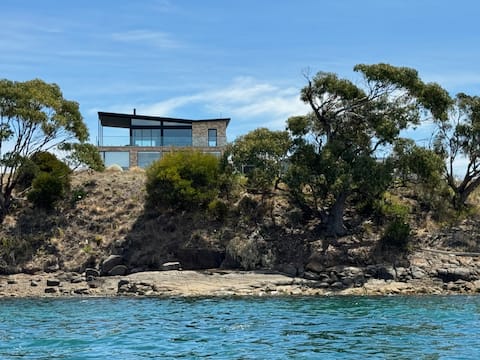
Steeles Island Retreat - Homestead
Entire Place • 7 bedrooms
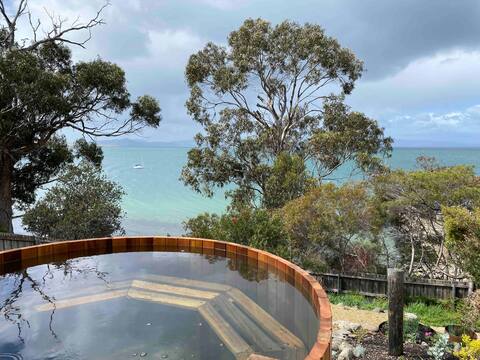
Waterfront 'Tupelo' on Primrose Point
Entire Place • 3 bedrooms
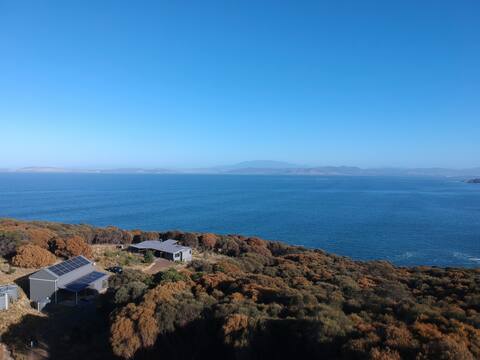
Eco Waterfront Seclusion - Carlton Bluff House
Entire Place • 3 bedrooms
‘The Lady’ Primrose Sands
Entire Place • 1 bedroom
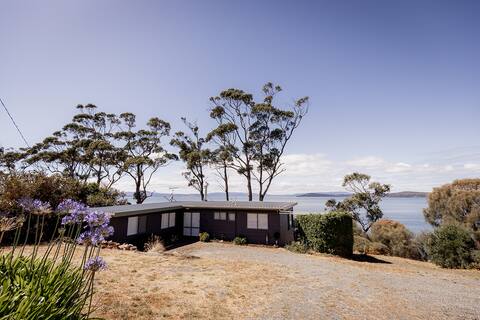
'Lazy Susan's' Waterfront Shack
Entire Place • 3 bedrooms
Luna Lodge Tasmania - Tranquility Dome
Entire Place • 1 bedroom
Note: Performance varies based on location, size, amenities, seasonality, and management quality. Data reflects the past 12 months.
Top Performing Airbnb Hosts in Sorell (2025)
Learn from the best! This table showcases top-performing Airbnb hosts in Sorell based on the number of properties managed and estimated total revenue over the past year. Analyze their scale and performance metrics.
| Host Name | Properties | Grossing Revenue | Stay Reviews | Avg Rating |
|---|---|---|---|---|
| Macy | 6 | $266,417 | 288 | 4.89/5.0 |
| Claire | 2 | $159,498 | 41 | 4.46/5.0 |
| Tom | 2 | $77,848 | 66 | 4.99/5.0 |
| Kirrilee | 2 | $74,041 | 184 | 4.94/5.0 |
| Freycinet Holiday Houses | 2 | $58,723 | 184 | 4.71/5.0 |
| Ally | 1 | $56,497 | 95 | 4.95/5.0 |
| Angela And Sam | 1 | $55,670 | 33 | 4.79/5.0 |
| Sarah | 1 | $48,852 | 217 | 4.97/5.0 |
| Sue | 1 | $47,218 | 44 | 4.93/5.0 |
| Kathryn | 2 | $46,437 | 58 | 4.71/5.0 |
Analyzing the strategies of top hosts, such as their property selection, pricing, and guest communication, can offer valuable lessons for optimizing your own Airbnb operations in Sorell.
Dive Deeper: Advanced Sorell STR Market Data (2025)
Ready to unlock more insights? AirROI provides access to advanced metrics and comprehensive Airbnb data for Sorell. Explore detailed analytics beyond this report to refine your investment strategy, optimize pricing, and maximize your vacation rental profits.
Explore Advanced MetricsSorell Short-Term Rental Market Composition (2025): Property & Room Types
Room Type Distribution
Property Type Distribution
Market Composition Insights for Sorell
- The Sorell Airbnb market composition is heavily skewed towards Entire Home/Apt listings, which make up 97.2% of the 72 active rentals. This indicates strong guest preference for privacy and space.
- Looking at the property type distribution in Sorell, House properties are the most common (73.6%), reflecting the local real estate landscape.
- Houses represent a significant 73.6% portion, catering likely to families or larger groups.
- The presence of 5.6% Hotel/Boutique listings indicates integration with traditional hospitality.
- Smaller segments like apartment/condo, unique stays (combined 4.2%) offer potential for unique stay experiences.
Sorell Airbnb Room Capacity Analysis (2025): Bedroom Distribution
Distribution of Listings by Number of Bedrooms
Room Capacity Insights for Sorell
- The dominant room capacity in Sorell is 2 bedrooms listings, making up 34.7% of the market. This suggests a strong demand for properties suitable for couples or solo travelers.
- Together, 2 bedrooms and 1 bedroom properties represent 63.9% of the active Airbnb listings in Sorell, indicating a high concentration in these sizes.
- A significant 34.7% of listings offer 3+ bedrooms, catering to larger groups and families seeking more space in Sorell.
Sorell Vacation Rental Guest Capacity Trends (2025)
Distribution of Listings by Guest Capacity
Guest Capacity Insights for Sorell
- The most common guest capacity trend in Sorell vacation rentals is listings accommodating 2 guests (26.4%). This suggests the primary traveler segment is likely couples or solo travelers.
- Properties designed for 2 guests and 6 guests dominate the Sorell STR market, accounting for 52.8% of listings.
- 41.7% of properties accommodate 6+ guests, serving the market segment for larger families or group travel in Sorell.
- On average, properties in Sorell are equipped to host 4.7 guests.
Sorell Airbnb Booking Patterns (2025): Available vs. Booked Days
Available Days Distribution
Booked Days Distribution
Booking Pattern Insights for Sorell
- The most common availability pattern in Sorell falls within the 181-270 days range, representing 41.7% of listings. This suggests many properties have significant open periods on their calendars.
- Approximately 69.5% of listings show high availability (181+ days open annually), indicating potential for increased bookings or specific owner usage patterns.
- For booked days, the 91-180 days range is most frequent in Sorell (41.7%), reflecting common guest stay durations or potential owner blocking patterns.
- A notable 30.6% of properties secure long booking periods (181+ days booked per year), highlighting successful long-term rental strategies or significant owner usage.
Sorell Airbnb Minimum Stay Requirements Analysis
Distribution of Listings by Minimum Night Requirement
1 Night
14 listings
20.6% of total
2 Nights
38 listings
55.9% of total
3 Nights
4 listings
5.9% of total
4-6 Nights
1 listings
1.5% of total
30+ Nights
11 listings
16.2% of total
Key Insights
- The most prevalent minimum stay requirement in Sorell is 2 Nights, adopted by 55.9% of listings. This highlights the market's preference for shorter, flexible bookings.
- A strong majority (76.5%) of the Sorell Airbnb data shows acceptance of very short stays (1-2 nights), indicating a dynamic, high-turnover market.
- A significant segment (16.2%) caters to monthly stays (30+ nights) in Sorell, pointing to opportunities in the extended-stay market.
Recommendations
- Align with the market by considering a 2 Nights minimum stay, as 55.9% of Sorell hosts use this setting.
- If feasible, allowing 1-night stays, especially midweek or during low season, could capture last-minute bookings, as only 20.6% currently do.
- Explore offering discounts for stays of 30+ nights to attract the 16.2% of the market seeking extended stays.
- Adjust minimum nights based on seasonality – potentially shorter during low season and longer during peak demand periods in Sorell.
Sorell Airbnb Cancellation Policy Trends Analysis (2025)
Super Strict 30 Days
3 listings
4.3% of total
Flexible
16 listings
22.9% of total
Moderate
19 listings
27.1% of total
Firm
22 listings
31.4% of total
Strict
10 listings
14.3% of total
Cancellation Policy Insights for Sorell
- The prevailing Airbnb cancellation policy trend in Sorell is Firm, used by 31.4% of listings.
- There's a relatively balanced mix between guest-friendly (50.0%) and stricter (45.7%) policies, offering choices for different guest needs.
Recommendations for Hosts
- Consider adopting a Firm policy to align with the 31.4% market standard in Sorell.
- Using a Strict policy might deter some guests, as only 14.3% of listings use it. Evaluate if potential revenue protection outweighs possible lower booking rates.
- Regularly review your cancellation policy against competitors and market demand shifts in Sorell.
Sorell STR Booking Lead Time Analysis (2025)
Average Booking Lead Time by Month
Booking Lead Time Insights for Sorell
- The overall average booking lead time for vacation rentals in Sorell is 55 days.
- Guests book furthest in advance for stays during December (average 86 days), likely coinciding with peak travel demand or local events.
- The shortest booking windows occur for stays in August (average 35 days), indicating more last-minute travel plans during this time.
- Seasonally, Winter (74 days avg.) sees the longest lead times, while Summer (49 days avg.) has the shortest, reflecting typical travel planning cycles.
Recommendations for Hosts
- Use the overall average lead time (55 days) as a baseline for your pricing and availability strategy in Sorell.
- For December stays, consider implementing length-of-stay discounts or slightly higher rates for bookings made less than 86 days out to capitalize on advance planning.
- Target marketing efforts for the Winter season well in advance (at least 74 days) to capture early planners.
- Monitor your own booking lead times against these Sorell averages to identify opportunities for dynamic pricing adjustments.
Popular & Essential Airbnb Amenities in Sorell (2025)
Amenity Prevalence
Amenity Insights for Sorell
- Essential amenities in Sorell that guests expect include: Heating, Dishes and silverware, Smoke alarm, Free parking on premises, Kitchen. Lacking these (any) could significantly impact bookings.
- Popular amenities like Hot water, Essentials, Refrigerator are common but not universal. Offering these can provide a competitive edge.
Recommendations for Hosts
- Ensure your listing includes all essential amenities for Sorell: Heating, Dishes and silverware, Smoke alarm, Free parking on premises, Kitchen.
- Prioritize adding missing essentials: Dishes and silverware, Smoke alarm, Free parking on premises, Kitchen.
- Consider adding popular differentiators like Hot water or Essentials to increase appeal.
- Highlight unique or less common amenities you offer (e.g., hot tub, dedicated workspace, EV charger) in your listing description and photos.
- Regularly check competitor amenities in Sorell to stay competitive.
Sorell Airbnb Guest Demographics & Profile Analysis (2025)
Guest Profile Summary for Sorell
- The typical guest profile for Airbnb in Sorell consists of primarily domestic travelers (82%), often arriving from nearby Hobart, typically belonging to the Post-2000s (Gen Z/Alpha) group (50%), primarily speaking English or Chinese.
- Domestic travelers account for 81.5% of guests.
- Key international markets include Australia (81.5%) and United Kingdom (3.2%).
- Top languages spoken are English (67.2%) followed by Chinese (10.1%).
- A significant demographic segment is the Post-2000s (Gen Z/Alpha) group, representing 50% of guests.
Recommendations for Hosts
- Target domestic marketing efforts towards travelers from Hobart and Sydney.
- Tailor amenities and listing descriptions to appeal to the dominant Post-2000s (Gen Z/Alpha) demographic (e.g., highlight fast WiFi, smart home features, local guides).
- Highlight unique local experiences or amenities relevant to the primary guest profile.
- Consider seasonal promotions aligned with peak travel times for key origin markets.
Nearby Short-Term Rental Market Comparison
How does the Sorell Airbnb market stack up against its neighbors? Compare key performance metrics like average monthly revenue, ADR, and occupancy rates in surrounding areas to understand the broader regional STR landscape.
| Market | Active Properties | Monthly Revenue | Daily Rate | Avg. Occupancy |
|---|---|---|---|---|
| Sandford | 13 | $4,097 | $208.63 | 62% |
| Coles Bay | 133 | $3,787 | $254.89 | 51% |
| Glamorgan-Spring Bay | 59 | $3,701 | $241.67 | 52% |
| Adventure Bay | 44 | $3,142 | $196.60 | 52% |
| Alonnah | 42 | $3,009 | $215.21 | 45% |
| Swansea | 57 | $3,006 | $262.55 | 43% |
| Bicheno | 177 | $2,935 | $183.51 | 53% |
| Kentish | 66 | $2,894 | $190.06 | 53% |
| Break O'Day | 81 | $2,792 | $235.68 | 41% |
| Binalong Bay | 85 | $2,689 | $206.84 | 47% |