Kingborough Airbnb Market Analysis 2025: Short Term Rental Data & Vacation Rental Statistics in Tasmania, Australia
Is Airbnb profitable in Kingborough in 2025? Explore comprehensive Airbnb analytics for Kingborough, Tasmania, Australia to uncover income potential. This 2025 STR market report for Kingborough, based on AirROI data from April 2024 to March 2025, reveals key trends in the niche market of 87 active listings.
Whether you're considering an Airbnb investment in Kingborough, optimizing your existing vacation rental, or exploring rental arbitrage opportunities, understanding the Kingborough Airbnb data is crucial. Navigating the high regulation landscape is key to maximizing your short term rental income potential. Let's dive into the specifics.
Key Kingborough Airbnb Performance Metrics Overview
Monthly Airbnb Revenue Variations & Income Potential in Kingborough (2025)
Understanding the monthly revenue variations for Airbnb listings in Kingborough is key to maximizing your short term rental income potential. Seasonality significantly impacts earnings. Our analysis, based on data from the past 12 months, shows that the peak revenue month for STRs in Kingborough is typically January, while August often presents the lowest earnings, highlighting opportunities for strategic pricing adjustments during shoulder and low seasons. Explore the typical Airbnb income in Kingborough across different performance tiers:
- Best-in-class properties (Top 10%) achieve $5,575+ monthly, often utilizing dynamic pricing and superior guest experiences.
- Strong performing properties (Top 25%) earn $4,233 or more, indicating effective management and desirable locations/amenities.
- Typical properties (Median) generate around $2,570 per month, representing the average market performance.
- Entry-level properties (Bottom 25%) see earnings around $1,454, often with potential for optimization.
Average Monthly Airbnb Earnings Trend in Kingborough
Kingborough Airbnb Occupancy Rate Trends (2025)
Maximize your bookings by understanding the Kingborough STR occupancy trends. Seasonal demand shifts significantly influence how often properties are booked. Typically, Januarysees the highest demand (peak season occupancy), while June experiences the lowest (low season). Effective strategies, like adjusting minimum stays or offering promotions, can boost occupancy during slower periods. Here's how different property tiers perform in Kingborough:
- Best-in-class properties (Top 10%) achieve 82%+ occupancy, indicating high desirability and potentially optimized availability.
- Strong performing properties (Top 25%) maintain 63% or higher occupancy, suggesting good market fit and guest satisfaction.
- Typical properties (Median) have an occupancy rate around 43%.
- Entry-level properties (Bottom 25%) average 23% occupancy, potentially facing higher vacancy.
Average Monthly Occupancy Rate Trend in Kingborough
Average Daily Rate (ADR) Airbnb Trends in Kingborough (2025)
Effective short term rental pricing strategy in Kingborough involves understanding monthly ADR fluctuations. The Average Daily Rate (ADR) for Airbnb in Kingborough typically peaks in January and dips lowest during September. Leveraging Airbnb dynamic pricing tools or strategies based on this seasonality can significantly boost revenue. Here's a look at the typical nightly rates achieved:
- Best-in-class properties (Top 10%) command rates of $336+ per night, often due to premium features or locations.
- Strong performing properties (Top 25%) achieve nightly rates of $248 or more.
- Typical properties (Median) charge around $189 per night.
- Entry-level properties (Bottom 25%) earn around $142 per night.
Average Daily Rate (ADR) Trend by Month in Kingborough
Get Live Kingborough Market Intelligence 👇

Explore Real-time Analytics
Airbnb Seasonality Analysis & Trends in Kingborough (2025)
Peak Season (January, December, April)
- Revenue averages $3,994 per month
- Occupancy rates average 54.1%
- Daily rates average $227
Shoulder Season
- Revenue averages $3,026 per month
- Occupancy maintains around 41.9%
- Daily rates hold near $211
Low Season (August, September, October)
- Revenue drops to average $2,324 per month
- Occupancy decreases to average 39.1%
- Daily rates adjust to average $205
Seasonality Insights for Kingborough
- The Airbnb seasonality in Kingborough shows highly seasonal trends requiring careful strategy. While the sections above show seasonal averages, it's also insightful to look at the extremes:
- During the high season, the absolute peak month showcases Kingborough's highest earning potential, with monthly revenues capable of climbing to $4,382, occupancy reaching a high of 62.0%, and ADRs peaking at $240.
- Conversely, the slowest single month of the year, typically falling within the low season, marks the market's lowest point. In this month, revenue might dip to $2,080, occupancy could drop to 32.8%, and ADRs may adjust down to $203.
- Understanding both the seasonal averages and these monthly peaks and troughs in revenue, occupancy, and ADR is crucial for maximizing your Airbnb profit potential in Kingborough.
Seasonal Strategies for Maximizing Profit
- Peak Season: Maximize revenue through premium pricing and potentially longer minimum stays. Ensure high availability.
- Low Season: Offer competitive pricing, special promotions (e.g., extended stay discounts), and flexible cancellation policies. Target off-season travelers like remote workers or budget-conscious guests.
- Shoulder Seasons: Implement dynamic pricing that balances peak and low rates. Target weekend travelers or specific events. Offer slightly more flexible terms than peak season.
- Regularly analyze your own performance against these Kingborough seasonality benchmarks and adjust your pricing and availability strategy accordingly.
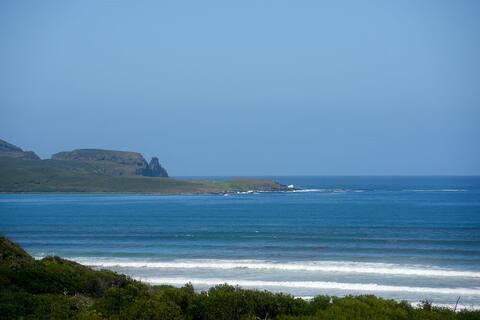
Best Areas for Airbnb Investment in Kingborough (2025)
Exploring the top neighborhoods for short-term rentals in Kingborough? This section highlights key areas, outlining why they are attractive for hosts and guests, along with notable local attractions. Consider these locations based on your target guest profile and investment strategy.
| Neighborhood / Area | Why Host Here? (Target Guests & Appeal) | Key Attractions & Landmarks |
|---|---|---|
| Kingston | Kingston is a vibrant coastal suburb with beautiful beaches, parks, and family-friendly amenities. It is a popular destination for tourists and locals alike, making it ideal for Airbnb hosting. | Kingston Beach, Snug Beach, Kingston Park, Channel Court Shopping Centre, Kingston Golf Club, Hartz Mountains National Park |
| Blackmans Bay | Known for its stunning beach and coastal views, Blackmans Bay is attractive for families and beach lovers. It has a relaxed atmosphere and good access to nature, making it a great place for short-term stays. | Blackmans Bay Beach, Mountain River, Blackmans Bay Surf Life Saving Club, Huntington Estate, Ellis Beach |
| Snug | A picturesque village close to the water, Snug offers a quieter alternative for guests wishing for a peaceful getaway while being close to attractions in the greater Kingborough area. | Snug Beach, Snug Falls, Kingston Beach, Royal Hobart Golf Club, Snug River |
| Taroona | Nestled between the Derwent River and Mount Nelson, Taroona is known for its scenic beauty and nature walks. It attracts visitors looking for a retreat close to nature. | Taroona Beach, The Shot Tower, Riverview Park, Taroona High School, Hampden Road |
| Margate | Margate is famous for its community vibe and local markets. It appeals to tourists who are interested in local culture, arts, and food. | Margate Train, Margate Beach, Margate Markets, Holyrood Beach, Margate Cultural Centre |
| Cygnet | Cygnet is known for its thriving arts scene, picturesque landscapes, and close-knit community. It attracts those looking for a unique, cultural experience in Tasmania. | Cygnet Market, Cygnet Bay, Cygnet Port, Cygnet Folk Festival, Donkeywood |
| Grove | Situated near the Huon Valley, Grove is great for guests who wish to explore beautiful natural landscapes, including orchards and bushland, and experience Tasmanian produce. | Grove Heritage Centre, Cascades Female Factory Historic Site, Huon Valley Winery, Local Orchards, Walking Trails |
| South Arm | South Arm is a tranquil escape known for its stunning beaches and nature reserves. It's a great destination for those seeking a relaxing stay with easy access to the outdoors. | South Arm Beach, South Arm Peninsula, North West Bay River, Bivouac Bay, Nearby walking trails |
Understanding Airbnb License Requirements & STR Laws in Kingborough (2025)
Yes, Kingborough, Tasmania, Australia enforces high STR regulations. Obtaining a license and ensuring compliance is almost certainly required according to current 2025 STR laws. Always verify the latest short term rental regulations and Airbnb license requirements directly with local government authorities for Kingborough to ensure full compliance before hosting.
(Source: AirROI data, 2025, based on 90% licensed listings)
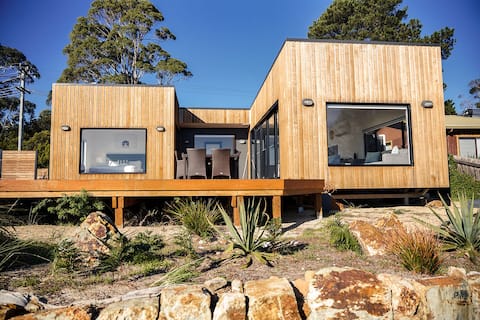
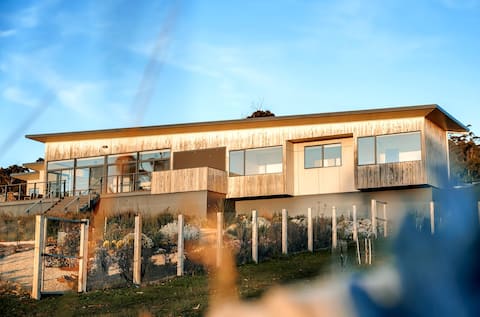
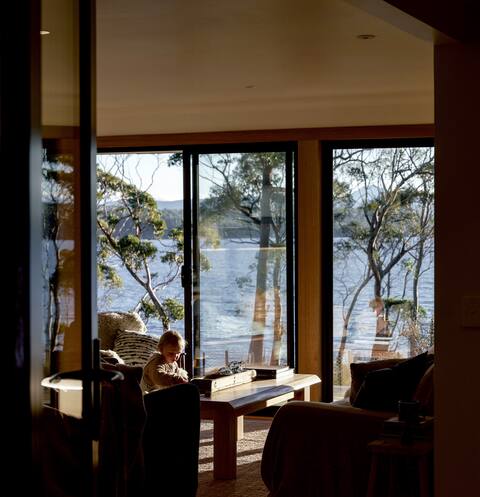
Top Performing Airbnb Properties in Kingborough (2025)
Benchmark your potential! Explore examples of top-performing Airbnb properties in Kingboroughbased on Trailing Twelve Month (TTM) revenue. Analyze their characteristics, revenue, occupancy rate, and ADR to understand what drives success in this market.
Cloudy Bay Beach House
Entire Place • 4 bedrooms

Apollo Bay House
Entire Place • 3 bedrooms
The Nebraska Retreat
Entire Place • 3 bedrooms
Apollo's Rest
Entire Place • 3 bedrooms
Absolute water front home "Salty Seas"
Entire Place • 2 bedrooms

The Stone Cottage - Bruny Island
Entire Place • 3 bedrooms
Note: Performance varies based on location, size, amenities, seasonality, and management quality. Data reflects the past 12 months.
Top Performing Airbnb Hosts in Kingborough (2025)
Learn from the best! This table showcases top-performing Airbnb hosts in Kingborough based on the number of properties managed and estimated total revenue over the past year. Analyze their scale and performance metrics.
| Host Name | Properties | Grossing Revenue | Stay Reviews | Avg Rating |
|---|---|---|---|---|
| Sarah | 15 | $700,415 | 758 | 4.75/5.0 |
| Ben | 8 | $278,230 | 85 | 4.07/5.0 |
| David | 5 | $133,719 | 417 | 4.64/5.0 |
| Rachel | 2 | $79,163 | 228 | 4.99/5.0 |
| Ruby | 1 | $70,999 | 71 | 5.00/5.0 |
| Con | 1 | $65,083 | 267 | 4.92/5.0 |
| Jason | 1 | $60,131 | 76 | 4.92/5.0 |
| Edward | 1 | $52,088 | 67 | 4.96/5.0 |
| Wina | 1 | $47,693 | 52 | 4.98/5.0 |
| Jude | 1 | $46,226 | 50 | 5.00/5.0 |
Analyzing the strategies of top hosts, such as their property selection, pricing, and guest communication, can offer valuable lessons for optimizing your own Airbnb operations in Kingborough.
Dive Deeper: Advanced Kingborough STR Market Data (2025)
Ready to unlock more insights? AirROI provides access to advanced metrics and comprehensive Airbnb data for Kingborough. Explore detailed analytics beyond this report to refine your investment strategy, optimize pricing, and maximize your vacation rental profits.
Explore Advanced MetricsKingborough Short-Term Rental Market Composition (2025): Property & Room Types
Room Type Distribution
Property Type Distribution
Market Composition Insights for Kingborough
- The Kingborough Airbnb market composition is heavily skewed towards Entire Home/Apt listings, which make up 98.9% of the 87 active rentals. This indicates strong guest preference for privacy and space.
- Looking at the property type distribution in Kingborough, House properties are the most common (74.7%), reflecting the local real estate landscape.
- Houses represent a significant 74.7% portion, catering likely to families or larger groups.
- The presence of 9.2% Hotel/Boutique listings indicates integration with traditional hospitality.
- Smaller segments like apartment/condo, others (combined 3.4%) offer potential for unique stay experiences.
Kingborough Airbnb Room Capacity Analysis (2025): Bedroom Distribution
Distribution of Listings by Number of Bedrooms
Room Capacity Insights for Kingborough
- The dominant room capacity in Kingborough is 2 bedrooms listings, making up 32.2% of the market. This suggests a strong demand for properties suitable for couples or solo travelers.
- Together, 2 bedrooms and 3 bedrooms properties represent 59.8% of the active Airbnb listings in Kingborough, indicating a high concentration in these sizes.
- A significant 37.9% of listings offer 3+ bedrooms, catering to larger groups and families seeking more space in Kingborough.
Kingborough Vacation Rental Guest Capacity Trends (2025)
Distribution of Listings by Guest Capacity
Guest Capacity Insights for Kingborough
- The most common guest capacity trend in Kingborough vacation rentals is listings accommodating 4 guests (31%). This suggests the primary traveler segment is likely small families or groups.
- Properties designed for 4 guests and 6 guests dominate the Kingborough STR market, accounting for 55.1% of listings.
- 37.9% of properties accommodate 6+ guests, serving the market segment for larger families or group travel in Kingborough.
- On average, properties in Kingborough are equipped to host 4.6 guests.
Kingborough Airbnb Booking Patterns (2025): Available vs. Booked Days
Available Days Distribution
Booked Days Distribution
Booking Pattern Insights for Kingborough
- The most common availability pattern in Kingborough falls within the 181-270 days range, representing 33.3% of listings. This suggests many properties have significant open periods on their calendars.
- Approximately 62.0% of listings show high availability (181+ days open annually), indicating potential for increased bookings or specific owner usage patterns.
- For booked days, the 91-180 days range is most frequent in Kingborough (31%), reflecting common guest stay durations or potential owner blocking patterns.
- A notable 40.2% of properties secure long booking periods (181+ days booked per year), highlighting successful long-term rental strategies or significant owner usage.
Kingborough Airbnb Minimum Stay Requirements Analysis
Distribution of Listings by Minimum Night Requirement
1 Night
15 listings
17.9% of total
2 Nights
52 listings
61.9% of total
3 Nights
1 listings
1.2% of total
30+ Nights
16 listings
19% of total
Key Insights
- The most prevalent minimum stay requirement in Kingborough is 2 Nights, adopted by 61.9% of listings. This highlights the market's preference for shorter, flexible bookings.
- A strong majority (79.8%) of the Kingborough Airbnb data shows acceptance of very short stays (1-2 nights), indicating a dynamic, high-turnover market.
- A significant segment (19%) caters to monthly stays (30+ nights) in Kingborough, pointing to opportunities in the extended-stay market.
Recommendations
- Align with the market by considering a 2 Nights minimum stay, as 61.9% of Kingborough hosts use this setting.
- If feasible, allowing 1-night stays, especially midweek or during low season, could capture last-minute bookings, as only 17.9% currently do.
- A 2-night minimum appears standard (61.9%). Consider this for weekends or peak periods.
- Explore offering discounts for stays of 30+ nights to attract the 19% of the market seeking extended stays.
- Adjust minimum nights based on seasonality – potentially shorter during low season and longer during peak demand periods in Kingborough.
Kingborough Airbnb Cancellation Policy Trends Analysis (2025)
Super Strict 60 Days
7 listings
8.5% of total
Super Strict 30 Days
1 listings
1.2% of total
Flexible
9 listings
11% of total
Moderate
34 listings
41.5% of total
Firm
7 listings
8.5% of total
Strict
24 listings
29.3% of total
Cancellation Policy Insights for Kingborough
- The prevailing Airbnb cancellation policy trend in Kingborough is Moderate, used by 41.5% of listings.
- There's a relatively balanced mix between guest-friendly (52.5%) and stricter (37.8%) policies, offering choices for different guest needs.
Recommendations for Hosts
- Consider adopting a Moderate policy to align with the 41.5% market standard in Kingborough.
- Regularly review your cancellation policy against competitors and market demand shifts in Kingborough.
Kingborough STR Booking Lead Time Analysis (2025)
Average Booking Lead Time by Month
Booking Lead Time Insights for Kingborough
- The overall average booking lead time for vacation rentals in Kingborough is 61 days.
- Guests book furthest in advance for stays during December (average 86 days), likely coinciding with peak travel demand or local events.
- The shortest booking windows occur for stays in August (average 37 days), indicating more last-minute travel plans during this time.
- Seasonally, Winter (77 days avg.) sees the longest lead times, while Summer (53 days avg.) has the shortest, reflecting typical travel planning cycles.
Recommendations for Hosts
- Use the overall average lead time (61 days) as a baseline for your pricing and availability strategy in Kingborough.
- For December stays, consider implementing length-of-stay discounts or slightly higher rates for bookings made less than 86 days out to capitalize on advance planning.
- Target marketing efforts for the Winter season well in advance (at least 77 days) to capture early planners.
- Monitor your own booking lead times against these Kingborough averages to identify opportunities for dynamic pricing adjustments.
Popular & Essential Airbnb Amenities in Kingborough (2025)
Amenity Prevalence
Amenity Insights for Kingborough
- Popular amenities like Refrigerator, Heating, Cooking basics are common but not universal. Offering these can provide a competitive edge.
Recommendations for Hosts
- Consider adding popular differentiators like Refrigerator or Heating to increase appeal.
- Highlight unique or less common amenities you offer (e.g., hot tub, dedicated workspace, EV charger) in your listing description and photos.
- Regularly check competitor amenities in Kingborough to stay competitive.
Kingborough Airbnb Guest Demographics & Profile Analysis (2025)
Guest Profile Summary for Kingborough
- The typical guest profile for Airbnb in Kingborough consists of primarily domestic travelers (85%), often arriving from nearby Hobart, typically belonging to the Post-2000s (Gen Z/Alpha) group (50%), primarily speaking English or Chinese.
- Domestic travelers account for 84.7% of guests.
- Key international markets include Australia (84.7%) and United Kingdom (2.9%).
- Top languages spoken are English (69.8%) followed by Chinese (7.8%).
- A significant demographic segment is the Post-2000s (Gen Z/Alpha) group, representing 50% of guests.
Recommendations for Hosts
- Target domestic marketing efforts towards travelers from Hobart and Sydney.
- Tailor amenities and listing descriptions to appeal to the dominant Post-2000s (Gen Z/Alpha) demographic (e.g., highlight fast WiFi, smart home features, local guides).
- Highlight unique local experiences or amenities relevant to the primary guest profile.
- Consider seasonal promotions aligned with peak travel times for key origin markets.
Nearby Short-Term Rental Market Comparison
How does the Kingborough Airbnb market stack up against its neighbors? Compare key performance metrics like average monthly revenue, ADR, and occupancy rates in surrounding areas to understand the broader regional STR landscape.
| Market | Active Properties | Monthly Revenue | Daily Rate | Avg. Occupancy |
|---|---|---|---|---|
| Sandford | 13 | $4,097 | $208.63 | 62% |
| Coles Bay | 133 | $3,787 | $254.89 | 51% |
| Glamorgan-Spring Bay | 59 | $3,701 | $241.67 | 52% |
| Adventure Bay | 44 | $3,142 | $196.60 | 52% |
| Alonnah | 42 | $3,009 | $215.21 | 45% |
| Swansea | 57 | $3,006 | $262.55 | 43% |
| Central Highlands | 22 | $2,596 | $176.64 | 44% |
| Cygnet | 17 | $2,514 | $176.80 | 49% |
| South Arm | 12 | $2,513 | $173.02 | 48% |
| Hobart | 1,542 | $2,513 | $176.78 | 53% |