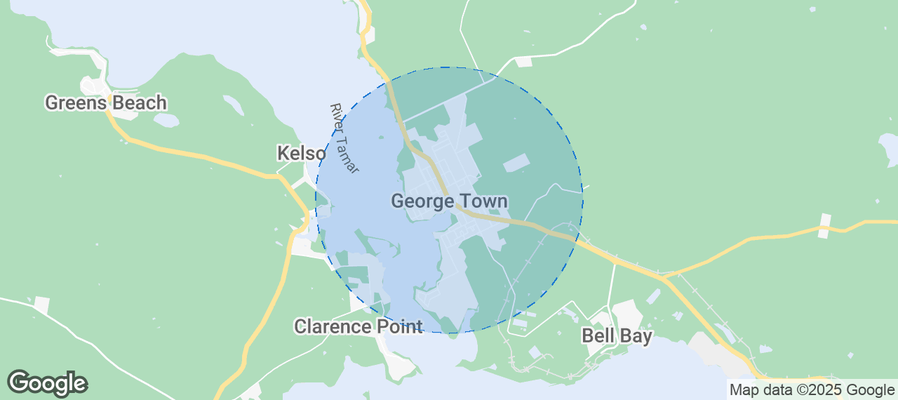
George Town Airbnb Market Analysis 2025: Short Term Rental Data & Vacation Rental Statistics in Tasmania, Australia
Is Airbnb profitable in George Town in 2025? Explore comprehensive Airbnb analytics for George Town, Tasmania, Australia to uncover income potential. This 2025 STR market report for George Town, based on AirROI data from April 2024 to March 2025, reveals key trends in the niche market of 22 active listings.
Whether you're considering an Airbnb investment in George Town, optimizing your existing vacation rental, or exploring rental arbitrage opportunities, understanding the George Town Airbnb data is crucial. Navigating the high regulation landscape is key to maximizing your short term rental income potential. Let's dive into the specifics.
Key George Town Airbnb Performance Metrics Overview
Monthly Airbnb Revenue Variations & Income Potential in George Town (2025)
Understanding the monthly revenue variations for Airbnb listings in George Town is key to maximizing your short term rental income potential. Seasonality significantly impacts earnings. Our analysis, based on data from the past 12 months, shows that the peak revenue month for STRs in George Town is typically January, while September often presents the lowest earnings, highlighting opportunities for strategic pricing adjustments during shoulder and low seasons. Explore the typical Airbnb income in George Town across different performance tiers:
- Best-in-class properties (Top 10%) achieve $3,849+ monthly, often utilizing dynamic pricing and superior guest experiences.
- Strong performing properties (Top 25%) earn $2,633 or more, indicating effective management and desirable locations/amenities.
- Typical properties (Median) generate around $1,589 per month, representing the average market performance.
- Entry-level properties (Bottom 25%) see earnings around $904, often with potential for optimization.
Average Monthly Airbnb Earnings Trend in George Town
George Town Airbnb Occupancy Rate Trends (2025)
Maximize your bookings by understanding the George Town STR occupancy trends. Seasonal demand shifts significantly influence how often properties are booked. Typically, Decembersees the highest demand (peak season occupancy), while May experiences the lowest (low season). Effective strategies, like adjusting minimum stays or offering promotions, can boost occupancy during slower periods. Here's how different property tiers perform in George Town:
- Best-in-class properties (Top 10%) achieve 75%+ occupancy, indicating high desirability and potentially optimized availability.
- Strong performing properties (Top 25%) maintain 57% or higher occupancy, suggesting good market fit and guest satisfaction.
- Typical properties (Median) have an occupancy rate around 37%.
- Entry-level properties (Bottom 25%) average 21% occupancy, potentially facing higher vacancy.
Average Monthly Occupancy Rate Trend in George Town
Average Daily Rate (ADR) Airbnb Trends in George Town (2025)
Effective short term rental pricing strategy in George Town involves understanding monthly ADR fluctuations. The Average Daily Rate (ADR) for Airbnb in George Town typically peaks in December and dips lowest during April. Leveraging Airbnb dynamic pricing tools or strategies based on this seasonality can significantly boost revenue. Here's a look at the typical nightly rates achieved:
- Best-in-class properties (Top 10%) command rates of $209+ per night, often due to premium features or locations.
- Strong performing properties (Top 25%) achieve nightly rates of $167 or more.
- Typical properties (Median) charge around $124 per night.
- Entry-level properties (Bottom 25%) earn around $98 per night.
Average Daily Rate (ADR) Trend by Month in George Town
Get Live George Town Market Intelligence 👇
Explore Real-time Analytics
Airbnb Seasonality Analysis & Trends in George Town (2025)
Peak Season (January, December, June)
- Revenue averages $2,732 per month
- Occupancy rates average 51.3%
- Daily rates average $142
Shoulder Season
- Revenue averages $1,855 per month
- Occupancy maintains around 41.3%
- Daily rates hold near $134
Low Season (May, August, September)
- Revenue drops to average $1,154 per month
- Occupancy decreases to average 28.6%
- Daily rates adjust to average $127
Seasonality Insights for George Town
- The Airbnb seasonality in George Town shows highly seasonal trends requiring careful strategy. While the sections above show seasonal averages, it's also insightful to look at the extremes:
- During the high season, the absolute peak month showcases George Town's highest earning potential, with monthly revenues capable of climbing to $2,924, occupancy reaching a high of 59.2%, and ADRs peaking at $150.
- Conversely, the slowest single month of the year, typically falling within the low season, marks the market's lowest point. In this month, revenue might dip to $1,002, occupancy could drop to 25.2%, and ADRs may adjust down to $127.
- Understanding both the seasonal averages and these monthly peaks and troughs in revenue, occupancy, and ADR is crucial for maximizing your Airbnb profit potential in George Town.
Seasonal Strategies for Maximizing Profit
- Peak Season: Maximize revenue through premium pricing and potentially longer minimum stays. Ensure high availability.
- Low Season: Offer competitive pricing, special promotions (e.g., extended stay discounts), and flexible cancellation policies. Target off-season travelers like remote workers or budget-conscious guests.
- Shoulder Seasons: Implement dynamic pricing that balances peak and low rates. Target weekend travelers or specific events. Offer slightly more flexible terms than peak season.
- Regularly analyze your own performance against these George Town seasonality benchmarks and adjust your pricing and availability strategy accordingly.
Best Areas for Airbnb Investment in George Town (2025)
Exploring the top neighborhoods for short-term rentals in George Town? This section highlights key areas, outlining why they are attractive for hosts and guests, along with notable local attractions. Consider these locations based on your target guest profile and investment strategy.
| Neighborhood / Area | Why Host Here? (Target Guests & Appeal) | Key Attractions & Landmarks |
|---|---|---|
| Battery Point | A historic neighborhood with charming cottages and waterfront views, popular among tourists for its scenic walks and proximity to the city center. | Salamanca Market, St. George's Church, Battery Point Sculpture Trail, Mawson's Huts Replica Museum, The Shipwrights Walk |
| Salamanca Place | A vibrant area known for its historic sandstone buildings, markets, and restaurants. It draws visitors looking for local culture and cuisine. | Salamanca Market, Art Galleries, Restaurants and Cafes, Salamanca Arts Centre, Theatre Royal |
| Hobart Central Business District | The heart of Hobart, this area is bustling with commerce and tourism. It offers easy access to various attractions and amenities. | Elizabeth Street, Hobart Waterfront, Hobart Convention and Entertainment Centre, Museum of Old and New Art (MONA), Franklin Wharf |
| North Hobart | A trendy suburb known for its eclectic mix of eateries, cafes, and bars. Popular with younger crowds and food enthusiasts. | North Hobart Restaurant Strip, State Cinema, The New Towner, Hill Street Grocer, North Hobart Oval |
| Sandy Bay | A picturesque seaside suburb with beautiful beaches and parks, appealing to families and those seeking relaxation. | Long Beach, Sandy Bay Beach, University of Tasmania, Sandy Bay Shopping Village, Royal Hobart Yacht Club |
| Richmond | A historic village just outside Hobart, known for its heritage architecture and charming atmosphere, attracting both tourists and history buffs. | Richmond Bridge, Richmond Gaol, Old Hobart Town Model Village, St John’s Catholic Church, Wine Tasting at Local Wineries |
| Monmouth | A quiet suburban area with attractive natural surroundings, ideal for tourists seeking a peaceful getaway yet close to Hobart's attractions. | Nearby parks, Walking trails, Local farms, Small cafes, Proximity to city areas |
| Glenorchy | An affordable area with a diverse community, providing unique experiences and a range of amenities, gaining interest from budget-conscious travelers. | Derwent Entertainment Centre, Moonah Arts Centre, Glenorchy District Football Club, Local fishing spots, Shopping centres |
Understanding Airbnb License Requirements & STR Laws in George Town (2025)
Yes, George Town, Tasmania, Australia enforces high STR regulations. Obtaining a license and ensuring compliance is almost certainly required according to current 2025 STR laws. Always verify the latest short term rental regulations and Airbnb license requirements directly with local government authorities for George Town to ensure full compliance before hosting.
(Source: AirROI data, 2025, based on 91% licensed listings)
Top Performing Airbnb Properties in George Town (2025)
Benchmark your potential! Explore examples of top-performing Airbnb properties in George Townbased on Trailing Twelve Month (TTM) revenue. Analyze their characteristics, revenue, occupancy rate, and ADR to understand what drives success in this market.

Koze Haus: Blissful Barn by the River
Entire Place • 1 bedroom

Waterfront/ Location / Lifestyle/Fire Pot
Entire Place • 4 bedrooms

Cottage on York Cove. Picturesque setting- enjoy.
Entire Place • 2 bedrooms
Ninth Island Coastal Escape: Noir Two Bedroom
Entire Place • 2 bedrooms

Family relaxation at Lulworth
Entire Place • 3 bedrooms

Brand new, central location
Entire Place • 1 bedroom
Note: Performance varies based on location, size, amenities, seasonality, and management quality. Data reflects the past 12 months.
Top Performing Airbnb Hosts in George Town (2025)
Learn from the best! This table showcases top-performing Airbnb hosts in George Town based on the number of properties managed and estimated total revenue over the past year. Analyze their scale and performance metrics.
| Host Name | Properties | Grossing Revenue | Stay Reviews | Avg Rating |
|---|---|---|---|---|
| Janmaree | 2 | $51,142 | 92 | 4.92/5.0 |
| Moxxi Property | 1 | $48,248 | 87 | 4.82/5.0 |
| Emily | 2 | $44,215 | 206 | 2.44/5.0 |
| Andrea | 2 | $36,409 | 35 | 5.00/5.0 |
| Ian | 1 | $28,453 | 140 | 4.98/5.0 |
| Erica | 1 | $23,543 | 14 | 4.93/5.0 |
| Roslyn | 1 | $20,869 | 16 | 5.00/5.0 |
| Emma | 1 | $20,142 | 321 | 4.97/5.0 |
| Laura | 1 | $20,123 | 96 | 4.96/5.0 |
| Gina | 1 | $18,885 | 9 | 4.56/5.0 |
Analyzing the strategies of top hosts, such as their property selection, pricing, and guest communication, can offer valuable lessons for optimizing your own Airbnb operations in George Town.
Dive Deeper: Advanced George Town STR Market Data (2025)
Ready to unlock more insights? AirROI provides access to advanced metrics and comprehensive Airbnb data for George Town. Explore detailed analytics beyond this report to refine your investment strategy, optimize pricing, and maximize your vacation rental profits.
Explore Advanced MetricsGeorge Town Short-Term Rental Market Composition (2025): Property & Room Types
Room Type Distribution
Property Type Distribution
Market Composition Insights for George Town
- The George Town Airbnb market composition is heavily skewed towards Entire Home/Apt listings, which make up 90.9% of the 22 active rentals. This indicates strong guest preference for privacy and space.
- Looking at the property type distribution in George Town, House properties are the most common (50%), reflecting the local real estate landscape.
- Houses represent a significant 50% portion, catering likely to families or larger groups.
- The presence of 13.6% Hotel/Boutique listings indicates integration with traditional hospitality.
George Town Airbnb Room Capacity Analysis (2025): Bedroom Distribution
Distribution of Listings by Number of Bedrooms
Room Capacity Insights for George Town
- The dominant room capacity in George Town is 2 bedrooms listings, making up 36.4% of the market. This suggests a strong demand for properties suitable for couples or solo travelers.
- Together, 2 bedrooms and 1 bedroom properties represent 68.2% of the active Airbnb listings in George Town, indicating a high concentration in these sizes.
- A significant 22.7% of listings offer 3+ bedrooms, catering to larger groups and families seeking more space in George Town.
George Town Vacation Rental Guest Capacity Trends (2025)
Distribution of Listings by Guest Capacity
Guest Capacity Insights for George Town
- The most common guest capacity trend in George Town vacation rentals is listings accommodating 2 guests (45.5%). This suggests the primary traveler segment is likely couples or solo travelers.
- Properties designed for 2 guests and 8+ guests dominate the George Town STR market, accounting for 63.7% of listings.
- A significant 45.5% of listings cater specifically to 1-2 guests, highlighting strong demand from couples and solo travelers in George Town.
- 22.7% of properties accommodate 6+ guests, serving the market segment for larger families or group travel in George Town.
- On average, properties in George Town are equipped to host 3.9 guests.
George Town Airbnb Booking Patterns (2025): Available vs. Booked Days
Available Days Distribution
Booked Days Distribution
Booking Pattern Insights for George Town
- The most common availability pattern in George Town falls within the 181-270 days range, representing 50% of listings. This suggests many properties have significant open periods on their calendars.
- Approximately 72.7% of listings show high availability (181+ days open annually), indicating potential for increased bookings or specific owner usage patterns.
- For booked days, the 91-180 days range is most frequent in George Town (54.5%), reflecting common guest stay durations or potential owner blocking patterns.
- A notable 27.3% of properties secure long booking periods (181+ days booked per year), highlighting successful long-term rental strategies or significant owner usage.
George Town Airbnb Minimum Stay Requirements Analysis
Distribution of Listings by Minimum Night Requirement
1 Night
6 listings
27.3% of total
2 Nights
11 listings
50% of total
30+ Nights
5 listings
22.7% of total
Key Insights
- The most prevalent minimum stay requirement in George Town is 2 Nights, adopted by 50% of listings. This highlights the market's preference for shorter, flexible bookings.
- A strong majority (77.3%) of the George Town Airbnb data shows acceptance of very short stays (1-2 nights), indicating a dynamic, high-turnover market.
- A significant segment (22.7%) caters to monthly stays (30+ nights) in George Town, pointing to opportunities in the extended-stay market.
Recommendations
- Align with the market by considering a 2 Nights minimum stay, as 50% of George Town hosts use this setting.
- If feasible, allowing 1-night stays, especially midweek or during low season, could capture last-minute bookings, as only 27.3% currently do.
- Explore offering discounts for stays of 30+ nights to attract the 22.7% of the market seeking extended stays.
- Adjust minimum nights based on seasonality – potentially shorter during low season and longer during peak demand periods in George Town.
George Town Airbnb Cancellation Policy Trends Analysis (2025)
Super Strict 60 Days
1 listings
5% of total
Flexible
6 listings
30% of total
Moderate
5 listings
25% of total
Firm
2 listings
10% of total
Strict
6 listings
30% of total
Cancellation Policy Insights for George Town
- The prevailing Airbnb cancellation policy trend in George Town is Flexible, used by 30% of listings.
- There's a relatively balanced mix between guest-friendly (55.0%) and stricter (40.0%) policies, offering choices for different guest needs.
Recommendations for Hosts
- Consider adopting a Flexible policy to align with the 30% market standard in George Town.
- Regularly review your cancellation policy against competitors and market demand shifts in George Town.
George Town STR Booking Lead Time Analysis (2025)
Average Booking Lead Time by Month
Booking Lead Time Insights for George Town
- The overall average booking lead time for vacation rentals in George Town is 39 days.
- Guests book furthest in advance for stays during January (average 53 days), likely coinciding with peak travel demand or local events.
- The shortest booking windows occur for stays in November (average 23 days), indicating more last-minute travel plans during this time.
- Seasonally, Winter (49 days avg.) sees the longest lead times, while Fall (27 days avg.) has the shortest, reflecting typical travel planning cycles.
Recommendations for Hosts
- Use the overall average lead time (39 days) as a baseline for your pricing and availability strategy in George Town.
- For January stays, consider implementing length-of-stay discounts or slightly higher rates for bookings made less than 53 days out to capitalize on advance planning.
- Target marketing efforts for the Winter season well in advance (at least 49 days) to capture early planners.
- Monitor your own booking lead times against these George Town averages to identify opportunities for dynamic pricing adjustments.
Popular & Essential Airbnb Amenities in George Town (2025)
Amenity Prevalence
Amenity Insights for George Town
- Essential amenities in George Town that guests expect include: Hot water, Dishes and silverware, Heating, Smoke alarm, TV, Essentials, Free parking on premises, Cooking basics, Hangers, Refrigerator. Lacking these (any) could significantly impact bookings.
Recommendations for Hosts
- Ensure your listing includes all essential amenities for George Town: Hot water, Dishes and silverware, Heating, Smoke alarm, TV, Essentials, Free parking on premises, Cooking basics, Hangers, Refrigerator.
- Prioritize adding missing essentials: TV, Essentials, Free parking on premises, Cooking basics, Hangers, Refrigerator.
- Highlight unique or less common amenities you offer (e.g., hot tub, dedicated workspace, EV charger) in your listing description and photos.
- Regularly check competitor amenities in George Town to stay competitive.
George Town Airbnb Guest Demographics & Profile Analysis (2025)
Guest Profile Summary for George Town
- The typical guest profile for Airbnb in George Town consists of primarily domestic travelers (87%), often arriving from nearby Hobart, typically belonging to the Post-2000s (Gen Z/Alpha) group (50%), primarily speaking English or Chinese.
- Domestic travelers account for 86.9% of guests.
- Key international markets include Australia (86.9%) and United States (2.7%).
- Top languages spoken are English (77.6%) followed by Chinese (5.1%).
- A significant demographic segment is the Post-2000s (Gen Z/Alpha) group, representing 50% of guests.
Recommendations for Hosts
- Target domestic marketing efforts towards travelers from Hobart and Launceston.
- Tailor amenities and listing descriptions to appeal to the dominant Post-2000s (Gen Z/Alpha) demographic (e.g., highlight fast WiFi, smart home features, local guides).
- Highlight unique local experiences or amenities relevant to the primary guest profile.
- Consider seasonal promotions aligned with peak travel times for key origin markets.
Nearby Short-Term Rental Market Comparison
How does the George Town Airbnb market stack up against its neighbors? Compare key performance metrics like average monthly revenue, ADR, and occupancy rates in surrounding areas to understand the broader regional STR landscape.
| Market | Active Properties | Monthly Revenue | Daily Rate | Avg. Occupancy |
|---|---|---|---|---|
| Sandford | 13 | $4,097 | $208.63 | 62% |
| Waratah-Wynyard | 38 | $2,984 | $188.67 | 50% |
| Kentish | 66 | $2,894 | $190.06 | 53% |
| Turners Beach | 11 | $2,654 | $242.16 | 50% |
| Sisters Beach | 26 | $2,605 | $177.40 | 49% |
| Central Highlands | 22 | $2,596 | $176.64 | 44% |
| Strahan | 66 | $2,594 | $161.57 | 55% |
| Hobart | 1,542 | $2,513 | $176.78 | 53% |
| City of Clarence | 18 | $2,464 | $237.50 | 43% |
| Meander Valley | 32 | $2,437 | $176.14 | 50% |