Deloraine Airbnb Market Analysis 2025: Short Term Rental Data & Vacation Rental Statistics in Tasmania, Australia
Is Airbnb profitable in Deloraine in 2025? Explore comprehensive Airbnb analytics for Deloraine, Tasmania, Australia to uncover income potential. This 2025 STR market report for Deloraine, based on AirROI data from April 2024 to March 2025, reveals key trends in the niche market of 25 active listings.
Whether you're considering an Airbnb investment in Deloraine, optimizing your existing vacation rental, or exploring rental arbitrage opportunities, understanding the Deloraine Airbnb data is crucial. Navigating the high regulation landscape is key to maximizing your short term rental income potential. Let's dive into the specifics.
Key Deloraine Airbnb Performance Metrics Overview
Monthly Airbnb Revenue Variations & Income Potential in Deloraine (2025)
Understanding the monthly revenue variations for Airbnb listings in Deloraine is key to maximizing your short term rental income potential. Seasonality significantly impacts earnings. Our analysis, based on data from the past 12 months, shows that the peak revenue month for STRs in Deloraine is typically January, while August often presents the lowest earnings, highlighting opportunities for strategic pricing adjustments during shoulder and low seasons. Explore the typical Airbnb income in Deloraine across different performance tiers:
- Best-in-class properties (Top 10%) achieve $3,900+ monthly, often utilizing dynamic pricing and superior guest experiences.
- Strong performing properties (Top 25%) earn $3,084 or more, indicating effective management and desirable locations/amenities.
- Typical properties (Median) generate around $2,239 per month, representing the average market performance.
- Entry-level properties (Bottom 25%) see earnings around $1,485, often with potential for optimization.
Average Monthly Airbnb Earnings Trend in Deloraine
Deloraine Airbnb Occupancy Rate Trends (2025)
Maximize your bookings by understanding the Deloraine STR occupancy trends. Seasonal demand shifts significantly influence how often properties are booked. Typically, Februarysees the highest demand (peak season occupancy), while June experiences the lowest (low season). Effective strategies, like adjusting minimum stays or offering promotions, can boost occupancy during slower periods. Here's how different property tiers perform in Deloraine:
- Best-in-class properties (Top 10%) achieve 84%+ occupancy, indicating high desirability and potentially optimized availability.
- Strong performing properties (Top 25%) maintain 74% or higher occupancy, suggesting good market fit and guest satisfaction.
- Typical properties (Median) have an occupancy rate around 59%.
- Entry-level properties (Bottom 25%) average 42% occupancy, potentially facing higher vacancy.
Average Monthly Occupancy Rate Trend in Deloraine
Average Daily Rate (ADR) Airbnb Trends in Deloraine (2025)
Effective short term rental pricing strategy in Deloraine involves understanding monthly ADR fluctuations. The Average Daily Rate (ADR) for Airbnb in Deloraine typically peaks in August and dips lowest during February. Leveraging Airbnb dynamic pricing tools or strategies based on this seasonality can significantly boost revenue. Here's a look at the typical nightly rates achieved:
- Best-in-class properties (Top 10%) command rates of $188+ per night, often due to premium features or locations.
- Strong performing properties (Top 25%) achieve nightly rates of $135 or more.
- Typical properties (Median) charge around $117 per night.
- Entry-level properties (Bottom 25%) earn around $100 per night.
Average Daily Rate (ADR) Trend by Month in Deloraine
Get Live Deloraine Market Intelligence 👇

Explore Real-time Analytics
Airbnb Seasonality Analysis & Trends in Deloraine (2025)
Peak Season (January, May, December)
- Revenue averages $2,723 per month
- Occupancy rates average 61.2%
- Daily rates average $129
Shoulder Season
- Revenue averages $2,448 per month
- Occupancy maintains around 59.3%
- Daily rates hold near $128
Low Season (August, September, October)
- Revenue drops to average $2,001 per month
- Occupancy decreases to average 49.8%
- Daily rates adjust to average $131
Seasonality Insights for Deloraine
- The Airbnb seasonality in Deloraine shows moderate seasonality with distinct peak and low periods. While the sections above show seasonal averages, it's also insightful to look at the extremes:
- During the high season, the absolute peak month showcases Deloraine's highest earning potential, with monthly revenues capable of climbing to $2,748, occupancy reaching a high of 68.0%, and ADRs peaking at $131.
- Conversely, the slowest single month of the year, typically falling within the low season, marks the market's lowest point. In this month, revenue might dip to $1,921, occupancy could drop to 43.6%, and ADRs may adjust down to $124.
- Understanding both the seasonal averages and these monthly peaks and troughs in revenue, occupancy, and ADR is crucial for maximizing your Airbnb profit potential in Deloraine.
Seasonal Strategies for Maximizing Profit
- Peak Season: Maximize revenue through premium pricing and potentially longer minimum stays. Ensure high availability.
- Low Season: Offer competitive pricing, special promotions (e.g., extended stay discounts), and flexible cancellation policies. Target off-season travelers like remote workers or budget-conscious guests.
- Shoulder Seasons: Implement dynamic pricing that balances peak and low rates. Target weekend travelers or specific events. Offer slightly more flexible terms than peak season.
- Regularly analyze your own performance against these Deloraine seasonality benchmarks and adjust your pricing and availability strategy accordingly.
Best Areas for Airbnb Investment in Deloraine (2025)
Exploring the top neighborhoods for short-term rentals in Deloraine? This section highlights key areas, outlining why they are attractive for hosts and guests, along with notable local attractions. Consider these locations based on your target guest profile and investment strategy.
| Neighborhood / Area | Why Host Here? (Target Guests & Appeal) | Key Attractions & Landmarks |
|---|---|---|
| Deloraine Main Street | The heart of Deloraine with charming shops, cafes, and easy access to local attractions. Great for tourists looking to immerse themselves in the town's culture and history. | Deloraine Craft Fair, Deloraine Museum, Local Art Galleries, Coffee Shops, Historic Buildings |
| Mount Roland | A stunning natural area offering picturesque views and hiking opportunities. Attracts nature lovers and outdoor enthusiasts looking for a peaceful retreat. | Mount Roland, Hiking Trails, Scenic Lookouts, Wildlife Spotting, Picnic Areas |
| Meander Valley | Known for its beautiful landscapes and local produce, this area appeals to guests interested in farm stays and artisanal experiences. | Meander Valley Wine Trail, Farmers Markets, Local Cheese Producers, Scenic Drives, Historic Farms |
| Liffey Falls | Part of a heritage-listed national park, Liffey Falls offers breathtaking waterfalls and lush scenery, perfect for eco-tourists. | Liffey Falls, Walking Tracks, Picnic Facilities, Wildlife Observations, Bushwalking |
| Tasmanian Craft Fair | Hosted annually in Deloraine, this event attracts many visitors interested in local crafts and artisan goods, making nearby accommodations very desirable. | Craft Stalls, Live Music, Workshops, Local Food Stalls, Artisan Demonstrations |
| Deloraine Riverbank | A scenic spot perfect for those who enjoy riverside activities like fishing, walking, and picnicking. Great for relaxation and family getaways. | Deloraine River Walk, Fishing Spots, Picnic Areas, Scenic Views, Wildlife |
| Deloraine Arts and Culture | Deloraine has a vibrant arts scene, appealing to tourists who appreciate local culture and creativity. It's a great spot for those looking to explore community events and local artists. | Art Galleries, Community Workshops, Local Theatre, Craft Shops, Cultural Festivals |
| Nearby Cradle Mountain | Though a bit further, it's a world-renowned national park and a major draw for visitors to Tasmania. Ideal for tourists wanting easy access to the stunning landscapes of Tasmania. | Cradle Mountain National Park, Walking Tracks, Wildlife Tours, Scenic vistas, Photography Spots |
Understanding Airbnb License Requirements & STR Laws in Deloraine (2025)
Yes, Deloraine, Tasmania, Australia enforces high STR regulations. Obtaining a license and ensuring compliance is almost certainly required according to current 2025 STR laws. Always verify the latest short term rental regulations and Airbnb license requirements directly with local government authorities for Deloraine to ensure full compliance before hosting.
(Source: AirROI data, 2025, based on 84% licensed listings)
Top Performing Airbnb Properties in Deloraine (2025)
Benchmark your potential! Explore examples of top-performing Airbnb properties in Delorainebased on Trailing Twelve Month (TTM) revenue. Analyze their characteristics, revenue, occupancy rate, and ADR to understand what drives success in this market.

The Eco Cabin Tasmania - Cedar Hot Tub
Entire Place • 1 bedroom
Mountain Explorer - perfect base for exploring
Entire Place • 2 bedrooms
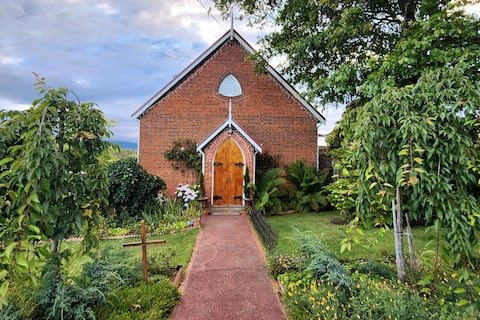
Saint Andrew's Church Deloraine
Entire Place • 1 bedroom
Come & see the Platypus
Entire Place • 2 bedrooms

Silverbirch Cottage
Entire Place • 3 bedrooms
Drumreagh Cabin 2- Modern style in country setting
Entire Place • 2 bedrooms
Note: Performance varies based on location, size, amenities, seasonality, and management quality. Data reflects the past 12 months.
Top Performing Airbnb Hosts in Deloraine (2025)
Learn from the best! This table showcases top-performing Airbnb hosts in Deloraine based on the number of properties managed and estimated total revenue over the past year. Analyze their scale and performance metrics.
| Host Name | Properties | Grossing Revenue | Stay Reviews | Avg Rating |
|---|---|---|---|---|
| Melissa | 2 | $63,339 | 56 | 4.99/5.0 |
| Em | 1 | $63,148 | 96 | 5.00/5.0 |
| Samantha | 1 | $47,840 | 12 | 4.92/5.0 |
| Sue | 2 | $47,153 | 887 | 4.88/5.0 |
| Shanna | 1 | $39,979 | 17 | 5.00/5.0 |
| Andrew | 1 | $35,709 | 24 | 5.00/5.0 |
| Tim | 1 | $33,603 | 120 | 4.83/5.0 |
| Jane | 1 | $31,778 | 178 | 4.94/5.0 |
| Lorraine | 1 | $27,869 | 94 | 4.88/5.0 |
| Emma And Richard | 1 | $27,736 | 424 | 4.88/5.0 |
Analyzing the strategies of top hosts, such as their property selection, pricing, and guest communication, can offer valuable lessons for optimizing your own Airbnb operations in Deloraine.
Dive Deeper: Advanced Deloraine STR Market Data (2025)
Ready to unlock more insights? AirROI provides access to advanced metrics and comprehensive Airbnb data for Deloraine. Explore detailed analytics beyond this report to refine your investment strategy, optimize pricing, and maximize your vacation rental profits.
Explore Advanced MetricsDeloraine Short-Term Rental Market Composition (2025): Property & Room Types
Room Type Distribution
Property Type Distribution
Market Composition Insights for Deloraine
- The Deloraine Airbnb market composition is heavily skewed towards Entire Home/Apt listings, which make up 92% of the 25 active rentals. This indicates strong guest preference for privacy and space.
- Looking at the property type distribution in Deloraine, House properties are the most common (52%), reflecting the local real estate landscape.
- Houses represent a significant 52% portion, catering likely to families or larger groups.
- The presence of 12% Hotel/Boutique listings indicates integration with traditional hospitality.
- Smaller segments like others, unique stays (combined 8.0%) offer potential for unique stay experiences.
Deloraine Airbnb Room Capacity Analysis (2025): Bedroom Distribution
Distribution of Listings by Number of Bedrooms
Room Capacity Insights for Deloraine
- The dominant room capacity in Deloraine is 2 bedrooms listings, making up 44% of the market. This suggests a strong demand for properties suitable for couples or solo travelers.
- Together, 2 bedrooms and 3 bedrooms properties represent 72.0% of the active Airbnb listings in Deloraine, indicating a high concentration in these sizes.
- A significant 28.0% of listings offer 3+ bedrooms, catering to larger groups and families seeking more space in Deloraine.
Deloraine Vacation Rental Guest Capacity Trends (2025)
Distribution of Listings by Guest Capacity
Guest Capacity Insights for Deloraine
- The most common guest capacity trend in Deloraine vacation rentals is listings accommodating 4 guests (40%). This suggests the primary traveler segment is likely small families or groups.
- Properties designed for 4 guests and 2 guests dominate the Deloraine STR market, accounting for 64.0% of listings.
- 24.0% of properties accommodate 6+ guests, serving the market segment for larger families or group travel in Deloraine.
- On average, properties in Deloraine are equipped to host 4.2 guests.
Deloraine Airbnb Booking Patterns (2025): Available vs. Booked Days
Available Days Distribution
Booked Days Distribution
Booking Pattern Insights for Deloraine
- The most common availability pattern in Deloraine falls within the 91-180 days range, representing 40% of listings. This suggests many properties have significant open periods on their calendars.
- Approximately 44.0% of listings show high availability (181+ days open annually), indicating potential for increased bookings or specific owner usage patterns.
- For booked days, the 181-270 days range is most frequent in Deloraine (40%), reflecting common guest stay durations or potential owner blocking patterns.
- A notable 56.0% of properties secure long booking periods (181+ days booked per year), highlighting successful long-term rental strategies or significant owner usage.
Deloraine Airbnb Minimum Stay Requirements Analysis
Distribution of Listings by Minimum Night Requirement
1 Night
10 listings
43.5% of total
2 Nights
7 listings
30.4% of total
3 Nights
2 listings
8.7% of total
30+ Nights
4 listings
17.4% of total
Key Insights
- The most prevalent minimum stay requirement in Deloraine is 1 Night, adopted by 43.5% of listings. This highlights the market's preference for shorter, flexible bookings.
- A strong majority (73.9%) of the Deloraine Airbnb data shows acceptance of very short stays (1-2 nights), indicating a dynamic, high-turnover market.
- A significant segment (17.4%) caters to monthly stays (30+ nights) in Deloraine, pointing to opportunities in the extended-stay market.
Recommendations
- Align with the market by considering a 1 Night minimum stay, as 43.5% of Deloraine hosts use this setting.
- Explore offering discounts for stays of 30+ nights to attract the 17.4% of the market seeking extended stays.
- Adjust minimum nights based on seasonality – potentially shorter during low season and longer during peak demand periods in Deloraine.
Deloraine Airbnb Cancellation Policy Trends Analysis (2025)
Flexible
13 listings
54.2% of total
Moderate
3 listings
12.5% of total
Firm
5 listings
20.8% of total
Strict
3 listings
12.5% of total
Cancellation Policy Insights for Deloraine
- The prevailing Airbnb cancellation policy trend in Deloraine is Flexible, used by 54.2% of listings.
- There's a relatively balanced mix between guest-friendly (66.7%) and stricter (33.3%) policies, offering choices for different guest needs.
Recommendations for Hosts
- Consider adopting a Flexible policy to align with the 54.2% market standard in Deloraine.
- Given the high prevalence of Flexible policies (54.2%), offering this can enhance booking appeal, especially during shoulder seasons.
- Using a Strict policy might deter some guests, as only 12.5% of listings use it. Evaluate if potential revenue protection outweighs possible lower booking rates.
- Regularly review your cancellation policy against competitors and market demand shifts in Deloraine.
Deloraine STR Booking Lead Time Analysis (2025)
Average Booking Lead Time by Month
Booking Lead Time Insights for Deloraine
- The overall average booking lead time for vacation rentals in Deloraine is 69 days.
- Guests book furthest in advance for stays during March (average 93 days), likely coinciding with peak travel demand or local events.
- The shortest booking windows occur for stays in June (average 45 days), indicating more last-minute travel plans during this time.
- Seasonally, Fall (76 days avg.) sees the longest lead times, while Summer (62 days avg.) has the shortest, reflecting typical travel planning cycles.
Recommendations for Hosts
- Use the overall average lead time (69 days) as a baseline for your pricing and availability strategy in Deloraine.
- For March stays, consider implementing length-of-stay discounts or slightly higher rates for bookings made less than 93 days out to capitalize on advance planning.
- Target marketing efforts for the Fall season well in advance (at least 76 days) to capture early planners.
- Monitor your own booking lead times against these Deloraine averages to identify opportunities for dynamic pricing adjustments.
Popular & Essential Airbnb Amenities in Deloraine (2025)
Amenity Prevalence
Amenity Insights for Deloraine
- Essential amenities in Deloraine that guests expect include: Heating, Dishes and silverware, Smoke alarm, TV, Refrigerator. Lacking these (any) could significantly impact bookings.
- Popular amenities like Hair dryer, Backyard, Hot water are common but not universal. Offering these can provide a competitive edge.
Recommendations for Hosts
- Ensure your listing includes all essential amenities for Deloraine: Heating, Dishes and silverware, Smoke alarm, TV, Refrigerator.
- Prioritize adding missing essentials: Heating, Dishes and silverware, Smoke alarm, TV, Refrigerator.
- Consider adding popular differentiators like Hair dryer or Backyard to increase appeal.
- Highlight unique or less common amenities you offer (e.g., hot tub, dedicated workspace, EV charger) in your listing description and photos.
- Regularly check competitor amenities in Deloraine to stay competitive.
Deloraine Airbnb Guest Demographics & Profile Analysis (2025)
Guest Profile Summary for Deloraine
- The typical guest profile for Airbnb in Deloraine consists of primarily domestic travelers (87%), often arriving from nearby Hobart, typically belonging to the Post-2000s (Gen Z/Alpha) group (50%), primarily speaking English or Chinese.
- Domestic travelers account for 87.3% of guests.
- Key international markets include Australia (87.3%) and United Kingdom (3.2%).
- Top languages spoken are English (74.8%) followed by Chinese (5.5%).
- A significant demographic segment is the Post-2000s (Gen Z/Alpha) group, representing 50% of guests.
Recommendations for Hosts
- Target domestic marketing efforts towards travelers from Hobart and Melbourne.
- Tailor amenities and listing descriptions to appeal to the dominant Post-2000s (Gen Z/Alpha) demographic (e.g., highlight fast WiFi, smart home features, local guides).
- Highlight unique local experiences or amenities relevant to the primary guest profile.
- Consider seasonal promotions aligned with peak travel times for key origin markets.
Nearby Short-Term Rental Market Comparison
How does the Deloraine Airbnb market stack up against its neighbors? Compare key performance metrics like average monthly revenue, ADR, and occupancy rates in surrounding areas to understand the broader regional STR landscape.
| Market | Active Properties | Monthly Revenue | Daily Rate | Avg. Occupancy |
|---|---|---|---|---|
| Sandford | 13 | $4,097 | $208.63 | 62% |
| Waratah-Wynyard | 38 | $2,984 | $188.67 | 50% |
| Kentish | 66 | $2,894 | $190.06 | 53% |
| Turners Beach | 11 | $2,654 | $242.16 | 50% |
| Sisters Beach | 26 | $2,605 | $177.40 | 49% |
| Central Highlands | 22 | $2,596 | $176.64 | 44% |
| Strahan | 66 | $2,594 | $161.57 | 55% |
| Hobart | 1,542 | $2,513 | $176.78 | 53% |
| City of Clarence | 18 | $2,464 | $237.50 | 43% |
| Meander Valley | 32 | $2,437 | $176.14 | 50% |