Currie Airbnb Market Analysis 2025: Short Term Rental Data & Vacation Rental Statistics in Tasmania, Australia
Is Airbnb profitable in Currie in 2025? Explore comprehensive Airbnb analytics for Currie, Tasmania, Australia to uncover income potential. This 2025 STR market report for Currie, based on AirROI data from April 2024 to March 2025, reveals key trends in the niche market of 22 active listings.
Whether you're considering an Airbnb investment in Currie, optimizing your existing vacation rental, or exploring rental arbitrage opportunities, understanding the Currie Airbnb data is crucial. Navigating the high regulation landscape is key to maximizing your short term rental income potential. Let's dive into the specifics.
Key Currie Airbnb Performance Metrics Overview
Monthly Airbnb Revenue Variations & Income Potential in Currie (2025)
Understanding the monthly revenue variations for Airbnb listings in Currie is key to maximizing your short term rental income potential. Seasonality significantly impacts earnings. Our analysis, based on data from the past 12 months, shows that the peak revenue month for STRs in Currie is typically October, while September often presents the lowest earnings, highlighting opportunities for strategic pricing adjustments during shoulder and low seasons. Explore the typical Airbnb income in Currie across different performance tiers:
- Best-in-class properties (Top 10%) achieve $5,369+ monthly, often utilizing dynamic pricing and superior guest experiences.
- Strong performing properties (Top 25%) earn $3,754 or more, indicating effective management and desirable locations/amenities.
- Typical properties (Median) generate around $2,418 per month, representing the average market performance.
- Entry-level properties (Bottom 25%) see earnings around $1,320, often with potential for optimization.
Average Monthly Airbnb Earnings Trend in Currie
Currie Airbnb Occupancy Rate Trends (2025)
Maximize your bookings by understanding the Currie STR occupancy trends. Seasonal demand shifts significantly influence how often properties are booked. Typically, Marchsees the highest demand (peak season occupancy), while August experiences the lowest (low season). Effective strategies, like adjusting minimum stays or offering promotions, can boost occupancy during slower periods. Here's how different property tiers perform in Currie:
- Best-in-class properties (Top 10%) achieve 65%+ occupancy, indicating high desirability and potentially optimized availability.
- Strong performing properties (Top 25%) maintain 51% or higher occupancy, suggesting good market fit and guest satisfaction.
- Typical properties (Median) have an occupancy rate around 31%.
- Entry-level properties (Bottom 25%) average 17% occupancy, potentially facing higher vacancy.
Average Monthly Occupancy Rate Trend in Currie
Average Daily Rate (ADR) Airbnb Trends in Currie (2025)
Effective short term rental pricing strategy in Currie involves understanding monthly ADR fluctuations. The Average Daily Rate (ADR) for Airbnb in Currie typically peaks in October and dips lowest during November. Leveraging Airbnb dynamic pricing tools or strategies based on this seasonality can significantly boost revenue. Here's a look at the typical nightly rates achieved:
- Best-in-class properties (Top 10%) command rates of $705+ per night, often due to premium features or locations.
- Strong performing properties (Top 25%) achieve nightly rates of $233 or more.
- Typical properties (Median) charge around $199 per night.
- Entry-level properties (Bottom 25%) earn around $144 per night.
Average Daily Rate (ADR) Trend by Month in Currie
Get Live Currie Market Intelligence 👇

Explore Real-time Analytics
Airbnb Seasonality Analysis & Trends in Currie (2025)
Peak Season (October, May, April)
- Revenue averages $3,681 per month
- Occupancy rates average 37.3%
- Daily rates average $292
Shoulder Season
- Revenue averages $2,956 per month
- Occupancy maintains around 37.0%
- Daily rates hold near $277
Low Season (July, August, September)
- Revenue drops to average $2,156 per month
- Occupancy decreases to average 29.0%
- Daily rates adjust to average $293
Seasonality Insights for Currie
- The Airbnb seasonality in Currie shows highly seasonal trends requiring careful strategy. While the sections above show seasonal averages, it's also insightful to look at the extremes:
- During the high season, the absolute peak month showcases Currie's highest earning potential, with monthly revenues capable of climbing to $3,868, occupancy reaching a high of 44.6%, and ADRs peaking at $295.
- Conversely, the slowest single month of the year, typically falling within the low season, marks the market's lowest point. In this month, revenue might dip to $1,761, occupancy could drop to 26.3%, and ADRs may adjust down to $260.
- Understanding both the seasonal averages and these monthly peaks and troughs in revenue, occupancy, and ADR is crucial for maximizing your Airbnb profit potential in Currie.
Seasonal Strategies for Maximizing Profit
- Peak Season: Maximize revenue through premium pricing and potentially longer minimum stays. Ensure high availability.
- Low Season: Offer competitive pricing, special promotions (e.g., extended stay discounts), and flexible cancellation policies. Target off-season travelers like remote workers or budget-conscious guests.
- Shoulder Seasons: Implement dynamic pricing that balances peak and low rates. Target weekend travelers or specific events. Offer slightly more flexible terms than peak season.
- Regularly analyze your own performance against these Currie seasonality benchmarks and adjust your pricing and availability strategy accordingly.
Best Areas for Airbnb Investment in Currie (2025)
Exploring the top neighborhoods for short-term rentals in Currie? This section highlights key areas, outlining why they are attractive for hosts and guests, along with notable local attractions. Consider these locations based on your target guest profile and investment strategy.
| Neighborhood / Area | Why Host Here? (Target Guests & Appeal) | Key Attractions & Landmarks |
|---|---|---|
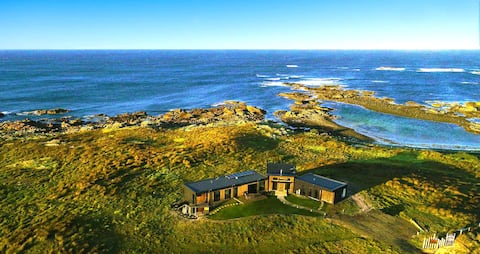
| Currie Beach | Beautiful beach area attracting visitors for its stunning coastal views and fishing opportunities. Ideal for beach lovers and those seeking tranquility. | Currie Beach, Tasman Island, Rocky Cape National Park, Currie Lighthouse, Fishing spots, Walking trails |
| Kingston | A family-friendly area with access to local amenities and parks. Perfect for travelers looking for comfort and convenience while enjoying the natural beauty surrounding Currie. | Kingston Beach, Snug Beach, Local cafes and restaurants, Walking tracks, Mount Wellington views |
| Dieback | Known for its unique natural environment and close proximity to outdoor activities. Appeals to adventure seekers and nature enthusiasts. | Hiking trails, Wildlife parks, Botanical gardens, Rugged coastline, Photography spots |
| Reef Beach | Secluded and less crowded, offering a serene experience for guests looking to escape into nature. Great for couples and quiet retreats. | Reef Beach, Local wildlife, Picnic spots, Nature walks, Seal colonies |
| North Currie | A quieter residential area with beautiful views of the surrounding landscape. Attracts visitors looking for peace and relaxation away from the hustle. | Scenic viewpoints, Local culture, Café culture, Minimal crowds |
| Gunns Plains | Rich in natural beauty with its caves and nature reserves, making it a unique attraction for those interested in geology and flora. | Gunns Plains Caves, Crystal Show Caves, Nature trails, Birdwatching, Fishing spots |
| Lune River | A tranquil riverside location that offers fishing and outdoor activities. Ideal for families and groups seeking adventure. | Lune River, Fishing locations, Kayaking opportunities, Picnic areas, Nature exploration |
| Smithton | A bit further away but an excellent base for exploring the wider area of Northwest Tasmania. Close to shops and local services. | Smithton shopping district, Nearby farms, Local wineries, Heritage walks, Wildlife experiences |
Understanding Airbnb License Requirements & STR Laws in Currie (2025)
Yes, Currie, Tasmania, Australia enforces high STR regulations. Obtaining a license and ensuring compliance is almost certainly required according to current 2025 STR laws. Always verify the latest short term rental regulations and Airbnb license requirements directly with local government authorities for Currie to ensure full compliance before hosting.
(Source: AirROI data, 2025, based on 82% licensed listings)
Top Performing Airbnb Properties in Currie (2025)
Benchmark your potential! Explore examples of top-performing Airbnb properties in Curriebased on Trailing Twelve Month (TTM) revenue. Analyze their characteristics, revenue, occupancy rate, and ADR to understand what drives success in this market.
Netherby Rocks King Island
Entire Place • 5 bedrooms
Light View Villa 2
Entire Place • 2 bedrooms
The Roaring Forties
Entire Place • 3 bedrooms

Green Ponds Guest House & Cottage (Both : Group)
Entire Place • 6 bedrooms

Blencathra Coastal Spa Getaway
Entire Place • 3 bedrooms

"The Old Bakehouse"
Entire Place • 2 bedrooms
Note: Performance varies based on location, size, amenities, seasonality, and management quality. Data reflects the past 12 months.
Top Performing Airbnb Hosts in Currie (2025)
Learn from the best! This table showcases top-performing Airbnb hosts in Currie based on the number of properties managed and estimated total revenue over the past year. Analyze their scale and performance metrics.
| Host Name | Properties | Grossing Revenue | Stay Reviews | Avg Rating |
|---|---|---|---|---|
| Stephanie | 2 | $98,187 | 44 | 4.95/5.0 |
| John And Lyn | 2 | $84,114 | 126 | 4.83/5.0 |
| Sonia | 7 | $67,173 | 124 | 4.76/5.0 |
| Olwyn | 1 | $44,181 | 15 | 4.80/5.0 |
| Grant | 1 | $38,148 | 148 | 4.88/5.0 |
| David And Toni | 1 | $37,109 | 105 | 5.00/5.0 |
| Alexandra | 1 | $33,156 | 166 | 5.00/5.0 |
| Host #461462364 | 1 | $30,403 | 42 | 4.71/5.0 |
| Host #104946303 | 2 | $26,931 | 1 | 0.00/5.0 |
| Nita | 1 | $23,384 | 67 | 4.87/5.0 |
Analyzing the strategies of top hosts, such as their property selection, pricing, and guest communication, can offer valuable lessons for optimizing your own Airbnb operations in Currie.
Dive Deeper: Advanced Currie STR Market Data (2025)
Ready to unlock more insights? AirROI provides access to advanced metrics and comprehensive Airbnb data for Currie. Explore detailed analytics beyond this report to refine your investment strategy, optimize pricing, and maximize your vacation rental profits.
Explore Advanced MetricsCurrie Short-Term Rental Market Composition (2025): Property & Room Types
Room Type Distribution
Property Type Distribution
Market Composition Insights for Currie
- The Currie Airbnb market composition is heavily skewed towards Entire Home/Apt listings, which make up 77.3% of the 22 active rentals. This indicates strong guest preference for privacy and space.
- Looking at the property type distribution in Currie, House properties are the most common (63.6%), reflecting the local real estate landscape.
- Houses represent a significant 63.6% portion, catering likely to families or larger groups.
- The presence of 22.7% Hotel/Boutique listings indicates integration with traditional hospitality.
Currie Airbnb Room Capacity Analysis (2025): Bedroom Distribution
Distribution of Listings by Number of Bedrooms
Room Capacity Insights for Currie
- The dominant room capacity in Currie is 3 bedrooms listings, making up 31.8% of the market. This suggests a strong demand for properties suitable for families or small groups.
- Together, 3 bedrooms and 2 bedrooms properties represent 63.6% of the active Airbnb listings in Currie, indicating a high concentration in these sizes.
- A significant 54.5% of listings offer 3+ bedrooms, catering to larger groups and families seeking more space in Currie.
Currie Vacation Rental Guest Capacity Trends (2025)
Distribution of Listings by Guest Capacity
Guest Capacity Insights for Currie
- The most common guest capacity trend in Currie vacation rentals is listings accommodating 4 guests (31.8%). This suggests the primary traveler segment is likely small families or groups.
- Properties designed for 4 guests and 8+ guests dominate the Currie STR market, accounting for 59.1% of listings.
- 40.9% of properties accommodate 6+ guests, serving the market segment for larger families or group travel in Currie.
- On average, properties in Currie are equipped to host 4.9 guests.
Currie Airbnb Booking Patterns (2025): Available vs. Booked Days
Available Days Distribution
Booked Days Distribution
Booking Pattern Insights for Currie
- The most common availability pattern in Currie falls within the 271-366 days range, representing 54.5% of listings. This suggests many properties have significant open periods on their calendars.
- Approximately 77.2% of listings show high availability (181+ days open annually), indicating potential for increased bookings or specific owner usage patterns.
- For booked days, the 181-270 days range is most frequent in Currie (27.3%), reflecting common guest stay durations or potential owner blocking patterns.
- A notable 27.3% of properties secure long booking periods (181+ days booked per year), highlighting successful long-term rental strategies or significant owner usage.
Currie Airbnb Minimum Stay Requirements Analysis
Distribution of Listings by Minimum Night Requirement
1 Night
7 listings
33.3% of total
2 Nights
9 listings
42.9% of total
3 Nights
2 listings
9.5% of total
4-6 Nights
1 listings
4.8% of total
30+ Nights
2 listings
9.5% of total
Key Insights
- The most prevalent minimum stay requirement in Currie is 2 Nights, adopted by 42.9% of listings. This highlights the market's preference for shorter, flexible bookings.
- A strong majority (76.2%) of the Currie Airbnb data shows acceptance of very short stays (1-2 nights), indicating a dynamic, high-turnover market.
Recommendations
- Align with the market by considering a 2 Nights minimum stay, as 42.9% of Currie hosts use this setting.
- Explore offering discounts for stays of 30+ nights to attract the 9.5% of the market seeking extended stays.
- Adjust minimum nights based on seasonality – potentially shorter during low season and longer during peak demand periods in Currie.
Currie Airbnb Cancellation Policy Trends Analysis (2025)
Flexible
7 listings
38.9% of total
Moderate
2 listings
11.1% of total
Firm
2 listings
11.1% of total
Strict
7 listings
38.9% of total
Cancellation Policy Insights for Currie
- The prevailing Airbnb cancellation policy trend in Currie is Flexible, used by 38.9% of listings.
- There's a relatively balanced mix between guest-friendly (50.0%) and stricter (50.0%) policies, offering choices for different guest needs.
Recommendations for Hosts
- Consider adopting a Flexible policy to align with the 38.9% market standard in Currie.
- With 38.9% using Strict terms, this is a viable option in Currie, particularly for high-value properties or during peak demand periods.
- Regularly review your cancellation policy against competitors and market demand shifts in Currie.
Currie STR Booking Lead Time Analysis (2025)
Average Booking Lead Time by Month
Booking Lead Time Insights for Currie
- The overall average booking lead time for vacation rentals in Currie is 75 days.
- Guests book furthest in advance for stays during December (average 98 days), likely coinciding with peak travel demand or local events.
- The shortest booking windows occur for stays in July (average 45 days), indicating more last-minute travel plans during this time.
- Seasonally, Winter (90 days avg.) sees the longest lead times, while Summer (51 days avg.) has the shortest, reflecting typical travel planning cycles.
Recommendations for Hosts
- Use the overall average lead time (75 days) as a baseline for your pricing and availability strategy in Currie.
- For December stays, consider implementing length-of-stay discounts or slightly higher rates for bookings made less than 98 days out to capitalize on advance planning.
- Target marketing efforts for the Winter season well in advance (at least 90 days) to capture early planners.
- Monitor your own booking lead times against these Currie averages to identify opportunities for dynamic pricing adjustments.
Popular & Essential Airbnb Amenities in Currie (2025)
Amenity Prevalence
Amenity Insights for Currie
- Essential amenities in Currie that guests expect include: Washer, TV, Free parking on premises, Heating, Kitchen, Smoke alarm, Essentials. Lacking these (any) could significantly impact bookings.
- Popular amenities like Cooking basics, Dryer, Iron are common but not universal. Offering these can provide a competitive edge.
Recommendations for Hosts
- Ensure your listing includes all essential amenities for Currie: Washer, TV, Free parking on premises, Heating, Kitchen, Smoke alarm, Essentials.
- Prioritize adding missing essentials: Essentials.
- Consider adding popular differentiators like Cooking basics or Dryer to increase appeal.
- Highlight unique or less common amenities you offer (e.g., hot tub, dedicated workspace, EV charger) in your listing description and photos.
- Regularly check competitor amenities in Currie to stay competitive.
Currie Airbnb Guest Demographics & Profile Analysis (2025)
Guest Profile Summary for Currie
- The typical guest profile for Airbnb in Currie consists of primarily domestic travelers (87%), often arriving from nearby Melbourne, typically belonging to the Post-2000s (Gen Z/Alpha) group (50%), primarily speaking English or French.
- Domestic travelers account for 87.1% of guests.
- Key international markets include Australia (87.1%) and United States (2.4%).
- Top languages spoken are English (87.1%) followed by French (3.2%).
- A significant demographic segment is the Post-2000s (Gen Z/Alpha) group, representing 50% of guests.
Recommendations for Hosts
- Target domestic marketing efforts towards travelers from Melbourne and New South Wales.
- Tailor amenities and listing descriptions to appeal to the dominant Post-2000s (Gen Z/Alpha) demographic (e.g., highlight fast WiFi, smart home features, local guides).
- Highlight unique local experiences or amenities relevant to the primary guest profile.
- Consider seasonal promotions aligned with peak travel times for key origin markets.
Nearby Short-Term Rental Market Comparison
How does the Currie Airbnb market stack up against its neighbors? Compare key performance metrics like average monthly revenue, ADR, and occupancy rates in surrounding areas to understand the broader regional STR landscape.
| Market | Active Properties | Monthly Revenue | Daily Rate | Avg. Occupancy |
|---|---|---|---|---|
| King Island Council | 11 | $5,231 | $550.50 | 37% |
| Leopold | 12 | $3,496 | $429.65 | 41% |
| Shire of Colac Otway | 372 | $2,948 | $292.68 | 38% |
| Lorne | 365 | $2,801 | $395.21 | 33% |
| Port Campbell | 123 | $2,763 | $243.95 | 39% |
| Forrest | 31 | $2,567 | $174.06 | 47% |
| Timboon | 16 | $2,525 | $184.54 | 41% |
| Queenscliff | 94 | $2,521 | $314.16 | 34% |
| Apollo Bay | 412 | $2,511 | $261.55 | 37% |
| Torquay | 484 | $2,500 | $293.11 | 37% |