Wellington East Airbnb Market Analysis 2025: Short Term Rental Data & Vacation Rental Statistics in South Australia, Australia
Is Airbnb profitable in Wellington East in 2025? Explore comprehensive Airbnb analytics for Wellington East, South Australia, Australia to uncover income potential. This 2025 STR market report for Wellington East, based on AirROI data from April 2024 to March 2025, reveals key trends in the niche market of 18 active listings.
Whether you're considering an Airbnb investment in Wellington East, optimizing your existing vacation rental, or exploring rental arbitrage opportunities, understanding the Wellington East Airbnb data is crucial. Leveraging the low regulation environment is key to maximizing your short term rental income potential. Let's dive into the specifics.
Key Wellington East Airbnb Performance Metrics Overview
Monthly Airbnb Revenue Variations & Income Potential in Wellington East (2025)
Understanding the monthly revenue variations for Airbnb listings in Wellington East is key to maximizing your short term rental income potential. Seasonality significantly impacts earnings. Our analysis, based on data from the past 12 months, shows that the peak revenue month for STRs in Wellington East is typically January, while March often presents the lowest earnings, highlighting opportunities for strategic pricing adjustments during shoulder and low seasons. Explore the typical Airbnb income in Wellington East across different performance tiers:
- Best-in-class properties (Top 10%) achieve $7,220+ monthly, often utilizing dynamic pricing and superior guest experiences.
- Strong performing properties (Top 25%) earn $4,255 or more, indicating effective management and desirable locations/amenities.
- Typical properties (Median) generate around $2,423 per month, representing the average market performance.
- Entry-level properties (Bottom 25%) see earnings around $1,505, often with potential for optimization.
Average Monthly Airbnb Earnings Trend in Wellington East
Wellington East Airbnb Occupancy Rate Trends (2025)
Maximize your bookings by understanding the Wellington East STR occupancy trends. Seasonal demand shifts significantly influence how often properties are booked. Typically, Januarysees the highest demand (peak season occupancy), while July experiences the lowest (low season). Effective strategies, like adjusting minimum stays or offering promotions, can boost occupancy during slower periods. Here's how different property tiers perform in Wellington East:
- Best-in-class properties (Top 10%) achieve 67%+ occupancy, indicating high desirability and potentially optimized availability.
- Strong performing properties (Top 25%) maintain 45% or higher occupancy, suggesting good market fit and guest satisfaction.
- Typical properties (Median) have an occupancy rate around 31%.
- Entry-level properties (Bottom 25%) average 15% occupancy, potentially facing higher vacancy.
Average Monthly Occupancy Rate Trend in Wellington East
Average Daily Rate (ADR) Airbnb Trends in Wellington East (2025)
Effective short term rental pricing strategy in Wellington East involves understanding monthly ADR fluctuations. The Average Daily Rate (ADR) for Airbnb in Wellington East typically peaks in January and dips lowest during August. Leveraging Airbnb dynamic pricing tools or strategies based on this seasonality can significantly boost revenue. Here's a look at the typical nightly rates achieved:
- Best-in-class properties (Top 10%) command rates of $553+ per night, often due to premium features or locations.
- Strong performing properties (Top 25%) achieve nightly rates of $401 or more.
- Typical properties (Median) charge around $304 per night.
- Entry-level properties (Bottom 25%) earn around $194 per night.
Average Daily Rate (ADR) Trend by Month in Wellington East
Get Live Wellington East Market Intelligence 👇

Explore Real-time Analytics
Airbnb Seasonality Analysis & Trends in Wellington East (2025)
Peak Season (January, April, June)
- Revenue averages $4,785 per month
- Occupancy rates average 40.4%
- Daily rates average $338
Shoulder Season
- Revenue averages $3,214 per month
- Occupancy maintains around 35.5%
- Daily rates hold near $329
Low Season (March, July, September)
- Revenue drops to average $2,084 per month
- Occupancy decreases to average 25.8%
- Daily rates adjust to average $313
Seasonality Insights for Wellington East
- The Airbnb seasonality in Wellington East shows highly seasonal trends requiring careful strategy. While the sections above show seasonal averages, it's also insightful to look at the extremes:
- During the high season, the absolute peak month showcases Wellington East's highest earning potential, with monthly revenues capable of climbing to $5,599, occupancy reaching a high of 48.0%, and ADRs peaking at $373.
- Conversely, the slowest single month of the year, typically falling within the low season, marks the market's lowest point. In this month, revenue might dip to $2,035, occupancy could drop to 22.1%, and ADRs may adjust down to $305.
- Understanding both the seasonal averages and these monthly peaks and troughs in revenue, occupancy, and ADR is crucial for maximizing your Airbnb profit potential in Wellington East.
Seasonal Strategies for Maximizing Profit
- Peak Season: Maximize revenue through premium pricing and potentially longer minimum stays. Ensure high availability.
- Low Season: Offer competitive pricing, special promotions (e.g., extended stay discounts), and flexible cancellation policies. Target off-season travelers like remote workers or budget-conscious guests.
- Shoulder Seasons: Implement dynamic pricing that balances peak and low rates. Target weekend travelers or specific events. Offer slightly more flexible terms than peak season.
- Regularly analyze your own performance against these Wellington East seasonality benchmarks and adjust your pricing and availability strategy accordingly.
Best Areas for Airbnb Investment in Wellington East (2025)
Exploring the top neighborhoods for short-term rentals in Wellington East? This section highlights key areas, outlining why they are attractive for hosts and guests, along with notable local attractions. Consider these locations based on your target guest profile and investment strategy.
| Neighborhood / Area | Why Host Here? (Target Guests & Appeal) | Key Attractions & Landmarks |
|---|---|---|
| Wellington Central | The heart of Wellington, surrounded by cafes, restaurants, and shops. A vibrant cultural scene makes it a go-to for both tourists and business travelers looking for convenience and entertainment. | Cuba Street, Te Papa Museum, Wellington Waterfront, Wellington Cable Car, Botanical Gardens, Local craft breweries |
| Mount Victoria | A charming residential area known for its stunning views and proximity to the city center. Popular with travelers seeking a more relaxed atmosphere while still being close to urban attractions. | Mount Victoria Lookout, Cameron Highlanders' Memorial, Local parks, Walking trails, Quaint cafes |
| Kelburn | Home to Victoria University, this area attracts students and academic visitors. It's also known for its picturesque homes and gardens, making it appealing for a quieter stay with easy access to the university. | Kelburn Park, Wellington Zoo, Victoria University, Local dining options, Botanical Gardens |
| Lyall Bay | A coastal suburb known for its beautiful beach and surf culture. Ideal for beach lovers and those seeking a relaxed seaside atmosphere while still being close to the city's attractions. | Lyall Bay Beach, Surf Lifesaving Club, Local cafes, Walking and cycling paths |
| Thorndon | A historic neighborhood with beautiful old architecture and close proximity to the governmental district of Wellington. Great for visitors seeking a taste of Wellington's history and political life. | Thornon Quay, Old St. Paul's Cathedral, Wellington Botanic Garden, The Beehive, Parliament Buildings |
| Karori | This suburb offers a family-friendly atmosphere and access to nature reserves. It’s great for those who enjoy a quieter stay with plenty of hiking and outdoor opportunities nearby. | Karori Wildlife Sanctuary, Local parks, Walking trails, Karori Park, Family-friendly activities |
| Miramar | Known for its film industry connections and proximity to the Weta Workshop, Miramar is popular among fans of film and television. Offers a unique slice of Wellington's creative culture. | Weta Workshop, Miramar Film Studios, Local eateries, Scenic coastal walks |
| Newtown | A vibrant, multicultural suburb known for its bohemian vibe and artsy community. It's popular with younger travelers and those looking to experience the local culture and nightlife. | Newtown Festival, Local art galleries, Vibrant street art, Cafes and restaurants, Live music venues |
Understanding Airbnb License Requirements & STR Laws in Wellington East (2025)
While Wellington East, South Australia, Australia currently shows low STR regulations, specific Airbnb license requirements might still exist or change. Always verify the latest short term rental regulations and Airbnb license requirements directly with local government authorities for Wellington East to ensure full compliance before hosting.
(Source: AirROI data, 2025, finding no licensed listings among those analyzed)
Top Performing Airbnb Properties in Wellington East (2025)
Benchmark your potential! Explore examples of top-performing Airbnb properties in Wellington Eastbased on Trailing Twelve Month (TTM) revenue. Analyze their characteristics, revenue, occupancy rate, and ADR to understand what drives success in this market.

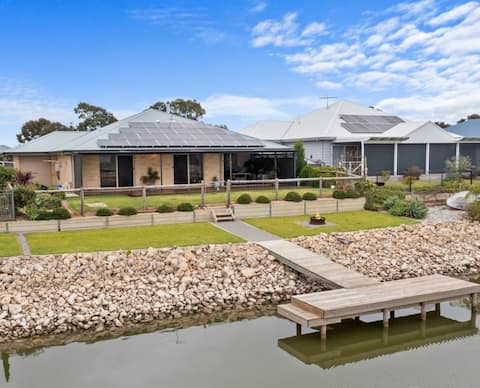
Olley's Place
Entire Place • 4 bedrooms

River Life - Holiday Home with Secluded Riverbank
Entire Place • 5 bedrooms
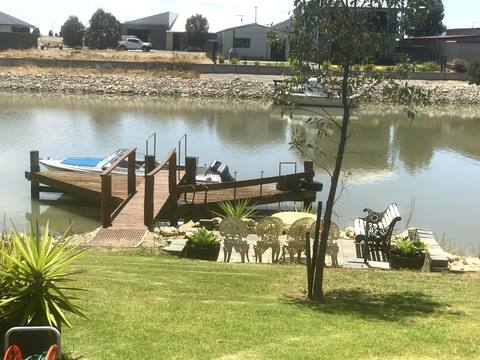
Experience river life
Entire Place • 3 bedrooms

The Cube Murray River
Entire Place • 1 bedroom
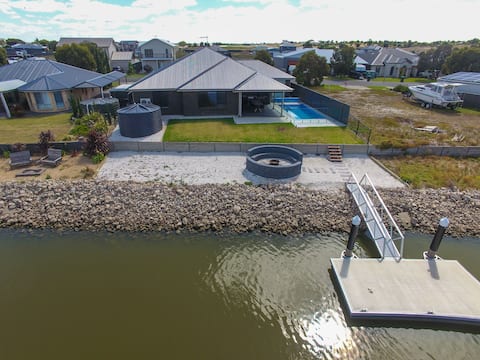
Riverside Resort 20 Jefferson ct
Entire Place • 4 bedrooms
Sparkling Waters 9 Jefferson Court, Wellington
Entire Place • 4 bedrooms
Note: Performance varies based on location, size, amenities, seasonality, and management quality. Data reflects the past 12 months.
Top Performing Airbnb Hosts in Wellington East (2025)
Learn from the best! This table showcases top-performing Airbnb hosts in Wellington East based on the number of properties managed and estimated total revenue over the past year. Analyze their scale and performance metrics.
| Host Name | Properties | Grossing Revenue | Stay Reviews | Avg Rating |
|---|---|---|---|---|
| David & Wendy | 3 | $90,977 | 7 | 3.33/5.0 |
| Gill | 2 | $76,765 | 147 | 4.73/5.0 |
| Rachel | 1 | $71,335 | 33 | 5.00/5.0 |
| Anastasia | 1 | $62,471 | 35 | 4.94/5.0 |
| Julie | 1 | $58,265 | 68 | 4.91/5.0 |
| Lindy And Wayne | 2 | $50,586 | 73 | 4.87/5.0 |
| Coorong Realty | 2 | $46,675 | 24 | 4.67/5.0 |
| Sarah | 1 | $36,461 | 8 | 5.00/5.0 |
| Sandy & Vish | 1 | $29,647 | 59 | 4.85/5.0 |
| Amanda | 1 | $23,240 | 94 | 4.84/5.0 |
Analyzing the strategies of top hosts, such as their property selection, pricing, and guest communication, can offer valuable lessons for optimizing your own Airbnb operations in Wellington East.
Dive Deeper: Advanced Wellington East STR Market Data (2025)
Ready to unlock more insights? AirROI provides access to advanced metrics and comprehensive Airbnb data for Wellington East. Explore detailed analytics beyond this report to refine your investment strategy, optimize pricing, and maximize your vacation rental profits.
Explore Advanced MetricsWellington East Short-Term Rental Market Composition (2025): Property & Room Types
Room Type Distribution
Property Type Distribution
Market Composition Insights for Wellington East
- The Wellington East Airbnb market composition is heavily skewed towards Entire Home/Apt listings, which make up 100% of the 18 active rentals. This indicates strong guest preference for privacy and space.
- Looking at the property type distribution in Wellington East, House properties are the most common (83.3%), reflecting the local real estate landscape.
- Houses represent a significant 83.3% portion, catering likely to families or larger groups.
- The presence of 5.6% Hotel/Boutique listings indicates integration with traditional hospitality.
Wellington East Airbnb Room Capacity Analysis (2025): Bedroom Distribution
Distribution of Listings by Number of Bedrooms
Room Capacity Insights for Wellington East
- The dominant room capacity in Wellington East is 4 bedrooms listings, making up 44.4% of the market. This suggests a strong demand for properties suitable for families or small groups.
- Together, 4 bedrooms and 5+ bedrooms properties represent 66.6% of the active Airbnb listings in Wellington East, indicating a high concentration in these sizes.
- A significant 83.3% of listings offer 3+ bedrooms, catering to larger groups and families seeking more space in Wellington East.
Wellington East Vacation Rental Guest Capacity Trends (2025)
Distribution of Listings by Guest Capacity
Guest Capacity Insights for Wellington East
- The most common guest capacity trend in Wellington East vacation rentals is listings accommodating 8+ guests (77.8%). This suggests the primary traveler segment is likely larger groups.
- Properties designed for 8+ guests and 2 guests dominate the Wellington East STR market, accounting for 88.9% of listings.
- 83.4% of properties accommodate 6+ guests, serving the market segment for larger families or group travel in Wellington East.
- On average, properties in Wellington East are equipped to host 7.0 guests.
Wellington East Airbnb Booking Patterns (2025): Available vs. Booked Days
Available Days Distribution
Booked Days Distribution
Booking Pattern Insights for Wellington East
- The most common availability pattern in Wellington East falls within the 181-270 days range, representing 50% of listings. This suggests many properties have significant open periods on their calendars.
- Approximately 88.9% of listings show high availability (181+ days open annually), indicating potential for increased bookings or specific owner usage patterns.
- For booked days, the 91-180 days range is most frequent in Wellington East (55.6%), reflecting common guest stay durations or potential owner blocking patterns.
- A notable 11.2% of properties secure long booking periods (181+ days booked per year), highlighting successful long-term rental strategies or significant owner usage.
Wellington East Airbnb Minimum Stay Requirements Analysis
Distribution of Listings by Minimum Night Requirement
1 Night
1 listings
5.6% of total
2 Nights
7 listings
38.9% of total
3 Nights
1 listings
5.6% of total
30+ Nights
9 listings
50% of total
Key Insights
- The most prevalent minimum stay requirement in Wellington East is 30+ Nights, adopted by 50% of listings. This highlights the market's preference for longer commitments.
- A significant segment (50%) caters to monthly stays (30+ nights) in Wellington East, pointing to opportunities in the extended-stay market.
Recommendations
- Align with the market by considering a 30+ Nights minimum stay, as 50% of Wellington East hosts use this setting.
- If feasible, allowing 1-night stays, especially midweek or during low season, could capture last-minute bookings, as only 5.6% currently do.
- A 2-night minimum appears standard (38.9%). Consider this for weekends or peak periods.
- Explore offering discounts for stays of 30+ nights to attract the 50% of the market seeking extended stays.
- Adjust minimum nights based on seasonality – potentially shorter during low season and longer during peak demand periods in Wellington East.
Wellington East Airbnb Cancellation Policy Trends Analysis (2025)
Super Strict 30 Days
2 listings
11.8% of total
Flexible
1 listings
5.9% of total
Moderate
3 listings
17.6% of total
Firm
5 listings
29.4% of total
Strict
6 listings
35.3% of total
Cancellation Policy Insights for Wellington East
- The prevailing Airbnb cancellation policy trend in Wellington East is Strict, used by 35.3% of listings.
- A majority (64.7%) of hosts in Wellington East utilize Firm or Strict policies, indicating a market where hosts prioritize booking security.
Recommendations for Hosts
- Consider adopting a Strict policy to align with the 35.3% market standard in Wellington East.
- With 35.3% using Strict terms, this is a viable option in Wellington East, particularly for high-value properties or during peak demand periods.
- Regularly review your cancellation policy against competitors and market demand shifts in Wellington East.
Wellington East STR Booking Lead Time Analysis (2025)
Average Booking Lead Time by Month
Booking Lead Time Insights for Wellington East
- The overall average booking lead time for vacation rentals in Wellington East is 69 days.
- Guests book furthest in advance for stays during October (average 88 days), likely coinciding with peak travel demand or local events.
- The shortest booking windows occur for stays in September (average 23 days), indicating more last-minute travel plans during this time.
- Seasonally, Winter (72 days avg.) sees the longest lead times, while Summer (47 days avg.) has the shortest, reflecting typical travel planning cycles.
Recommendations for Hosts
- Use the overall average lead time (69 days) as a baseline for your pricing and availability strategy in Wellington East.
- For October stays, consider implementing length-of-stay discounts or slightly higher rates for bookings made less than 88 days out to capitalize on advance planning.
- Target marketing efforts for the Winter season well in advance (at least 72 days) to capture early planners.
- Monitor your own booking lead times against these Wellington East averages to identify opportunities for dynamic pricing adjustments.
Popular & Essential Airbnb Amenities in Wellington East (2025)
Amenity Prevalence
Amenity Insights for Wellington East
- Essential amenities in Wellington East that guests expect include: TV, Smoke alarm, Free parking on premises, Essentials. Lacking these (any) could significantly impact bookings.
- Popular amenities like Air conditioning, Kitchen, Washer are common but not universal. Offering these can provide a competitive edge.
Recommendations for Hosts
- Ensure your listing includes all essential amenities for Wellington East: TV, Smoke alarm, Free parking on premises, Essentials.
- Consider adding popular differentiators like Air conditioning or Kitchen to increase appeal.
- Highlight unique or less common amenities you offer (e.g., hot tub, dedicated workspace, EV charger) in your listing description and photos.
- Regularly check competitor amenities in Wellington East to stay competitive.
Wellington East Airbnb Guest Demographics & Profile Analysis (2025)
Guest Profile Summary for Wellington East
- The typical guest profile for Airbnb in Wellington East consists of primarily domestic travelers (98%), often arriving from nearby Adelaide, typically belonging to the Post-2000s (Gen Z/Alpha) group (50%), primarily speaking English or Portuguese.
- Domestic travelers account for 97.6% of guests.
- Key international markets include Australia (97.6%) and Hong Kong (1.6%).
- Top languages spoken are English (90.7%) followed by Portuguese (7%).
- A significant demographic segment is the Post-2000s (Gen Z/Alpha) group, representing 50% of guests.
Recommendations for Hosts
- Target domestic marketing efforts towards travelers from Adelaide and Sydney.
- Tailor amenities and listing descriptions to appeal to the dominant Post-2000s (Gen Z/Alpha) demographic (e.g., highlight fast WiFi, smart home features, local guides).
- Highlight unique local experiences or amenities relevant to the primary guest profile.
- Consider seasonal promotions aligned with peak travel times for key origin markets.
Nearby Short-Term Rental Market Comparison
How does the Wellington East Airbnb market stack up against its neighbors? Compare key performance metrics like average monthly revenue, ADR, and occupancy rates in surrounding areas to understand the broader regional STR landscape.
| Market | Active Properties | Monthly Revenue | Daily Rate | Avg. Occupancy |
|---|---|---|---|---|
| Lyndoch | 21 | $4,127 | $378.23 | 36% |
| Nuriootpa | 19 | $3,539 | $320.16 | 41% |
| Tanunda | 90 | $3,531 | $278.27 | 44% |
| Light Regional Council | 18 | $3,443 | $287.57 | 42% |
| Stirling | 36 | $3,306 | $311.89 | 42% |
| Uraidla | 10 | $3,115 | $210.19 | 45% |
| Angaston | 51 | $3,099 | $294.72 | 41% |
| Auburn | 17 | $2,987 | $189.27 | 51% |
| Inman Valley | 12 | $2,894 | $257.68 | 32% |
| The Barossa Council | 30 | $2,785 | $253.15 | 38% |