The District Council of Grant Airbnb Market Analysis 2025: Short Term Rental Data & Vacation Rental Statistics in South Australia, Australia
Is Airbnb profitable in The District Council of Grant in 2025? Explore comprehensive Airbnb analytics for The District Council of Grant, South Australia, Australia to uncover income potential. This 2025 STR market report for The District Council of Grant, based on AirROI data from April 2024 to March 2025, reveals key trends in the niche market of 44 active listings.
Whether you're considering an Airbnb investment in The District Council of Grant, optimizing your existing vacation rental, or exploring rental arbitrage opportunities, understanding the The District Council of Grant Airbnb data is crucial. Leveraging the low regulation environment is key to maximizing your short term rental income potential. Let's dive into the specifics.
Key The District Council of Grant Airbnb Performance Metrics Overview
Monthly Airbnb Revenue Variations & Income Potential in The District Council of Grant (2025)
Understanding the monthly revenue variations for Airbnb listings in The District Council of Grant is key to maximizing your short term rental income potential. Seasonality significantly impacts earnings. Our analysis, based on data from the past 12 months, shows that the peak revenue month for STRs in The District Council of Grant is typically January, while August often presents the lowest earnings, highlighting opportunities for strategic pricing adjustments during shoulder and low seasons. Explore the typical Airbnb income in The District Council of Grant across different performance tiers:
- Best-in-class properties (Top 10%) achieve $3,983+ monthly, often utilizing dynamic pricing and superior guest experiences.
- Strong performing properties (Top 25%) earn $2,814 or more, indicating effective management and desirable locations/amenities.
- Typical properties (Median) generate around $1,686 per month, representing the average market performance.
- Entry-level properties (Bottom 25%) see earnings around $950, often with potential for optimization.
Average Monthly Airbnb Earnings Trend in The District Council of Grant
The District Council of Grant Airbnb Occupancy Rate Trends (2025)
Maximize your bookings by understanding the The District Council of Grant STR occupancy trends. Seasonal demand shifts significantly influence how often properties are booked. Typically, Januarysees the highest demand (peak season occupancy), while August experiences the lowest (low season). Effective strategies, like adjusting minimum stays or offering promotions, can boost occupancy during slower periods. Here's how different property tiers perform in The District Council of Grant:
- Best-in-class properties (Top 10%) achieve 78%+ occupancy, indicating high desirability and potentially optimized availability.
- Strong performing properties (Top 25%) maintain 59% or higher occupancy, suggesting good market fit and guest satisfaction.
- Typical properties (Median) have an occupancy rate around 37%.
- Entry-level properties (Bottom 25%) average 22% occupancy, potentially facing higher vacancy.
Average Monthly Occupancy Rate Trend in The District Council of Grant
Average Daily Rate (ADR) Airbnb Trends in The District Council of Grant (2025)
Effective short term rental pricing strategy in The District Council of Grant involves understanding monthly ADR fluctuations. The Average Daily Rate (ADR) for Airbnb in The District Council of Grant typically peaks in January and dips lowest during March. Leveraging Airbnb dynamic pricing tools or strategies based on this seasonality can significantly boost revenue. Here's a look at the typical nightly rates achieved:
- Best-in-class properties (Top 10%) command rates of $216+ per night, often due to premium features or locations.
- Strong performing properties (Top 25%) achieve nightly rates of $171 or more.
- Typical properties (Median) charge around $142 per night.
- Entry-level properties (Bottom 25%) earn around $113 per night.
Average Daily Rate (ADR) Trend by Month in The District Council of Grant
Get Live The District Council of Grant Market Intelligence 👇

Explore Real-time Analytics
Airbnb Seasonality Analysis & Trends in The District Council of Grant (2025)
Peak Season (January, December, April)
- Revenue averages $2,894 per month
- Occupancy rates average 55.7%
- Daily rates average $159
Shoulder Season
- Revenue averages $1,935 per month
- Occupancy maintains around 37.3%
- Daily rates hold near $154
Low Season (February, March, August)
- Revenue drops to average $1,512 per month
- Occupancy decreases to average 37.0%
- Daily rates adjust to average $149
Seasonality Insights for The District Council of Grant
- The Airbnb seasonality in The District Council of Grant shows highly seasonal trends requiring careful strategy. While the sections above show seasonal averages, it's also insightful to look at the extremes:
- During the high season, the absolute peak month showcases The District Council of Grant's highest earning potential, with monthly revenues capable of climbing to $3,236, occupancy reaching a high of 64.4%, and ADRs peaking at $163.
- Conversely, the slowest single month of the year, typically falling within the low season, marks the market's lowest point. In this month, revenue might dip to $1,283, occupancy could drop to 30.6%, and ADRs may adjust down to $147.
- Understanding both the seasonal averages and these monthly peaks and troughs in revenue, occupancy, and ADR is crucial for maximizing your Airbnb profit potential in The District Council of Grant.
Seasonal Strategies for Maximizing Profit
- Peak Season: Maximize revenue through premium pricing and potentially longer minimum stays. Ensure high availability.
- Low Season: Offer competitive pricing, special promotions (e.g., extended stay discounts), and flexible cancellation policies. Target off-season travelers like remote workers or budget-conscious guests.
- Shoulder Seasons: Implement dynamic pricing that balances peak and low rates. Target weekend travelers or specific events. Offer slightly more flexible terms than peak season.
- Regularly analyze your own performance against these The District Council of Grant seasonality benchmarks and adjust your pricing and availability strategy accordingly.
Best Areas for Airbnb Investment in The District Council of Grant (2025)
Exploring the top neighborhoods for short-term rentals in The District Council of Grant? This section highlights key areas, outlining why they are attractive for hosts and guests, along with notable local attractions. Consider these locations based on your target guest profile and investment strategy.
| Neighborhood / Area | Why Host Here? (Target Guests & Appeal) | Key Attractions & Landmarks |
|---|---|---|
| Mount Gambier | A popular destination known for its stunning blue lake and limestone caves. It's a central location in the South East, attracting tourists and nature lovers. | Blue Lake, Umpherston Sinkhole, Englebrecht Cave, Mount Gambier Railway Lands, Cave Gardens, Leg of Mutton Lake |
| Portland | A coastal town offering historical maritime attractions and beautiful beaches. Ideal for those looking to enjoy fishing, surfing, and local history. | Portland Cable Trams, Cape Nelson Lighthouse, Portland Botanic Gardens, Great South West Walk, Portland Maritime Discovery Centre, Bridgewater Bay |
| Robe | A charming seaside town known for its festivals, beach activities and historic buildings. A favorite for holiday makers looking for relaxation by the sea. | Robe Beach, Cape Dombey Obelisk, Robe Fishing Boat Harbour, Robe Wine Centre, Long Beach, Little Dip Conservation Park |
| Millicent | Known for its rich timber industry history and proximity to national parks. A great area for families and nature enthusiasts. | Millicent National Trust Museum, Lake McIntyre, Canunda National Park, Tantanoola Caves Conservation Park, Millicent Swimming Lake |
| Naracoorte | Famous for its caves and fossil deposits, it's a UNESCO World Heritage site attracting adventurous visitors and history buffs. | Naracoorte Caves National Park, Little Blue Lake, Naracoorte Historical Society Museum, Black Cockatoo Conservation Centre |
| Penola | Rich in wine culture and close to Coonawarra wine region. Ideal for wine lovers and foodies. | Coonawarra Wine Trail, Petticoat Lane Vineyard, Penola's Historic Precinct, Yallum Park Garden, Penola Conservation Park |
| Bordertown | Close to the border of Victoria, this town offers a mix of local culture and access to various outdoor activities. | Tatiara District Historical Society, Border Town Pioneer Park, Bordertown Community Golf Club |
| Riley | A small but growing area known for easy access to regional centers and natural attractions, appealing to travelers seeking off-the-beaten-path experiences. | Local parks, Scenic walking trails, Community events |
Understanding Airbnb License Requirements & STR Laws in The District Council of Grant (2025)
While The District Council of Grant, South Australia, Australia currently shows low STR regulations, specific Airbnb license requirements might still exist or change. Always verify the latest short term rental regulations and Airbnb license requirements directly with local government authorities for The District Council of Grant to ensure full compliance before hosting.
(Source: AirROI data, 2025, finding no licensed listings among those analyzed)
Top Performing Airbnb Properties in The District Council of Grant (2025)
Benchmark your potential! Explore examples of top-performing Airbnb properties in The District Council of Grantbased on Trailing Twelve Month (TTM) revenue. Analyze their characteristics, revenue, occupancy rate, and ADR to understand what drives success in this market.
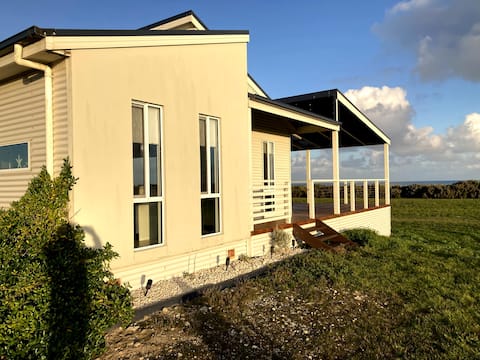
Sandy Bottoms Beach Escape
Entire Place • 4 bedrooms
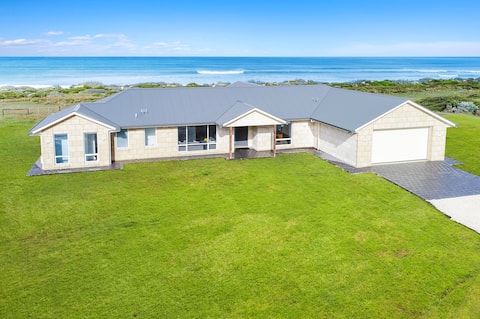
ON THE BEACH
Entire Place • 4 bedrooms
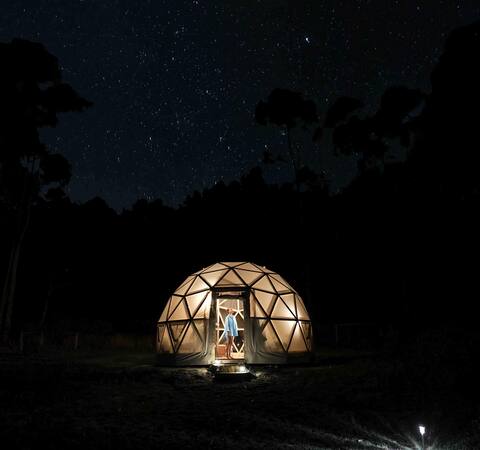
Two geodesic domes on a volcano | Dog-friendly
Entire Place • 2 bedrooms
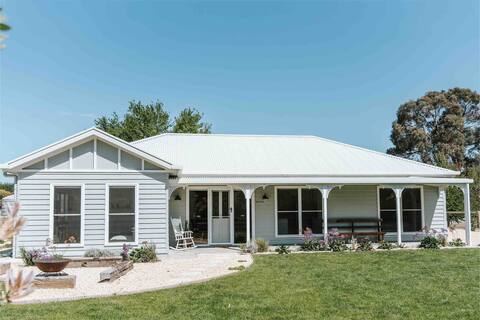
Kookaburra Cottage
Entire Place • 3 bedrooms

Amaroo Beach Shack
Entire Place • 3 bedrooms

Bright and cosy 3- bedroom off grid The Paradise
Entire Place • 3 bedrooms
Note: Performance varies based on location, size, amenities, seasonality, and management quality. Data reflects the past 12 months.
Top Performing Airbnb Hosts in The District Council of Grant (2025)
Learn from the best! This table showcases top-performing Airbnb hosts in The District Council of Grant based on the number of properties managed and estimated total revenue over the past year. Analyze their scale and performance metrics.
| Host Name | Properties | Grossing Revenue | Stay Reviews | Avg Rating |
|---|---|---|---|---|
| Frank | 6 | $108,076 | 404 | 4.71/5.0 |
| Pine Country | 5 | $82,956 | 362 | 3.73/5.0 |
| Zoe | 5 | $82,035 | 592 | 4.71/5.0 |
| Sharon | 1 | $56,471 | 50 | 4.92/5.0 |
| Ian & Kerrie | 1 | $54,269 | 54 | 4.89/5.0 |
| Rachel | 2 | $49,688 | 142 | 4.87/5.0 |
| Liana & Chris | 1 | $43,463 | 108 | 5.00/5.0 |
| Andrew | 1 | $41,253 | 8 | 5.00/5.0 |
| Imee | 1 | $40,699 | 22 | 4.77/5.0 |
| Mark, Alyce & Evie | 1 | $38,159 | 170 | 4.92/5.0 |
Analyzing the strategies of top hosts, such as their property selection, pricing, and guest communication, can offer valuable lessons for optimizing your own Airbnb operations in The District Council of Grant.
Dive Deeper: Advanced The District Council of Grant STR Market Data (2025)
Ready to unlock more insights? AirROI provides access to advanced metrics and comprehensive Airbnb data for The District Council of Grant. Explore detailed analytics beyond this report to refine your investment strategy, optimize pricing, and maximize your vacation rental profits.
Explore Advanced MetricsThe District Council of Grant Short-Term Rental Market Composition (2025): Property & Room Types
Room Type Distribution
Property Type Distribution
Market Composition Insights for The District Council of Grant
- The The District Council of Grant Airbnb market composition is heavily skewed towards Entire Home/Apt listings, which make up 90.9% of the 44 active rentals. This indicates strong guest preference for privacy and space.
- Looking at the property type distribution in The District Council of Grant, House properties are the most common (47.7%), reflecting the local real estate landscape.
- Houses represent a significant 47.7% portion, catering likely to families or larger groups.
- The presence of 6.8% Hotel/Boutique listings indicates integration with traditional hospitality.
- Smaller segments like unique stays (combined 2.3%) offer potential for unique stay experiences.
The District Council of Grant Airbnb Room Capacity Analysis (2025): Bedroom Distribution
Distribution of Listings by Number of Bedrooms
Room Capacity Insights for The District Council of Grant
- The dominant room capacity in The District Council of Grant is 2 bedrooms listings, making up 34.1% of the market. This suggests a strong demand for properties suitable for couples or solo travelers.
- Together, 2 bedrooms and 3 bedrooms properties represent 65.9% of the active Airbnb listings in The District Council of Grant, indicating a high concentration in these sizes.
- A significant 38.6% of listings offer 3+ bedrooms, catering to larger groups and families seeking more space in The District Council of Grant.
The District Council of Grant Vacation Rental Guest Capacity Trends (2025)
Distribution of Listings by Guest Capacity
Guest Capacity Insights for The District Council of Grant
- The most common guest capacity trend in The District Council of Grant vacation rentals is listings accommodating 4 guests (22.7%). This suggests the primary traveler segment is likely small families or groups.
- Properties designed for 4 guests and 6 guests dominate the The District Council of Grant STR market, accounting for 43.2% of listings.
- 45.5% of properties accommodate 6+ guests, serving the market segment for larger families or group travel in The District Council of Grant.
- On average, properties in The District Council of Grant are equipped to host 5.2 guests.
The District Council of Grant Airbnb Booking Patterns (2025): Available vs. Booked Days
Available Days Distribution
Booked Days Distribution
Booking Pattern Insights for The District Council of Grant
- The most common availability pattern in The District Council of Grant falls within the 181-270 days range, representing 45.5% of listings. This suggests many properties have significant open periods on their calendars.
- Approximately 66.0% of listings show high availability (181+ days open annually), indicating potential for increased bookings or specific owner usage patterns.
- For booked days, the 91-180 days range is most frequent in The District Council of Grant (45.5%), reflecting common guest stay durations or potential owner blocking patterns.
- A notable 34.0% of properties secure long booking periods (181+ days booked per year), highlighting successful long-term rental strategies or significant owner usage.
The District Council of Grant Airbnb Minimum Stay Requirements Analysis
Distribution of Listings by Minimum Night Requirement
1 Night
13 listings
30.2% of total
2 Nights
14 listings
32.6% of total
3 Nights
3 listings
7% of total
30+ Nights
13 listings
30.2% of total
Key Insights
- The most prevalent minimum stay requirement in The District Council of Grant is 2 Nights, adopted by 32.6% of listings. This highlights the market's preference for shorter, flexible bookings.
- A strong majority (62.8%) of the The District Council of Grant Airbnb data shows acceptance of very short stays (1-2 nights), indicating a dynamic, high-turnover market.
- A significant segment (30.2%) caters to monthly stays (30+ nights) in The District Council of Grant, pointing to opportunities in the extended-stay market.
Recommendations
- Align with the market by considering a 2 Nights minimum stay, as 32.6% of The District Council of Grant hosts use this setting.
- Explore offering discounts for stays of 30+ nights to attract the 30.2% of the market seeking extended stays.
- Adjust minimum nights based on seasonality – potentially shorter during low season and longer during peak demand periods in The District Council of Grant.
The District Council of Grant Airbnb Cancellation Policy Trends Analysis (2025)
Flexible
6 listings
14% of total
Moderate
18 listings
41.9% of total
Firm
9 listings
20.9% of total
Strict
10 listings
23.3% of total
Cancellation Policy Insights for The District Council of Grant
- The prevailing Airbnb cancellation policy trend in The District Council of Grant is Moderate, used by 41.9% of listings.
- There's a relatively balanced mix between guest-friendly (55.9%) and stricter (44.2%) policies, offering choices for different guest needs.
Recommendations for Hosts
- Consider adopting a Moderate policy to align with the 41.9% market standard in The District Council of Grant.
- Regularly review your cancellation policy against competitors and market demand shifts in The District Council of Grant.
The District Council of Grant STR Booking Lead Time Analysis (2025)
Average Booking Lead Time by Month
Booking Lead Time Insights for The District Council of Grant
- The overall average booking lead time for vacation rentals in The District Council of Grant is 47 days.
- Guests book furthest in advance for stays during December (average 80 days), likely coinciding with peak travel demand or local events.
- The shortest booking windows occur for stays in September (average 29 days), indicating more last-minute travel plans during this time.
- Seasonally, Winter (61 days avg.) sees the longest lead times, while Summer (38 days avg.) has the shortest, reflecting typical travel planning cycles.
Recommendations for Hosts
- Use the overall average lead time (47 days) as a baseline for your pricing and availability strategy in The District Council of Grant.
- For December stays, consider implementing length-of-stay discounts or slightly higher rates for bookings made less than 80 days out to capitalize on advance planning.
- Target marketing efforts for the Winter season well in advance (at least 61 days) to capture early planners.
- Monitor your own booking lead times against these The District Council of Grant averages to identify opportunities for dynamic pricing adjustments.
Popular & Essential Airbnb Amenities in The District Council of Grant (2025)
Amenity Prevalence
Amenity Insights for The District Council of Grant
- Essential amenities in The District Council of Grant that guests expect include: Free parking on premises, Hot water, Kitchen, Refrigerator. Lacking these (any) could significantly impact bookings.
- Popular amenities like Microwave, TV, Heating are common but not universal. Offering these can provide a competitive edge.
Recommendations for Hosts
- Ensure your listing includes all essential amenities for The District Council of Grant: Free parking on premises, Hot water, Kitchen, Refrigerator.
- Prioritize adding missing essentials: Hot water, Kitchen, Refrigerator.
- Consider adding popular differentiators like Microwave or TV to increase appeal.
- Highlight unique or less common amenities you offer (e.g., hot tub, dedicated workspace, EV charger) in your listing description and photos.
- Regularly check competitor amenities in The District Council of Grant to stay competitive.
The District Council of Grant Airbnb Guest Demographics & Profile Analysis (2025)
Guest Profile Summary for The District Council of Grant
- The typical guest profile for Airbnb in The District Council of Grant consists of primarily domestic travelers (91%), often arriving from nearby Adelaide, typically belonging to the Post-2000s (Gen Z/Alpha) group (50%), primarily speaking English or Chinese.
- Domestic travelers account for 90.7% of guests.
- Key international markets include Australia (90.7%) and Singapore (1.8%).
- Top languages spoken are English (66.9%) followed by Chinese (8.5%).
- A significant demographic segment is the Post-2000s (Gen Z/Alpha) group, representing 50% of guests.
Recommendations for Hosts
- Target domestic marketing efforts towards travelers from Adelaide and Melbourne.
- Tailor amenities and listing descriptions to appeal to the dominant Post-2000s (Gen Z/Alpha) demographic (e.g., highlight fast WiFi, smart home features, local guides).
- Highlight unique local experiences or amenities relevant to the primary guest profile.
- Consider seasonal promotions aligned with peak travel times for key origin markets.
Nearby Short-Term Rental Market Comparison
How does the The District Council of Grant Airbnb market stack up against its neighbors? Compare key performance metrics like average monthly revenue, ADR, and occupancy rates in surrounding areas to understand the broader regional STR landscape.
| Market | Active Properties | Monthly Revenue | Daily Rate | Avg. Occupancy |
|---|---|---|---|---|
| Mount Gambier | 106 | $2,173 | $143.34 | 52% |
| Robe | 244 | $2,108 | $195.34 | 39% |
| Kingston SE | 10 | $2,003 | $181.01 | 41% |
| Penola | 27 | $1,913 | $141.88 | 46% |
| Naracoorte | 20 | $1,881 | $164.40 | 42% |
| Port MacDonnell | 29 | $1,811 | $142.96 | 43% |
| Portland | 72 | $1,777 | $151.50 | 45% |
| Beachport | 38 | $1,723 | $219.26 | 32% |
| Shire of Glenelg | 45 | $1,698 | $183.83 | 34% |
| Nelson | 21 | $1,306 | $126.18 | 39% |