Stirling Airbnb Market Analysis 2025: Short Term Rental Data & Vacation Rental Statistics in South Australia, Australia
Is Airbnb profitable in Stirling in 2025? Explore comprehensive Airbnb analytics for Stirling, South Australia, Australia to uncover income potential. This 2025 STR market report for Stirling, based on AirROI data from April 2024 to March 2025, reveals key trends in the niche market of 36 active listings.
Whether you're considering an Airbnb investment in Stirling, optimizing your existing vacation rental, or exploring rental arbitrage opportunities, understanding the Stirling Airbnb data is crucial. Leveraging the low regulation environment is key to maximizing your short term rental income potential. Let's dive into the specifics.
Key Stirling Airbnb Performance Metrics Overview
Monthly Airbnb Revenue Variations & Income Potential in Stirling (2025)
Understanding the monthly revenue variations for Airbnb listings in Stirling is key to maximizing your short term rental income potential. Seasonality significantly impacts earnings. Our analysis, based on data from the past 12 months, shows that the peak revenue month for STRs in Stirling is typically April, while August often presents the lowest earnings, highlighting opportunities for strategic pricing adjustments during shoulder and low seasons. Explore the typical Airbnb income in Stirling across different performance tiers:
- Best-in-class properties (Top 10%) achieve $6,923+ monthly, often utilizing dynamic pricing and superior guest experiences.
- Strong performing properties (Top 25%) earn $5,204 or more, indicating effective management and desirable locations/amenities.
- Typical properties (Median) generate around $3,312 per month, representing the average market performance.
- Entry-level properties (Bottom 25%) see earnings around $2,088, often with potential for optimization.
Average Monthly Airbnb Earnings Trend in Stirling
Stirling Airbnb Occupancy Rate Trends (2025)
Maximize your bookings by understanding the Stirling STR occupancy trends. Seasonal demand shifts significantly influence how often properties are booked. Typically, Aprilsees the highest demand (peak season occupancy), while August experiences the lowest (low season). Effective strategies, like adjusting minimum stays or offering promotions, can boost occupancy during slower periods. Here's how different property tiers perform in Stirling:
- Best-in-class properties (Top 10%) achieve 82%+ occupancy, indicating high desirability and potentially optimized availability.
- Strong performing properties (Top 25%) maintain 62% or higher occupancy, suggesting good market fit and guest satisfaction.
- Typical properties (Median) have an occupancy rate around 41%.
- Entry-level properties (Bottom 25%) average 24% occupancy, potentially facing higher vacancy.
Average Monthly Occupancy Rate Trend in Stirling
Average Daily Rate (ADR) Airbnb Trends in Stirling (2025)
Effective short term rental pricing strategy in Stirling involves understanding monthly ADR fluctuations. The Average Daily Rate (ADR) for Airbnb in Stirling typically peaks in November and dips lowest during March. Leveraging Airbnb dynamic pricing tools or strategies based on this seasonality can significantly boost revenue. Here's a look at the typical nightly rates achieved:
- Best-in-class properties (Top 10%) command rates of $496+ per night, often due to premium features or locations.
- Strong performing properties (Top 25%) achieve nightly rates of $314 or more.
- Typical properties (Median) charge around $229 per night.
- Entry-level properties (Bottom 25%) earn around $184 per night.
Average Daily Rate (ADR) Trend by Month in Stirling
Get Live Stirling Market Intelligence 👇

Explore Real-time Analytics
Airbnb Seasonality Analysis & Trends in Stirling (2025)
Peak Season (April, June, May)
- Revenue averages $4,839 per month
- Occupancy rates average 48.6%
- Daily rates average $298
Shoulder Season
- Revenue averages $3,847 per month
- Occupancy maintains around 44.8%
- Daily rates hold near $300
Low Season (February, March, August)
- Revenue drops to average $3,076 per month
- Occupancy decreases to average 40.3%
- Daily rates adjust to average $288
Seasonality Insights for Stirling
- The Airbnb seasonality in Stirling shows moderate seasonality with distinct peak and low periods. While the sections above show seasonal averages, it's also insightful to look at the extremes:
- During the high season, the absolute peak month showcases Stirling's highest earning potential, with monthly revenues capable of climbing to $5,356, occupancy reaching a high of 57.2%, and ADRs peaking at $310.
- Conversely, the slowest single month of the year, typically falling within the low season, marks the market's lowest point. In this month, revenue might dip to $2,909, occupancy could drop to 34.7%, and ADRs may adjust down to $287.
- Understanding both the seasonal averages and these monthly peaks and troughs in revenue, occupancy, and ADR is crucial for maximizing your Airbnb profit potential in Stirling.
Seasonal Strategies for Maximizing Profit
- Peak Season: Maximize revenue through premium pricing and potentially longer minimum stays. Ensure high availability.
- Low Season: Offer competitive pricing, special promotions (e.g., extended stay discounts), and flexible cancellation policies. Target off-season travelers like remote workers or budget-conscious guests.
- Shoulder Seasons: Implement dynamic pricing that balances peak and low rates. Target weekend travelers or specific events. Offer slightly more flexible terms than peak season.
- Regularly analyze your own performance against these Stirling seasonality benchmarks and adjust your pricing and availability strategy accordingly.
Best Areas for Airbnb Investment in Stirling (2025)
Exploring the top neighborhoods for short-term rentals in Stirling? This section highlights key areas, outlining why they are attractive for hosts and guests, along with notable local attractions. Consider these locations based on your target guest profile and investment strategy.
| Neighborhood / Area | Why Host Here? (Target Guests & Appeal) | Key Attractions & Landmarks |
|---|---|---|
| Stirling Village | Charming village known for its historic buildings and lovely gardens. Close to cafes, boutique shops, and the beautiful Adelaide Hills, making it appealing for tourists and weekend getaways. | Stirling Market, Cleland Wildlife Park, Mount Lofty Botanic Garden, Adelaide Hills Wine Region, Stirling Golf Club |
| Morialta Conservation Park | A beautiful natural area featuring extensive hiking trails and stunning waterfalls. Perfect for nature lovers looking to explore the Australian bush and wildlife. | Morialta Falls, Hiking Trails, Picnic Areas, Wildlife Watching |
| Mount Barker | Rapidly growing town with a mix of country charm and urban conveniences. Offers a variety of dining options and easy access to the Adelaide Hills wine region. | Mount Barker Summit, Almonte's Cafe, Mount Barker Village, Adelaide Hills Wine Region |
| Crafers | Nestled in the Adelaide Hills, this area offers a serene retreat with beautiful views and proximity to nature. Attracts visitors seeking tranquility and outdoor activities. | Crafers Hotel, Crafers to Mount Lofty walking trail, Local vineyards, Gallery 95 |
| Aldgate | A picturesque suburb known for its historical homes and community atmosphere. It's close to both nature and urban conveniences, making it a great spot for visitors. | Aldgate Valley, Local Cafes, Historic Aldgate Railway Station |
| Bridgewater | A scenic area with access to walking trails and natural reserves. Ideal for those looking for outdoor adventures and explorations in a tranquil environment. | Bridgewater Mill, Walking Trails, Local Parks |
| Collinswood | This suburb offers a mix of residential charm and community amenities. Proximity to Adelaide makes it a convenient spot for visitors to stay and explore the city. | Collinswood Plaza, Local Parks, Cafes, Access to Public Transport |
| Dawesley | Known for its beautiful landscapes and rural charm. Perfect for guests looking for a peaceful retreat with access to nature. | Dawesley Reserve, Scenic Views, Hiking Trails |
Understanding Airbnb License Requirements & STR Laws in Stirling (2025)
While Stirling, South Australia, Australia currently shows low STR regulations, specific Airbnb license requirements might still exist or change. Always verify the latest short term rental regulations and Airbnb license requirements directly with local government authorities for Stirling to ensure full compliance before hosting.
(Source: AirROI data, 2025, based on 3% licensed listings)
Top Performing Airbnb Properties in Stirling (2025)
Benchmark your potential! Explore examples of top-performing Airbnb properties in Stirlingbased on Trailing Twelve Month (TTM) revenue. Analyze their characteristics, revenue, occupancy rate, and ADR to understand what drives success in this market.
Sprawling 6-bedroom home on 2 acres- indoor pool -
Entire Place • 6 bedrooms
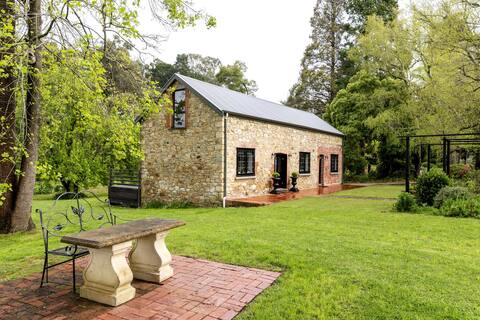
Pomona Barn
Entire Place • 2 bedrooms
Forest View House, Stirling.
Entire Place • 3 bedrooms
“The Lake house” Stirling Retreat
Entire Place • 3 bedrooms
THE STIRLING HOUSE - ADELAIDE HILLS
Entire Place • 5 bedrooms
Sunroom, Stirling Hotel - 5 min walk, Fireplace
Entire Place • 3 bedrooms
Note: Performance varies based on location, size, amenities, seasonality, and management quality. Data reflects the past 12 months.
Top Performing Airbnb Hosts in Stirling (2025)
Learn from the best! This table showcases top-performing Airbnb hosts in Stirling based on the number of properties managed and estimated total revenue over the past year. Analyze their scale and performance metrics.
| Host Name | Properties | Grossing Revenue | Stay Reviews | Avg Rating |
|---|---|---|---|---|
| The Retreat | 7 | $343,710 | 83 | 4.26/5.0 |
| The Crafers | 5 | $118,126 | 94 | 4.95/5.0 |
| Joanna | 4 | $107,236 | 10 | 2.50/5.0 |
| Claire | 2 | $94,716 | 81 | 4.95/5.0 |
| Melinda | 1 | $87,047 | 111 | 4.93/5.0 |
| Emily | 1 | $82,884 | 115 | 4.92/5.0 |
| Garth And Lucy | 1 | $76,463 | 95 | 4.99/5.0 |
| Angus And Anoushka | 1 | $69,654 | 103 | 4.86/5.0 |
| Hannah | 1 | $62,808 | 16 | 4.94/5.0 |
| Jane | 1 | $59,287 | 149 | 4.98/5.0 |
Analyzing the strategies of top hosts, such as their property selection, pricing, and guest communication, can offer valuable lessons for optimizing your own Airbnb operations in Stirling.
Dive Deeper: Advanced Stirling STR Market Data (2025)
Ready to unlock more insights? AirROI provides access to advanced metrics and comprehensive Airbnb data for Stirling. Explore detailed analytics beyond this report to refine your investment strategy, optimize pricing, and maximize your vacation rental profits.
Explore Advanced MetricsStirling Short-Term Rental Market Composition (2025): Property & Room Types
Room Type Distribution
Property Type Distribution
Market Composition Insights for Stirling
- The Stirling Airbnb market composition is heavily skewed towards Entire Home/Apt listings, which make up 86.1% of the 36 active rentals. This indicates strong guest preference for privacy and space.
- Looking at the property type distribution in Stirling, House properties are the most common (58.3%), reflecting the local real estate landscape.
- Houses represent a significant 58.3% portion, catering likely to families or larger groups.
- The presence of 19.4% Hotel/Boutique listings indicates integration with traditional hospitality.
- Smaller segments like unique stays (combined 2.8%) offer potential for unique stay experiences.
Stirling Airbnb Room Capacity Analysis (2025): Bedroom Distribution
Distribution of Listings by Number of Bedrooms
Room Capacity Insights for Stirling
- The dominant room capacity in Stirling is 1 bedroom listings, making up 44.4% of the market. This suggests a strong demand for properties suitable for couples or solo travelers.
- Together, 1 bedroom and 2 bedrooms properties represent 66.6% of the active Airbnb listings in Stirling, indicating a high concentration in these sizes.
- A significant 30.6% of listings offer 3+ bedrooms, catering to larger groups and families seeking more space in Stirling.
Stirling Vacation Rental Guest Capacity Trends (2025)
Distribution of Listings by Guest Capacity
Guest Capacity Insights for Stirling
- The most common guest capacity trend in Stirling vacation rentals is listings accommodating 2 guests (50%). This suggests the primary traveler segment is likely couples or solo travelers.
- Properties designed for 2 guests and 4 guests dominate the Stirling STR market, accounting for 72.2% of listings.
- A significant 50.0% of listings cater specifically to 1-2 guests, highlighting strong demand from couples and solo travelers in Stirling.
- 22.2% of properties accommodate 6+ guests, serving the market segment for larger families or group travel in Stirling.
- On average, properties in Stirling are equipped to host 3.7 guests.
Stirling Airbnb Booking Patterns (2025): Available vs. Booked Days
Available Days Distribution
Booked Days Distribution
Booking Pattern Insights for Stirling
- The most common availability pattern in Stirling falls within the 181-270 days range, representing 36.1% of listings. This suggests many properties have significant open periods on their calendars.
- Approximately 69.4% of listings show high availability (181+ days open annually), indicating potential for increased bookings or specific owner usage patterns.
- For booked days, the 91-180 days range is most frequent in Stirling (38.9%), reflecting common guest stay durations or potential owner blocking patterns.
- A notable 30.5% of properties secure long booking periods (181+ days booked per year), highlighting successful long-term rental strategies or significant owner usage.
Stirling Airbnb Minimum Stay Requirements Analysis
Distribution of Listings by Minimum Night Requirement
1 Night
9 listings
25.7% of total
2 Nights
14 listings
40% of total
30+ Nights
12 listings
34.3% of total
Key Insights
- The most prevalent minimum stay requirement in Stirling is 2 Nights, adopted by 40% of listings. This highlights the market's preference for shorter, flexible bookings.
- A strong majority (65.7%) of the Stirling Airbnb data shows acceptance of very short stays (1-2 nights), indicating a dynamic, high-turnover market.
- A significant segment (34.3%) caters to monthly stays (30+ nights) in Stirling, pointing to opportunities in the extended-stay market.
Recommendations
- Align with the market by considering a 2 Nights minimum stay, as 40% of Stirling hosts use this setting.
- If feasible, allowing 1-night stays, especially midweek or during low season, could capture last-minute bookings, as only 25.7% currently do.
- Explore offering discounts for stays of 30+ nights to attract the 34.3% of the market seeking extended stays.
- Adjust minimum nights based on seasonality – potentially shorter during low season and longer during peak demand periods in Stirling.
Stirling Airbnb Cancellation Policy Trends Analysis (2025)
Super Strict 60 Days
1 listings
3% of total
Super Strict 30 Days
2 listings
6.1% of total
Flexible
3 listings
9.1% of total
Moderate
11 listings
33.3% of total
Firm
12 listings
36.4% of total
Strict
4 listings
12.1% of total
Cancellation Policy Insights for Stirling
- The prevailing Airbnb cancellation policy trend in Stirling is Firm, used by 36.4% of listings.
- There's a relatively balanced mix between guest-friendly (42.4%) and stricter (48.5%) policies, offering choices for different guest needs.
Recommendations for Hosts
- Consider adopting a Firm policy to align with the 36.4% market standard in Stirling.
- Using a Strict policy might deter some guests, as only 12.1% of listings use it. Evaluate if potential revenue protection outweighs possible lower booking rates.
- Regularly review your cancellation policy against competitors and market demand shifts in Stirling.
Stirling STR Booking Lead Time Analysis (2025)
Average Booking Lead Time by Month
Booking Lead Time Insights for Stirling
- The overall average booking lead time for vacation rentals in Stirling is 69 days.
- Guests book furthest in advance for stays during April (average 85 days), likely coinciding with peak travel demand or local events.
- The shortest booking windows occur for stays in August (average 40 days), indicating more last-minute travel plans during this time.
- Seasonally, Spring (81 days avg.) sees the longest lead times, while Summer (60 days avg.) has the shortest, reflecting typical travel planning cycles.
Recommendations for Hosts
- Use the overall average lead time (69 days) as a baseline for your pricing and availability strategy in Stirling.
- For April stays, consider implementing length-of-stay discounts or slightly higher rates for bookings made less than 85 days out to capitalize on advance planning.
- Target marketing efforts for the Spring season well in advance (at least 81 days) to capture early planners.
- Monitor your own booking lead times against these Stirling averages to identify opportunities for dynamic pricing adjustments.
Popular & Essential Airbnb Amenities in Stirling (2025)
Amenity Prevalence
Amenity Insights for Stirling
- Essential amenities in Stirling that guests expect include: Wifi, TV, Hair dryer, Heating. Lacking these (any) could significantly impact bookings.
- Popular amenities like Air conditioning, Free parking on premises, Iron are common but not universal. Offering these can provide a competitive edge.
Recommendations for Hosts
- Ensure your listing includes all essential amenities for Stirling: Wifi, TV, Hair dryer, Heating.
- Prioritize adding missing essentials: Hair dryer, Heating.
- Consider adding popular differentiators like Air conditioning or Free parking on premises to increase appeal.
- Highlight unique or less common amenities you offer (e.g., hot tub, dedicated workspace, EV charger) in your listing description and photos.
- Regularly check competitor amenities in Stirling to stay competitive.
Stirling Airbnb Guest Demographics & Profile Analysis (2025)
Guest Profile Summary for Stirling
- The typical guest profile for Airbnb in Stirling consists of primarily domestic travelers (93%), often arriving from nearby Adelaide, typically belonging to the Post-2000s (Gen Z/Alpha) group (50%), primarily speaking English or Spanish.
- Domestic travelers account for 93.2% of guests.
- Key international markets include Australia (93.2%) and United Kingdom (2%).
- Top languages spoken are English (81.7%) followed by Spanish (3.8%).
- A significant demographic segment is the Post-2000s (Gen Z/Alpha) group, representing 50% of guests.
Recommendations for Hosts
- Target domestic marketing efforts towards travelers from Adelaide and Melbourne.
- Tailor amenities and listing descriptions to appeal to the dominant Post-2000s (Gen Z/Alpha) demographic (e.g., highlight fast WiFi, smart home features, local guides).
- Highlight unique local experiences or amenities relevant to the primary guest profile.
- Consider seasonal promotions aligned with peak travel times for key origin markets.
Nearby Short-Term Rental Market Comparison
How does the Stirling Airbnb market stack up against its neighbors? Compare key performance metrics like average monthly revenue, ADR, and occupancy rates in surrounding areas to understand the broader regional STR landscape.
| Market | Active Properties | Monthly Revenue | Daily Rate | Avg. Occupancy |
|---|---|---|---|---|
| Middle River | 21 | $5,185 | $377.28 | 50% |
| Lyndoch | 21 | $4,127 | $378.23 | 36% |
| Nuriootpa | 19 | $3,539 | $320.16 | 41% |
| Tanunda | 90 | $3,531 | $278.27 | 44% |
| Light Regional Council | 18 | $3,443 | $287.57 | 42% |
| Uraidla | 10 | $3,115 | $210.19 | 45% |
| Angaston | 51 | $3,099 | $294.72 | 41% |
| Emu Bay | 41 | $3,015 | $209.16 | 50% |
| Auburn | 17 | $2,987 | $189.27 | 51% |
| Inman Valley | 12 | $2,894 | $257.68 | 32% |