Moonta Airbnb Market Analysis 2025: Short Term Rental Data & Vacation Rental Statistics in South Australia, Australia
Is Airbnb profitable in Moonta in 2025? Explore comprehensive Airbnb analytics for Moonta, South Australia, Australia to uncover income potential. This 2025 STR market report for Moonta, based on AirROI data from April 2024 to March 2025, reveals key trends in the niche market of 17 active listings.
Whether you're considering an Airbnb investment in Moonta, optimizing your existing vacation rental, or exploring rental arbitrage opportunities, understanding the Moonta Airbnb data is crucial. Leveraging the low regulation environment is key to maximizing your short term rental income potential. Let's dive into the specifics.
Key Moonta Airbnb Performance Metrics Overview
Monthly Airbnb Revenue Variations & Income Potential in Moonta (2025)
Understanding the monthly revenue variations for Airbnb listings in Moonta is key to maximizing your short term rental income potential. Seasonality significantly impacts earnings. Our analysis, based on data from the past 12 months, shows that the peak revenue month for STRs in Moonta is typically June, while September often presents the lowest earnings, highlighting opportunities for strategic pricing adjustments during shoulder and low seasons. Explore the typical Airbnb income in Moonta across different performance tiers:
- Best-in-class properties (Top 10%) achieve $3,659+ monthly, often utilizing dynamic pricing and superior guest experiences.
- Strong performing properties (Top 25%) earn $2,785 or more, indicating effective management and desirable locations/amenities.
- Typical properties (Median) generate around $1,824 per month, representing the average market performance.
- Entry-level properties (Bottom 25%) see earnings around $961, often with potential for optimization.
Average Monthly Airbnb Earnings Trend in Moonta
Moonta Airbnb Occupancy Rate Trends (2025)
Maximize your bookings by understanding the Moonta STR occupancy trends. Seasonal demand shifts significantly influence how often properties are booked. Typically, Januarysees the highest demand (peak season occupancy), while November experiences the lowest (low season). Effective strategies, like adjusting minimum stays or offering promotions, can boost occupancy during slower periods. Here's how different property tiers perform in Moonta:
- Best-in-class properties (Top 10%) achieve 68%+ occupancy, indicating high desirability and potentially optimized availability.
- Strong performing properties (Top 25%) maintain 53% or higher occupancy, suggesting good market fit and guest satisfaction.
- Typical properties (Median) have an occupancy rate around 38%.
- Entry-level properties (Bottom 25%) average 20% occupancy, potentially facing higher vacancy.
Average Monthly Occupancy Rate Trend in Moonta
Average Daily Rate (ADR) Airbnb Trends in Moonta (2025)
Effective short term rental pricing strategy in Moonta involves understanding monthly ADR fluctuations. The Average Daily Rate (ADR) for Airbnb in Moonta typically peaks in January and dips lowest during September. Leveraging Airbnb dynamic pricing tools or strategies based on this seasonality can significantly boost revenue. Here's a look at the typical nightly rates achieved:
- Best-in-class properties (Top 10%) command rates of $204+ per night, often due to premium features or locations.
- Strong performing properties (Top 25%) achieve nightly rates of $177 or more.
- Typical properties (Median) charge around $143 per night.
- Entry-level properties (Bottom 25%) earn around $128 per night.
Average Daily Rate (ADR) Trend by Month in Moonta
Get Live Moonta Market Intelligence 👇

Explore Real-time Analytics
Airbnb Seasonality Analysis & Trends in Moonta (2025)
Peak Season (June, January, April)
- Revenue averages $2,845 per month
- Occupancy rates average 48.9%
- Daily rates average $160
Shoulder Season
- Revenue averages $1,958 per month
- Occupancy maintains around 38.9%
- Daily rates hold near $157
Low Season (August, September, November)
- Revenue drops to average $1,302 per month
- Occupancy decreases to average 29.0%
- Daily rates adjust to average $154
Seasonality Insights for Moonta
- The Airbnb seasonality in Moonta shows highly seasonal trends requiring careful strategy. While the sections above show seasonal averages, it's also insightful to look at the extremes:
- During the high season, the absolute peak month showcases Moonta's highest earning potential, with monthly revenues capable of climbing to $2,926, occupancy reaching a high of 52.8%, and ADRs peaking at $174.
- Conversely, the slowest single month of the year, typically falling within the low season, marks the market's lowest point. In this month, revenue might dip to $1,293, occupancy could drop to 26.9%, and ADRs may adjust down to $149.
- Understanding both the seasonal averages and these monthly peaks and troughs in revenue, occupancy, and ADR is crucial for maximizing your Airbnb profit potential in Moonta.
Seasonal Strategies for Maximizing Profit
- Peak Season: Maximize revenue through premium pricing and potentially longer minimum stays. Ensure high availability.
- Low Season: Offer competitive pricing, special promotions (e.g., extended stay discounts), and flexible cancellation policies. Target off-season travelers like remote workers or budget-conscious guests.
- Shoulder Seasons: Implement dynamic pricing that balances peak and low rates. Target weekend travelers or specific events. Offer slightly more flexible terms than peak season.
- Regularly analyze your own performance against these Moonta seasonality benchmarks and adjust your pricing and availability strategy accordingly.
Best Areas for Airbnb Investment in Moonta (2025)
Exploring the top neighborhoods for short-term rentals in Moonta? This section highlights key areas, outlining why they are attractive for hosts and guests, along with notable local attractions. Consider these locations based on your target guest profile and investment strategy.
| Neighborhood / Area | Why Host Here? (Target Guests & Appeal) | Key Attractions & Landmarks |
|---|---|---|
| Moonta Bay | Beautiful coastal area known for its stunning beaches, perfect for families and holidaymakers. The calm waters and scenic views attract visitors looking for a relaxing getaway. | Moonta Bay Beach, Nearby jetty for fishing, The Moonta Bay Caravan Park, Local cafes and restaurants, Walking trails along the coast |
| Moonta Township | Historic mining town with rich heritage, offering a glimpse into South Australia's colonial past. Great for guests interested in history and local culture. | Moonta Mines Museum, Heritage walk trails, Local shops and boutiques, Art galleries, Historic buildings and attractions |
| Port Hughes | Charming seaside town known for its beautiful beach and close-knit community. Ideal for those looking for a peaceful retreat while being close to attractions. | Port Hughes Beach, Fishing spots, The Jetty, Local playground, Walking trails |
| Corny Point | Scenic coastal location known for its cliffs and spectacular ocean views. Popular for vacationers seeking outdoor activities like fishing and surfing. | Corny Point Lighthouse, Fishing spots, Stunning coastal walks, Surf beaches, Natural scenery |
| Bendleby Ranges | Offers a unique rural and bush experience, perfect for those who enjoy nature and outdoor activities. Provides opportunities for hiking, horseback riding, and stargazing. | National parks nearby, Scenic landscapes, Wildlife viewing, Hiking trails, Rural accommodation options |
| Dudley Peninsula | A tranquil region with lovely beaches and walking trails, great for nature lovers and those looking to escape the city. | Stunning coastal scenery, Walking and cycling paths, Scenic lookouts, Wildlife spots, Local fishing opportunities |
| Kadina | Nearby town with shopping and amenities, appealing to visitors looking for convenience while still enjoying the coastal charm of Moonta. | Local shops, Parks and gardens, Historical sites, Events and festivals, Community activities |
| Wallaroo | Another coastal town close to Moonta, known for its beach and community vibe. Great for families and tourists exploring the Copper Coast. | Wallaroo Beach, Local seafood dining, Fishing and boating, Community events, Historic buildings |
Understanding Airbnb License Requirements & STR Laws in Moonta (2025)
While Moonta, South Australia, Australia currently shows low STR regulations, specific Airbnb license requirements might still exist or change. Always verify the latest short term rental regulations and Airbnb license requirements directly with local government authorities for Moonta to ensure full compliance before hosting.
(Source: AirROI data, 2025, finding no licensed listings among those analyzed)
Top Performing Airbnb Properties in Moonta (2025)
Benchmark your potential! Explore examples of top-performing Airbnb properties in Moontabased on Trailing Twelve Month (TTM) revenue. Analyze their characteristics, revenue, occupancy rate, and ADR to understand what drives success in this market.

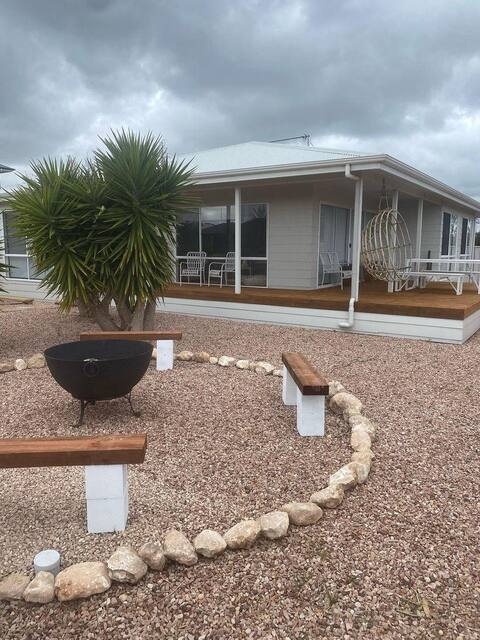
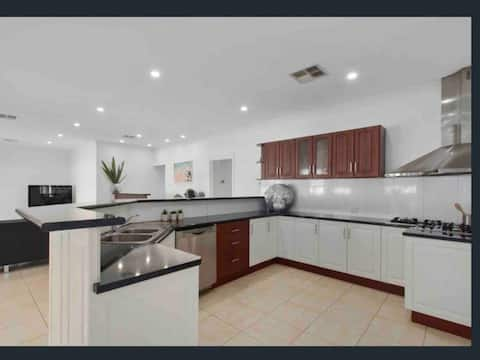
Old Union Bank restored in the heart of Moonta
Entire Place • 3 bedrooms
Ela meine 'Come stay'
Entire Place • 3 bedrooms

i am george
Entire Place • 2 bedrooms

Charming 100 yr old cottage in the heart of Moonta
Entire Place • 3 bedrooms
Parr-adise by the beach
Entire Place • 4 bedrooms

Coastal Break - Peaceful 3 BR Home Near the Beach
Entire Place • 3 bedrooms
Note: Performance varies based on location, size, amenities, seasonality, and management quality. Data reflects the past 12 months.
Top Performing Airbnb Hosts in Moonta (2025)
Learn from the best! This table showcases top-performing Airbnb hosts in Moonta based on the number of properties managed and estimated total revenue over the past year. Analyze their scale and performance metrics.
| Host Name | Properties | Grossing Revenue | Stay Reviews | Avg Rating |
|---|---|---|---|---|
| Kara | 1 | $41,498 | 3 | 5.00/5.0 |
| Melissa | 1 | $32,676 | 23 | 4.65/5.0 |
| Country Getaways Holiday Renta | 5 | $29,605 | 22 | 2.50/5.0 |
| Sarah | 1 | $28,731 | 10 | 5.00/5.0 |
| Melanie | 1 | $28,141 | 83 | 4.93/5.0 |
| Melissa And Bernie | 1 | $27,228 | 28 | 4.96/5.0 |
| David | 1 | $25,387 | 5 | 4.80/5.0 |
| Amanda | 1 | $23,909 | 128 | 4.84/5.0 |
| Debbie | 1 | $17,667 | 100 | 4.66/5.0 |
| Anna | 1 | $16,568 | 6 | 5.00/5.0 |
Analyzing the strategies of top hosts, such as their property selection, pricing, and guest communication, can offer valuable lessons for optimizing your own Airbnb operations in Moonta.
Dive Deeper: Advanced Moonta STR Market Data (2025)
Ready to unlock more insights? AirROI provides access to advanced metrics and comprehensive Airbnb data for Moonta. Explore detailed analytics beyond this report to refine your investment strategy, optimize pricing, and maximize your vacation rental profits.
Explore Advanced MetricsMoonta Short-Term Rental Market Composition (2025): Property & Room Types
Room Type Distribution
Property Type Distribution
Market Composition Insights for Moonta
- The Moonta Airbnb market composition is heavily skewed towards Entire Home/Apt listings, which make up 100% of the 17 active rentals. This indicates strong guest preference for privacy and space.
- Looking at the property type distribution in Moonta, House properties are the most common (88.2%), reflecting the local real estate landscape.
- Houses represent a significant 88.2% portion, catering likely to families or larger groups.
- The presence of 5.9% Hotel/Boutique listings indicates integration with traditional hospitality.
Moonta Airbnb Room Capacity Analysis (2025): Bedroom Distribution
Distribution of Listings by Number of Bedrooms
Room Capacity Insights for Moonta
- The dominant room capacity in Moonta is 3 bedrooms listings, making up 70.6% of the market. This suggests a strong demand for properties suitable for families or small groups.
- Together, 3 bedrooms and 2 bedrooms properties represent 88.2% of the active Airbnb listings in Moonta, indicating a high concentration in these sizes.
- A significant 82.4% of listings offer 3+ bedrooms, catering to larger groups and families seeking more space in Moonta.
Moonta Vacation Rental Guest Capacity Trends (2025)
Distribution of Listings by Guest Capacity
Guest Capacity Insights for Moonta
- The most common guest capacity trend in Moonta vacation rentals is listings accommodating 6 guests (41.2%). This suggests the primary traveler segment is likely larger groups.
- Properties designed for 6 guests and 8+ guests dominate the Moonta STR market, accounting for 70.6% of listings.
- 88.2% of properties accommodate 6+ guests, serving the market segment for larger families or group travel in Moonta.
- On average, properties in Moonta are equipped to host 6.6 guests.
Moonta Airbnb Booking Patterns (2025): Available vs. Booked Days
Available Days Distribution
Booked Days Distribution
Booking Pattern Insights for Moonta
- The most common availability pattern in Moonta falls within the 271-366 days range, representing 41.2% of listings. This suggests many properties have significant open periods on their calendars.
- Approximately 82.4% of listings show high availability (181+ days open annually), indicating potential for increased bookings or specific owner usage patterns.
- For booked days, the 91-180 days range is most frequent in Moonta (41.2%), reflecting common guest stay durations or potential owner blocking patterns.
- A notable 17.6% of properties secure long booking periods (181+ days booked per year), highlighting successful long-term rental strategies or significant owner usage.
Moonta Airbnb Minimum Stay Requirements Analysis
Distribution of Listings by Minimum Night Requirement
2 Nights
6 listings
35.3% of total
3 Nights
1 listings
5.9% of total
30+ Nights
10 listings
58.8% of total
Key Insights
- The most prevalent minimum stay requirement in Moonta is 30+ Nights, adopted by 58.8% of listings. This highlights the market's preference for longer commitments.
- A significant segment (58.8%) caters to monthly stays (30+ nights) in Moonta, pointing to opportunities in the extended-stay market.
Recommendations
- Align with the market by considering a 30+ Nights minimum stay, as 58.8% of Moonta hosts use this setting.
- A 2-night minimum appears standard (35.3%). Consider this for weekends or peak periods.
- Explore offering discounts for stays of 30+ nights to attract the 58.8% of the market seeking extended stays.
- Adjust minimum nights based on seasonality – potentially shorter during low season and longer during peak demand periods in Moonta.
Moonta Airbnb Cancellation Policy Trends Analysis (2025)
Super Strict 30 Days
1 listings
6.7% of total
Flexible
2 listings
13.3% of total
Moderate
3 listings
20% of total
Firm
4 listings
26.7% of total
Strict
5 listings
33.3% of total
Cancellation Policy Insights for Moonta
- The prevailing Airbnb cancellation policy trend in Moonta is Strict, used by 33.3% of listings.
- A majority (60.0%) of hosts in Moonta utilize Firm or Strict policies, indicating a market where hosts prioritize booking security.
Recommendations for Hosts
- Consider adopting a Strict policy to align with the 33.3% market standard in Moonta.
- With 33.3% using Strict terms, this is a viable option in Moonta, particularly for high-value properties or during peak demand periods.
- Regularly review your cancellation policy against competitors and market demand shifts in Moonta.
Moonta STR Booking Lead Time Analysis (2025)
Average Booking Lead Time by Month
Booking Lead Time Insights for Moonta
- The overall average booking lead time for vacation rentals in Moonta is 56 days.
- Guests book furthest in advance for stays during December (average 85 days), likely coinciding with peak travel demand or local events.
- The shortest booking windows occur for stays in August (average 13 days), indicating more last-minute travel plans during this time.
- Seasonally, Winter (74 days avg.) sees the longest lead times, while Summer (41 days avg.) has the shortest, reflecting typical travel planning cycles.
Recommendations for Hosts
- Use the overall average lead time (56 days) as a baseline for your pricing and availability strategy in Moonta.
- For December stays, consider implementing length-of-stay discounts or slightly higher rates for bookings made less than 85 days out to capitalize on advance planning.
- During August, focus on last-minute booking availability and promotions, as guests book with very short notice (13 days avg.).
- Target marketing efforts for the Winter season well in advance (at least 74 days) to capture early planners.
- Monitor your own booking lead times against these Moonta averages to identify opportunities for dynamic pricing adjustments.
Popular & Essential Airbnb Amenities in Moonta (2025)
Amenity Prevalence
Amenity Insights for Moonta
- Essential amenities in Moonta that guests expect include: Smoke alarm, TV, Air conditioning. Lacking these (any) could significantly impact bookings.
- Popular amenities like Washer, Hot water, Kitchen are common but not universal. Offering these can provide a competitive edge.
Recommendations for Hosts
- Ensure your listing includes all essential amenities for Moonta: Smoke alarm, TV, Air conditioning.
- Consider adding popular differentiators like Washer or Hot water to increase appeal.
- Highlight unique or less common amenities you offer (e.g., hot tub, dedicated workspace, EV charger) in your listing description and photos.
- Regularly check competitor amenities in Moonta to stay competitive.
Moonta Airbnb Guest Demographics & Profile Analysis (2025)
Guest Profile Summary for Moonta
- The typical guest profile for Airbnb in Moonta consists of primarily domestic travelers (97%), often arriving from nearby Adelaide, typically belonging to the Post-2000s (Gen Z/Alpha) group (50%), primarily speaking English or Chinese.
- Domestic travelers account for 96.8% of guests.
- Key international markets include Australia (96.8%) and New Zealand (1.1%).
- Top languages spoken are English (73.3%) followed by Chinese (6.7%).
- A significant demographic segment is the Post-2000s (Gen Z/Alpha) group, representing 50% of guests.
Recommendations for Hosts
- Target domestic marketing efforts towards travelers from Adelaide and South Australia.
- Tailor amenities and listing descriptions to appeal to the dominant Post-2000s (Gen Z/Alpha) demographic (e.g., highlight fast WiFi, smart home features, local guides).
- Highlight unique local experiences or amenities relevant to the primary guest profile.
- Consider seasonal promotions aligned with peak travel times for key origin markets.
Nearby Short-Term Rental Market Comparison
How does the Moonta Airbnb market stack up against its neighbors? Compare key performance metrics like average monthly revenue, ADR, and occupancy rates in surrounding areas to understand the broader regional STR landscape.
| Market | Active Properties | Monthly Revenue | Daily Rate | Avg. Occupancy |
|---|---|---|---|---|
| Middle River | 21 | $5,185 | $377.28 | 50% |
| Lyndoch | 21 | $4,127 | $378.23 | 36% |
| Nuriootpa | 19 | $3,539 | $320.16 | 41% |
| Tanunda | 90 | $3,531 | $278.27 | 44% |
| Light Regional Council | 18 | $3,443 | $287.57 | 42% |
| Sevenhill | 10 | $3,391 | $186.68 | 56% |
| Stirling | 36 | $3,306 | $311.89 | 42% |
| Clare and Gilbert Valleys Council | 32 | $3,185 | $242.64 | 43% |
| Uraidla | 10 | $3,115 | $210.19 | 45% |
| Emu Bay | 41 | $3,015 | $209.16 | 50% |