Hayborough Airbnb Market Analysis 2025: Short Term Rental Data & Vacation Rental Statistics in South Australia, Australia
Is Airbnb profitable in Hayborough in 2025? Explore comprehensive Airbnb analytics for Hayborough, South Australia, Australia to uncover income potential. This 2025 STR market report for Hayborough, based on AirROI data from April 2024 to March 2025, reveals key trends in the niche market of 49 active listings.
Whether you're considering an Airbnb investment in Hayborough, optimizing your existing vacation rental, or exploring rental arbitrage opportunities, understanding the Hayborough Airbnb data is crucial. Leveraging the low regulation environment is key to maximizing your short term rental income potential. Let's dive into the specifics.
Key Hayborough Airbnb Performance Metrics Overview
Monthly Airbnb Revenue Variations & Income Potential in Hayborough (2025)
Understanding the monthly revenue variations for Airbnb listings in Hayborough is key to maximizing your short term rental income potential. Seasonality significantly impacts earnings. Our analysis, based on data from the past 12 months, shows that the peak revenue month for STRs in Hayborough is typically January, while July often presents the lowest earnings, highlighting opportunities for strategic pricing adjustments during shoulder and low seasons. Explore the typical Airbnb income in Hayborough across different performance tiers:
- Best-in-class properties (Top 10%) achieve $6,316+ monthly, often utilizing dynamic pricing and superior guest experiences.
- Strong performing properties (Top 25%) earn $4,003 or more, indicating effective management and desirable locations/amenities.
- Typical properties (Median) generate around $2,516 per month, representing the average market performance.
- Entry-level properties (Bottom 25%) see earnings around $1,349, often with potential for optimization.
Average Monthly Airbnb Earnings Trend in Hayborough
Hayborough Airbnb Occupancy Rate Trends (2025)
Maximize your bookings by understanding the Hayborough STR occupancy trends. Seasonal demand shifts significantly influence how often properties are booked. Typically, Januarysees the highest demand (peak season occupancy), while July experiences the lowest (low season). Effective strategies, like adjusting minimum stays or offering promotions, can boost occupancy during slower periods. Here's how different property tiers perform in Hayborough:
- Best-in-class properties (Top 10%) achieve 74%+ occupancy, indicating high desirability and potentially optimized availability.
- Strong performing properties (Top 25%) maintain 54% or higher occupancy, suggesting good market fit and guest satisfaction.
- Typical properties (Median) have an occupancy rate around 35%.
- Entry-level properties (Bottom 25%) average 20% occupancy, potentially facing higher vacancy.
Average Monthly Occupancy Rate Trend in Hayborough
Average Daily Rate (ADR) Airbnb Trends in Hayborough (2025)
Effective short term rental pricing strategy in Hayborough involves understanding monthly ADR fluctuations. The Average Daily Rate (ADR) for Airbnb in Hayborough typically peaks in January and dips lowest during March. Leveraging Airbnb dynamic pricing tools or strategies based on this seasonality can significantly boost revenue. Here's a look at the typical nightly rates achieved:
- Best-in-class properties (Top 10%) command rates of $386+ per night, often due to premium features or locations.
- Strong performing properties (Top 25%) achieve nightly rates of $303 or more.
- Typical properties (Median) charge around $221 per night.
- Entry-level properties (Bottom 25%) earn around $171 per night.
Average Daily Rate (ADR) Trend by Month in Hayborough
Get Live Hayborough Market Intelligence 👇

Explore Real-time Analytics
Airbnb Seasonality Analysis & Trends in Hayborough (2025)
Peak Season (January, December, April)
- Revenue averages $4,569 per month
- Occupancy rates average 50.0%
- Daily rates average $268
Shoulder Season
- Revenue averages $2,840 per month
- Occupancy maintains around 36.7%
- Daily rates hold near $242
Low Season (July, August, September)
- Revenue drops to average $2,206 per month
- Occupancy decreases to average 31.7%
- Daily rates adjust to average $248
Seasonality Insights for Hayborough
- The Airbnb seasonality in Hayborough shows highly seasonal trends requiring careful strategy. While the sections above show seasonal averages, it's also insightful to look at the extremes:
- During the high season, the absolute peak month showcases Hayborough's highest earning potential, with monthly revenues capable of climbing to $5,592, occupancy reaching a high of 61.3%, and ADRs peaking at $283.
- Conversely, the slowest single month of the year, typically falling within the low season, marks the market's lowest point. In this month, revenue might dip to $2,147, occupancy could drop to 30.9%, and ADRs may adjust down to $227.
- Understanding both the seasonal averages and these monthly peaks and troughs in revenue, occupancy, and ADR is crucial for maximizing your Airbnb profit potential in Hayborough.
Seasonal Strategies for Maximizing Profit
- Peak Season: Maximize revenue through premium pricing and potentially longer minimum stays. Ensure high availability.
- Low Season: Offer competitive pricing, special promotions (e.g., extended stay discounts), and flexible cancellation policies. Target off-season travelers like remote workers or budget-conscious guests.
- Shoulder Seasons: Implement dynamic pricing that balances peak and low rates. Target weekend travelers or specific events. Offer slightly more flexible terms than peak season.
- Regularly analyze your own performance against these Hayborough seasonality benchmarks and adjust your pricing and availability strategy accordingly.
Best Areas for Airbnb Investment in Hayborough (2025)
Exploring the top neighborhoods for short-term rentals in Hayborough? This section highlights key areas, outlining why they are attractive for hosts and guests, along with notable local attractions. Consider these locations based on your target guest profile and investment strategy.
| Neighborhood / Area | Why Host Here? (Target Guests & Appeal) | Key Attractions & Landmarks |
|---|---|---|
| Hayborough Beach | A beautiful stretch of coastline with soft sandy beaches, perfect for families and beachgoers. Offers direct access to various water sports and leisure activities, making it an attractive spot for both tourists and locals. | Hayborough Beach, Goolwa Beach, Port Elliot, Victor Harbor, Urimbirra Wildlife Park, Goolwa River |
| Victor Harbor | A popular holiday destination known for its scenic coastal views, vibrant town atmosphere, and opportunities for whale watching. Ideal for visitors interested in local attractions and recreational activities. | Granite Island, Victor Harbor Horse Drawn Tram, Nantawarrina, Whale Watching Cruises, Victor Harbor Heritage Trail |
| Port Elliot | A charming coastal town with historical significance and picturesque landscapes. Known for its laid-back vibe and great amenities, appealing to families and couples looking for a retreat. | Port Elliot Beach, Bashams Beach, Encounter Coast Discovery Centre, Port Elliot Railway Station, Goolwa Beach |
| Goolwa | A historic town that sits at the mouth of the Murray River, Goolwa offers a unique mix of river and sea activities. Great for eco-tourism and visitors looking to explore diverse landscapes. | Goolwa River, Goolwa Barrages, South Lakes Golf Club, Goolwa Wharf, Goolwa Markets |
| Inman Valley | Nestled in the Adelaide Hills, Inman Valley provides a peaceful retreat surrounded by nature. It's ideal for guests seeking tranquility, hiking trails, and wildlife encounters. | Inman Valley Conservation Park, Coastal views, Local wineries, Walking trails, Wildlife parks |
| Middleton | Known for its surf beaches and relaxed atmosphere, Middleton is popular among surfers and water sports enthusiasts. The charming local eateries and cafes add to its appeal. | Middleton Beach, Surfing spots, Local cafes, Dolphin spotting, Coastal walks |
| Mount Compass | Located inland, Mount Compass is known for its rolling hills and agricultural lands. It's a great place for those who enjoy rural experiences and organic produce. | Mount Compass Golf Course, Wine tours, Rural farm experiences, Local markets, National Parks |
| Sellicks Beach | This quiet beachside community offers a serene environment and stunning views of the ocean. Perfect for travelers looking for a peaceful getaway and natural attractions. | Sellicks Beach, Nearby wineries, Cliff-top views, Walking trails, Local shops |
Understanding Airbnb License Requirements & STR Laws in Hayborough (2025)
While Hayborough, South Australia, Australia currently shows low STR regulations, specific Airbnb license requirements might still exist or change. Always verify the latest short term rental regulations and Airbnb license requirements directly with local government authorities for Hayborough to ensure full compliance before hosting.
(Source: AirROI data, 2025, finding no licensed listings among those analyzed)
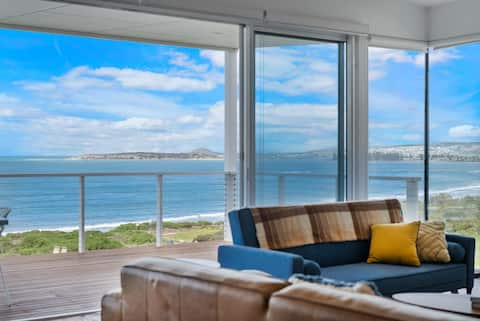
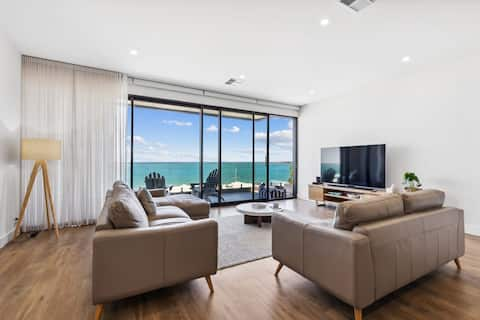
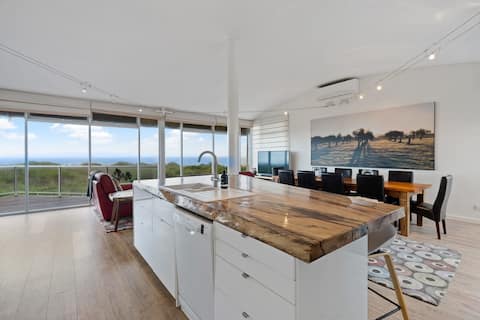
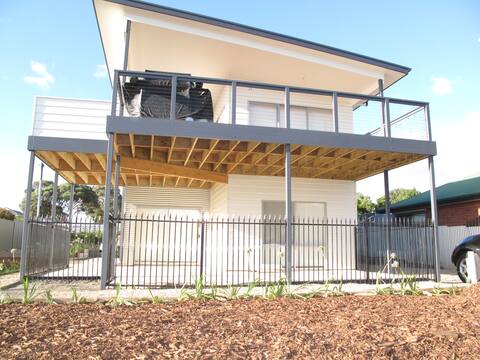
Top Performing Airbnb Properties in Hayborough (2025)
Benchmark your potential! Explore examples of top-performing Airbnb properties in Hayboroughbased on Trailing Twelve Month (TTM) revenue. Analyze their characteristics, revenue, occupancy rate, and ADR to understand what drives success in this market.
Premier sea-view location at Girt
Entire Place • 4 bedrooms

Hamptons at Hayborough 🏡
Entire Place • 5 bedrooms
Seamist On Seagull, Expansive Views
Entire Place • 4 bedrooms
Chiton Breeze - Seagull Ave Hayborough
Entire Place • 4 bedrooms

Chiton Breeze Stylish Family Beach House, Kid Zone
Entire Place • 3 bedrooms
The property is called "The Hayborough House"
Entire Place • 4 bedrooms
Note: Performance varies based on location, size, amenities, seasonality, and management quality. Data reflects the past 12 months.
Top Performing Airbnb Hosts in Hayborough (2025)
Learn from the best! This table showcases top-performing Airbnb hosts in Hayborough based on the number of properties managed and estimated total revenue over the past year. Analyze their scale and performance metrics.
| Host Name | Properties | Grossing Revenue | Stay Reviews | Avg Rating |
|---|---|---|---|---|
| Harris Holiday Rentals | 6 | $194,708 | 19 | 1.55/5.0 |
| South Coast | 4 | $181,353 | 12 | 1.16/5.0 |
| Barry And Kim | 3 | $122,859 | 45 | 4.86/5.0 |
| Melissa | 4 | $118,899 | 58 | 3.63/5.0 |
| Sharon | 1 | $84,469 | 67 | 4.91/5.0 |
| David And Ruth | 2 | $70,862 | 71 | 4.92/5.0 |
| Escape Holiday Rentals | 4 | $63,081 | 8 | 1.20/5.0 |
| Kellie | 1 | $50,997 | 67 | 4.91/5.0 |
| Nick | 1 | $45,697 | 35 | 4.49/5.0 |
| Jessica | 1 | $36,094 | 8 | 5.00/5.0 |
Analyzing the strategies of top hosts, such as their property selection, pricing, and guest communication, can offer valuable lessons for optimizing your own Airbnb operations in Hayborough.
Dive Deeper: Advanced Hayborough STR Market Data (2025)
Ready to unlock more insights? AirROI provides access to advanced metrics and comprehensive Airbnb data for Hayborough. Explore detailed analytics beyond this report to refine your investment strategy, optimize pricing, and maximize your vacation rental profits.
Explore Advanced MetricsHayborough Short-Term Rental Market Composition (2025): Property & Room Types
Room Type Distribution
Property Type Distribution
Market Composition Insights for Hayborough
- The Hayborough Airbnb market composition is heavily skewed towards Entire Home/Apt listings, which make up 100% of the 49 active rentals. This indicates strong guest preference for privacy and space.
- Looking at the property type distribution in Hayborough, House properties are the most common (89.8%), reflecting the local real estate landscape.
- Houses represent a significant 89.8% portion, catering likely to families or larger groups.
- Smaller segments like hotel/boutique, apartment/condo, outdoor/unique (combined 10.2%) offer potential for unique stay experiences.
Hayborough Airbnb Room Capacity Analysis (2025): Bedroom Distribution
Distribution of Listings by Number of Bedrooms
Room Capacity Insights for Hayborough
- The dominant room capacity in Hayborough is 4 bedrooms listings, making up 40.8% of the market. This suggests a strong demand for properties suitable for families or small groups.
- Together, 4 bedrooms and 3 bedrooms properties represent 79.6% of the active Airbnb listings in Hayborough, indicating a high concentration in these sizes.
- A significant 87.8% of listings offer 3+ bedrooms, catering to larger groups and families seeking more space in Hayborough.
Hayborough Vacation Rental Guest Capacity Trends (2025)
Distribution of Listings by Guest Capacity
Guest Capacity Insights for Hayborough
- The most common guest capacity trend in Hayborough vacation rentals is listings accommodating 8+ guests (57.1%). This suggests the primary traveler segment is likely larger groups.
- Properties designed for 8+ guests and 6 guests dominate the Hayborough STR market, accounting for 81.6% of listings.
- 87.7% of properties accommodate 6+ guests, serving the market segment for larger families or group travel in Hayborough.
- On average, properties in Hayborough are equipped to host 7.0 guests.
Hayborough Airbnb Booking Patterns (2025): Available vs. Booked Days
Available Days Distribution
Booked Days Distribution
Booking Pattern Insights for Hayborough
- The most common availability pattern in Hayborough falls within the 181-270 days range, representing 42.9% of listings. This suggests many properties have significant open periods on their calendars.
- Approximately 85.8% of listings show high availability (181+ days open annually), indicating potential for increased bookings or specific owner usage patterns.
- For booked days, the 91-180 days range is most frequent in Hayborough (44.9%), reflecting common guest stay durations or potential owner blocking patterns.
- A notable 16.3% of properties secure long booking periods (181+ days booked per year), highlighting successful long-term rental strategies or significant owner usage.
Hayborough Airbnb Minimum Stay Requirements Analysis
Distribution of Listings by Minimum Night Requirement
1 Night
2 listings
4.1% of total
2 Nights
15 listings
30.6% of total
3 Nights
3 listings
6.1% of total
4-6 Nights
3 listings
6.1% of total
30+ Nights
26 listings
53.1% of total
Key Insights
- The most prevalent minimum stay requirement in Hayborough is 30+ Nights, adopted by 53.1% of listings. This highlights the market's preference for longer commitments.
- A significant segment (53.1%) caters to monthly stays (30+ nights) in Hayborough, pointing to opportunities in the extended-stay market.
Recommendations
- Align with the market by considering a 30+ Nights minimum stay, as 53.1% of Hayborough hosts use this setting.
- If feasible, allowing 1-night stays, especially midweek or during low season, could capture last-minute bookings, as only 4.1% currently do.
- A 2-night minimum appears standard (30.6%). Consider this for weekends or peak periods.
- Explore offering discounts for stays of 30+ nights to attract the 53.1% of the market seeking extended stays.
- Adjust minimum nights based on seasonality – potentially shorter during low season and longer during peak demand periods in Hayborough.
Hayborough Airbnb Cancellation Policy Trends Analysis (2025)
Super Strict 60 Days
1 listings
2.6% of total
Super Strict 30 Days
2 listings
5.3% of total
Flexible
7 listings
18.4% of total
Moderate
8 listings
21.1% of total
Firm
9 listings
23.7% of total
Strict
11 listings
28.9% of total
Cancellation Policy Insights for Hayborough
- The prevailing Airbnb cancellation policy trend in Hayborough is Strict, used by 28.9% of listings.
- A majority (52.6%) of hosts in Hayborough utilize Firm or Strict policies, indicating a market where hosts prioritize booking security.
Recommendations for Hosts
- Consider adopting a Strict policy to align with the 28.9% market standard in Hayborough.
- Regularly review your cancellation policy against competitors and market demand shifts in Hayborough.
Hayborough STR Booking Lead Time Analysis (2025)
Average Booking Lead Time by Month
Booking Lead Time Insights for Hayborough
- The overall average booking lead time for vacation rentals in Hayborough is 58 days.
- Guests book furthest in advance for stays during December (average 98 days), likely coinciding with peak travel demand or local events.
- The shortest booking windows occur for stays in February (average 26 days), indicating more last-minute travel plans during this time.
- Seasonally, Winter (70 days avg.) sees the longest lead times, while Spring (36 days avg.) has the shortest, reflecting typical travel planning cycles.
Recommendations for Hosts
- Use the overall average lead time (58 days) as a baseline for your pricing and availability strategy in Hayborough.
- For December stays, consider implementing length-of-stay discounts or slightly higher rates for bookings made less than 98 days out to capitalize on advance planning.
- Target marketing efforts for the Winter season well in advance (at least 70 days) to capture early planners.
- Monitor your own booking lead times against these Hayborough averages to identify opportunities for dynamic pricing adjustments.
Popular & Essential Airbnb Amenities in Hayborough (2025)
Amenity Prevalence
Amenity Insights for Hayborough
- Essential amenities in Hayborough that guests expect include: Kitchen, Air conditioning, Smoke alarm, TV, Refrigerator, Microwave, Heating, Washer. Lacking these (any) could significantly impact bookings.
- Popular amenities like Free parking on premises, Wifi are common but not universal. Offering these can provide a competitive edge.
- Warning: Wifi is not universally provided but is considered essential globally. Ensure reliable Wifi is offered.
Recommendations for Hosts
- Ensure your listing includes all essential amenities for Hayborough: Kitchen, Air conditioning, Smoke alarm, TV, Refrigerator, Microwave, Heating, Washer.
- Prioritize adding missing essentials: Refrigerator, Microwave, Heating, Washer.
- Consider adding popular differentiators like Free parking on premises or Wifi to increase appeal.
- Highlight unique or less common amenities you offer (e.g., hot tub, dedicated workspace, EV charger) in your listing description and photos.
- Regularly check competitor amenities in Hayborough to stay competitive.
Hayborough Airbnb Guest Demographics & Profile Analysis (2025)
Guest Profile Summary for Hayborough
- The typical guest profile for Airbnb in Hayborough consists of primarily domestic travelers (97%), often arriving from nearby Adelaide, typically belonging to the Post-2000s (Gen Z/Alpha) group (50%), primarily speaking English or Turkish.
- Domestic travelers account for 97.0% of guests.
- Key international markets include Australia (97%) and United Kingdom (0.7%).
- Top languages spoken are English (68.9%) followed by Turkish (6.6%).
- A significant demographic segment is the Post-2000s (Gen Z/Alpha) group, representing 50% of guests.
Recommendations for Hosts
- Target domestic marketing efforts towards travelers from Adelaide and South Australia.
- Tailor amenities and listing descriptions to appeal to the dominant Post-2000s (Gen Z/Alpha) demographic (e.g., highlight fast WiFi, smart home features, local guides).
- Highlight unique local experiences or amenities relevant to the primary guest profile.
- Consider seasonal promotions aligned with peak travel times for key origin markets.
Nearby Short-Term Rental Market Comparison
How does the Hayborough Airbnb market stack up against its neighbors? Compare key performance metrics like average monthly revenue, ADR, and occupancy rates in surrounding areas to understand the broader regional STR landscape.
| Market | Active Properties | Monthly Revenue | Daily Rate | Avg. Occupancy |
|---|---|---|---|---|
| Middle River | 21 | $5,185 | $377.28 | 50% |
| Lyndoch | 21 | $4,127 | $378.23 | 36% |
| Nuriootpa | 19 | $3,539 | $320.16 | 41% |
| Tanunda | 90 | $3,531 | $278.27 | 44% |
| Light Regional Council | 18 | $3,443 | $287.57 | 42% |
| Stirling | 36 | $3,306 | $311.89 | 42% |
| Uraidla | 10 | $3,115 | $210.19 | 45% |
| Angaston | 51 | $3,099 | $294.72 | 41% |
| Emu Bay | 41 | $3,015 | $209.16 | 50% |
| Auburn | 17 | $2,987 | $189.27 | 51% |