Angaston Airbnb Market Analysis 2025: Short Term Rental Data & Vacation Rental Statistics in South Australia, Australia
Is Airbnb profitable in Angaston in 2025? Explore comprehensive Airbnb analytics for Angaston, South Australia, Australia to uncover income potential. This 2025 STR market report for Angaston, based on AirROI data from April 2024 to March 2025, reveals key trends in the niche market of 51 active listings.
Whether you're considering an Airbnb investment in Angaston, optimizing your existing vacation rental, or exploring rental arbitrage opportunities, understanding the Angaston Airbnb data is crucial. Leveraging the low regulation environment is key to maximizing your short term rental income potential. Let's dive into the specifics.
Key Angaston Airbnb Performance Metrics Overview
Monthly Airbnb Revenue Variations & Income Potential in Angaston (2025)
Understanding the monthly revenue variations for Airbnb listings in Angaston is key to maximizing your short term rental income potential. Seasonality significantly impacts earnings. Our analysis, based on data from the past 12 months, shows that the peak revenue month for STRs in Angaston is typically May, while February often presents the lowest earnings, highlighting opportunities for strategic pricing adjustments during shoulder and low seasons. Explore the typical Airbnb income in Angaston across different performance tiers:
- Best-in-class properties (Top 10%) achieve $7,878+ monthly, often utilizing dynamic pricing and superior guest experiences.
- Strong performing properties (Top 25%) earn $4,541 or more, indicating effective management and desirable locations/amenities.
- Typical properties (Median) generate around $2,936 per month, representing the average market performance.
- Entry-level properties (Bottom 25%) see earnings around $1,696, often with potential for optimization.
Average Monthly Airbnb Earnings Trend in Angaston
Angaston Airbnb Occupancy Rate Trends (2025)
Maximize your bookings by understanding the Angaston STR occupancy trends. Seasonal demand shifts significantly influence how often properties are booked. Typically, Octobersees the highest demand (peak season occupancy), while February experiences the lowest (low season). Effective strategies, like adjusting minimum stays or offering promotions, can boost occupancy during slower periods. Here's how different property tiers perform in Angaston:
- Best-in-class properties (Top 10%) achieve 76%+ occupancy, indicating high desirability and potentially optimized availability.
- Strong performing properties (Top 25%) maintain 63% or higher occupancy, suggesting good market fit and guest satisfaction.
- Typical properties (Median) have an occupancy rate around 40%.
- Entry-level properties (Bottom 25%) average 21% occupancy, potentially facing higher vacancy.
Average Monthly Occupancy Rate Trend in Angaston
Average Daily Rate (ADR) Airbnb Trends in Angaston (2025)
Effective short term rental pricing strategy in Angaston involves understanding monthly ADR fluctuations. The Average Daily Rate (ADR) for Airbnb in Angaston typically peaks in December and dips lowest during September. Leveraging Airbnb dynamic pricing tools or strategies based on this seasonality can significantly boost revenue. Here's a look at the typical nightly rates achieved:
- Best-in-class properties (Top 10%) command rates of $582+ per night, often due to premium features or locations.
- Strong performing properties (Top 25%) achieve nightly rates of $289 or more.
- Typical properties (Median) charge around $185 per night.
- Entry-level properties (Bottom 25%) earn around $150 per night.
Average Daily Rate (ADR) Trend by Month in Angaston
Get Live Angaston Market Intelligence 👇

Explore Real-time Analytics
Airbnb Seasonality Analysis & Trends in Angaston (2025)
Peak Season (May, June, April)
- Revenue averages $4,253 per month
- Occupancy rates average 45.5%
- Daily rates average $265
Shoulder Season
- Revenue averages $4,034 per month
- Occupancy maintains around 44.8%
- Daily rates hold near $287
Low Season (February, March, September)
- Revenue drops to average $3,090 per month
- Occupancy decreases to average 35.8%
- Daily rates adjust to average $285
Seasonality Insights for Angaston
- The Airbnb seasonality in Angaston shows moderate seasonality with distinct peak and low periods. While the sections above show seasonal averages, it's also insightful to look at the extremes:
- During the high season, the absolute peak month showcases Angaston's highest earning potential, with monthly revenues capable of climbing to $4,407, occupancy reaching a high of 49.0%, and ADRs peaking at $311.
- Conversely, the slowest single month of the year, typically falling within the low season, marks the market's lowest point. In this month, revenue might dip to $2,713, occupancy could drop to 31.0%, and ADRs may adjust down to $263.
- Understanding both the seasonal averages and these monthly peaks and troughs in revenue, occupancy, and ADR is crucial for maximizing your Airbnb profit potential in Angaston.
Seasonal Strategies for Maximizing Profit
- Peak Season: Maximize revenue through premium pricing and potentially longer minimum stays. Ensure high availability.
- Low Season: Offer competitive pricing, special promotions (e.g., extended stay discounts), and flexible cancellation policies. Target off-season travelers like remote workers or budget-conscious guests.
- Shoulder Seasons: Implement dynamic pricing that balances peak and low rates. Target weekend travelers or specific events. Offer slightly more flexible terms than peak season.
- Regularly analyze your own performance against these Angaston seasonality benchmarks and adjust your pricing and availability strategy accordingly.
Best Areas for Airbnb Investment in Angaston (2025)
Exploring the top neighborhoods for short-term rentals in Angaston? This section highlights key areas, outlining why they are attractive for hosts and guests, along with notable local attractions. Consider these locations based on your target guest profile and investment strategy.
| Neighborhood / Area | Why Host Here? (Target Guests & Appeal) | Key Attractions & Landmarks |
|---|---|---|
| Angaston Town Centre | The heart of Angaston featuring charming shops, cafes, and historical architecture. Great for guests looking to experience the local culture and community. | Angaston Heritage Walk, Barossa Valley Farmers Market, Angaston Post Office, Local wineries, Angaston Railway Station |
| Barossa Valley Wine Region | Famous wine region famous for its world-renowned vineyards and wineries. Ideal for wine lovers and tourists looking for vineyard experiences and tastings. | Penfolds Barossa Valley, Seppeltsfield, Jacob's Creek, Château Tanunda, Barossa Valley Chocolate Company |
| Sturt Reserve | A scenic area with parks and recreation facilities along the riverside, perfect for families and outdoor enthusiasts. | Sturt Reserve Playground, Angas River, Botanic Gardens, Walking trails, Picnic areas |
| Pioneer Park | Family-friendly park with BBQ facilities and space for outdoor activities. Great for families and groups looking for a relaxed atmosphere. | Pioneer Park Playground, Barbecue facilities, Walking paths, Open fields for sports |
| Angaston Heritage Museum | A cultural experience showcasing Angaston's history and heritage. Great for history buffs and those wanting to learn about local culture. | Local historical artifacts, Guided tours, Community events |
| Kies Family Wines | A renowned family-owned winery with beautiful scenery. Perfect for guests looking for a peaceful retreat with wine tasting. | Wine tasting sessions, Scenic views, Wine tours, Picnic areas |
| Adam’s Distillery | A local craft distillery offering unique spirit experiences. Attracts food and beverage enthusiasts. | Distillery tours, Spirit tasting, Local artisan products |
| Yalumba Winery | Australia's oldest family-owned winery, offering exceptional wine and cellar door experiences. Ideal for wine tourism. | Wine tastings, Tours of the winery, Beautiful gardens, Wine education experiences |
Understanding Airbnb License Requirements & STR Laws in Angaston (2025)
While Angaston, South Australia, Australia currently shows low STR regulations, specific Airbnb license requirements might still exist or change. Always verify the latest short term rental regulations and Airbnb license requirements directly with local government authorities for Angaston to ensure full compliance before hosting.
(Source: AirROI data, 2025, finding no licensed listings among those analyzed)
Top Performing Airbnb Properties in Angaston (2025)
Benchmark your potential! Explore examples of top-performing Airbnb properties in Angastonbased on Trailing Twelve Month (TTM) revenue. Analyze their characteristics, revenue, occupancy rate, and ADR to understand what drives success in this market.
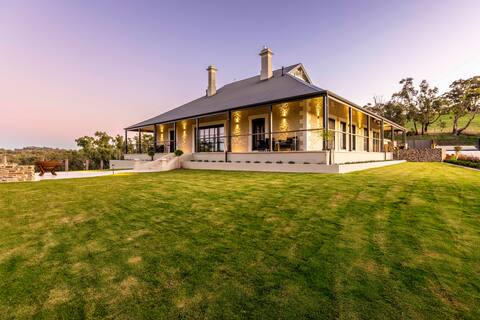
Gawler Park Estate
Entire Place • 3 bedrooms
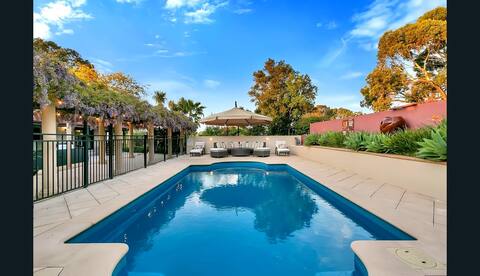
Vine View
Entire Place • 4 bedrooms
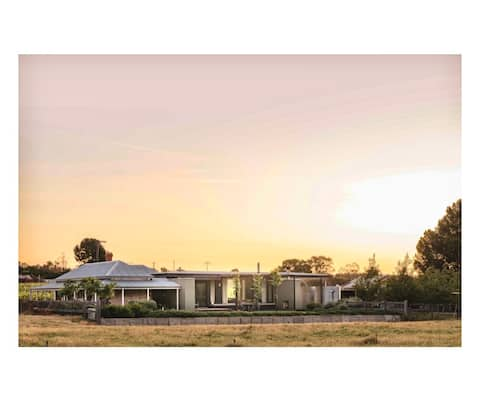
Mt Mac Barossa - Luxury & Authenticity
Entire Place • 3 bedrooms
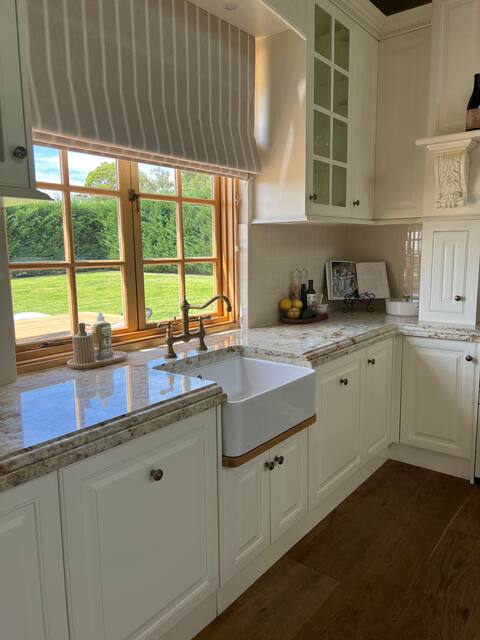
Ciel House - French style
Entire Place • 4 bedrooms
Lindsay House Homestead
Entire Place • 5 bedrooms

Benbullen Homestead
Entire Place • 5 bedrooms
Note: Performance varies based on location, size, amenities, seasonality, and management quality. Data reflects the past 12 months.
Top Performing Airbnb Hosts in Angaston (2025)
Learn from the best! This table showcases top-performing Airbnb hosts in Angaston based on the number of properties managed and estimated total revenue over the past year. Analyze their scale and performance metrics.
| Host Name | Properties | Grossing Revenue | Stay Reviews | Avg Rating |
|---|---|---|---|---|
| Host #466461269 | 4 | $356,249 | 0 | 0.00/5.0 |
| Jasmine | 5 | $284,803 | 654 | 4.86/5.0 |
| Karen | 1 | $123,536 | 36 | 4.94/5.0 |
| Louise | 1 | $97,451 | 4 | 5.00/5.0 |
| Joshua | 1 | $93,371 | 27 | 5.00/5.0 |
| Alexandra | 2 | $73,203 | 145 | 4.94/5.0 |
| Jan | 2 | $70,610 | 99 | 4.97/5.0 |
| Anne-Marie | 4 | $69,377 | 7 | 1.19/5.0 |
| Adele | 2 | $66,700 | 129 | 4.74/5.0 |
| Anne | 1 | $63,485 | 131 | 4.98/5.0 |
Analyzing the strategies of top hosts, such as their property selection, pricing, and guest communication, can offer valuable lessons for optimizing your own Airbnb operations in Angaston.
Dive Deeper: Advanced Angaston STR Market Data (2025)
Ready to unlock more insights? AirROI provides access to advanced metrics and comprehensive Airbnb data for Angaston. Explore detailed analytics beyond this report to refine your investment strategy, optimize pricing, and maximize your vacation rental profits.
Explore Advanced MetricsAngaston Short-Term Rental Market Composition (2025): Property & Room Types
Room Type Distribution
Property Type Distribution
Market Composition Insights for Angaston
- The Angaston Airbnb market composition is heavily skewed towards Entire Home/Apt listings, which make up 82.4% of the 51 active rentals. This indicates strong guest preference for privacy and space.
- Looking at the property type distribution in Angaston, House properties are the most common (60.8%), reflecting the local real estate landscape.
- Houses represent a significant 60.8% portion, catering likely to families or larger groups.
- Smaller segments like hotel/boutique (combined 2.0%) offer potential for unique stay experiences.
Angaston Airbnb Room Capacity Analysis (2025): Bedroom Distribution
Distribution of Listings by Number of Bedrooms
Room Capacity Insights for Angaston
- The dominant room capacity in Angaston is 2 bedrooms listings, making up 31.4% of the market. This suggests a strong demand for properties suitable for couples or solo travelers.
- Together, 2 bedrooms and 3 bedrooms properties represent 56.9% of the active Airbnb listings in Angaston, indicating a high concentration in these sizes.
- A significant 37.2% of listings offer 3+ bedrooms, catering to larger groups and families seeking more space in Angaston.
Angaston Vacation Rental Guest Capacity Trends (2025)
Distribution of Listings by Guest Capacity
Guest Capacity Insights for Angaston
- The most common guest capacity trend in Angaston vacation rentals is listings accommodating 6 guests (25.5%). This suggests the primary traveler segment is likely larger groups.
- Properties designed for 6 guests and 4 guests dominate the Angaston STR market, accounting for 47.1% of listings.
- 41.2% of properties accommodate 6+ guests, serving the market segment for larger families or group travel in Angaston.
- On average, properties in Angaston are equipped to host 4.4 guests.
Angaston Airbnb Booking Patterns (2025): Available vs. Booked Days
Available Days Distribution
Booked Days Distribution
Booking Pattern Insights for Angaston
- The most common availability pattern in Angaston falls within the 271-366 days range, representing 37.3% of listings. This suggests many properties have significant open periods on their calendars.
- Approximately 62.8% of listings show high availability (181+ days open annually), indicating potential for increased bookings or specific owner usage patterns.
- For booked days, the 181-270 days range is most frequent in Angaston (31.4%), reflecting common guest stay durations or potential owner blocking patterns.
- A notable 39.2% of properties secure long booking periods (181+ days booked per year), highlighting successful long-term rental strategies or significant owner usage.
Angaston Airbnb Minimum Stay Requirements Analysis
Distribution of Listings by Minimum Night Requirement
1 Night
14 listings
28.6% of total
2 Nights
25 listings
51% of total
3 Nights
1 listings
2% of total
30+ Nights
9 listings
18.4% of total
Key Insights
- The most prevalent minimum stay requirement in Angaston is 2 Nights, adopted by 51% of listings. This highlights the market's preference for shorter, flexible bookings.
- A strong majority (79.6%) of the Angaston Airbnb data shows acceptance of very short stays (1-2 nights), indicating a dynamic, high-turnover market.
- A significant segment (18.4%) caters to monthly stays (30+ nights) in Angaston, pointing to opportunities in the extended-stay market.
Recommendations
- Align with the market by considering a 2 Nights minimum stay, as 51% of Angaston hosts use this setting.
- If feasible, allowing 1-night stays, especially midweek or during low season, could capture last-minute bookings, as only 28.6% currently do.
- Explore offering discounts for stays of 30+ nights to attract the 18.4% of the market seeking extended stays.
- Adjust minimum nights based on seasonality – potentially shorter during low season and longer during peak demand periods in Angaston.
Angaston Airbnb Cancellation Policy Trends Analysis (2025)
Flexible
15 listings
34.9% of total
Moderate
10 listings
23.3% of total
Firm
5 listings
11.6% of total
Strict
13 listings
30.2% of total
Cancellation Policy Insights for Angaston
- The prevailing Airbnb cancellation policy trend in Angaston is Flexible, used by 34.9% of listings.
- There's a relatively balanced mix between guest-friendly (58.2%) and stricter (41.8%) policies, offering choices for different guest needs.
Recommendations for Hosts
- Consider adopting a Flexible policy to align with the 34.9% market standard in Angaston.
- With 30.2% using Strict terms, this is a viable option in Angaston, particularly for high-value properties or during peak demand periods.
- Regularly review your cancellation policy against competitors and market demand shifts in Angaston.
Angaston STR Booking Lead Time Analysis (2025)
Average Booking Lead Time by Month
Booking Lead Time Insights for Angaston
- The overall average booking lead time for vacation rentals in Angaston is 59 days.
- Guests book furthest in advance for stays during April (average 92 days), likely coinciding with peak travel demand or local events.
- The shortest booking windows occur for stays in August (average 46 days), indicating more last-minute travel plans during this time.
- Seasonally, Spring (74 days avg.) sees the longest lead times, while Winter (55 days avg.) has the shortest, reflecting typical travel planning cycles.
Recommendations for Hosts
- Use the overall average lead time (59 days) as a baseline for your pricing and availability strategy in Angaston.
- For April stays, consider implementing length-of-stay discounts or slightly higher rates for bookings made less than 92 days out to capitalize on advance planning.
- Target marketing efforts for the Spring season well in advance (at least 74 days) to capture early planners.
- Monitor your own booking lead times against these Angaston averages to identify opportunities for dynamic pricing adjustments.
Popular & Essential Airbnb Amenities in Angaston (2025)
Amenity Prevalence
Amenity Insights for Angaston
- Essential amenities in Angaston that guests expect include: Heating. Lacking these (this) could significantly impact bookings.
- Popular amenities like Free parking on premises, Air conditioning, Iron are common but not universal. Offering these can provide a competitive edge.
- Warning: Wifi is not universally provided but is considered essential globally. Ensure reliable Wifi is offered.
Recommendations for Hosts
- Ensure your listing includes all essential amenities for Angaston: Heating.
- Prioritize adding missing essentials: Heating.
- Consider adding popular differentiators like Free parking on premises or Air conditioning to increase appeal.
- Highlight unique or less common amenities you offer (e.g., hot tub, dedicated workspace, EV charger) in your listing description and photos.
- Regularly check competitor amenities in Angaston to stay competitive.
Angaston Airbnb Guest Demographics & Profile Analysis (2025)
Guest Profile Summary for Angaston
- The typical guest profile for Airbnb in Angaston consists of primarily domestic travelers (91%), often arriving from nearby Adelaide, typically belonging to the Post-2000s (Gen Z/Alpha) group (50%), primarily speaking English or German.
- Domestic travelers account for 90.7% of guests.
- Key international markets include Australia (90.7%) and United States (2.4%).
- Top languages spoken are English (69.8%) followed by German (4.7%).
- A significant demographic segment is the Post-2000s (Gen Z/Alpha) group, representing 50% of guests.
Recommendations for Hosts
- Target domestic marketing efforts towards travelers from Adelaide and Sydney.
- Tailor amenities and listing descriptions to appeal to the dominant Post-2000s (Gen Z/Alpha) demographic (e.g., highlight fast WiFi, smart home features, local guides).
- Highlight unique local experiences or amenities relevant to the primary guest profile.
- Consider seasonal promotions aligned with peak travel times for key origin markets.
Nearby Short-Term Rental Market Comparison
How does the Angaston Airbnb market stack up against its neighbors? Compare key performance metrics like average monthly revenue, ADR, and occupancy rates in surrounding areas to understand the broader regional STR landscape.
| Market | Active Properties | Monthly Revenue | Daily Rate | Avg. Occupancy |
|---|---|---|---|---|
| Lyndoch | 21 | $4,127 | $378.23 | 36% |
| Nuriootpa | 19 | $3,539 | $320.16 | 41% |
| Tanunda | 90 | $3,531 | $278.27 | 44% |
| Light Regional Council | 18 | $3,443 | $287.57 | 42% |
| Sevenhill | 10 | $3,391 | $186.68 | 56% |
| Stirling | 36 | $3,306 | $311.89 | 42% |
| Clare and Gilbert Valleys Council | 32 | $3,185 | $242.64 | 43% |
| Uraidla | 10 | $3,115 | $210.19 | 45% |
| Auburn | 17 | $2,987 | $189.27 | 51% |
| Inman Valley | 12 | $2,894 | $257.68 | 32% |