Adelaide Hills Council Airbnb Market Analysis 2025: Short Term Rental Data & Vacation Rental Statistics in South Australia, Australia
Is Airbnb profitable in Adelaide Hills Council in 2025? Explore comprehensive Airbnb analytics for Adelaide Hills Council, South Australia, Australia to uncover income potential. This 2025 STR market report for Adelaide Hills Council, based on AirROI data from April 2024 to March 2025, reveals key trends in the niche market of 75 active listings.
Whether you're considering an Airbnb investment in Adelaide Hills Council, optimizing your existing vacation rental, or exploring rental arbitrage opportunities, understanding the Adelaide Hills Council Airbnb data is crucial. Leveraging the low regulation environment is key to maximizing your short term rental income potential. Let's dive into the specifics.
Key Adelaide Hills Council Airbnb Performance Metrics Overview
Monthly Airbnb Revenue Variations & Income Potential in Adelaide Hills Council (2025)
Understanding the monthly revenue variations for Airbnb listings in Adelaide Hills Council is key to maximizing your short term rental income potential. Seasonality significantly impacts earnings. Our analysis, based on data from the past 12 months, shows that the peak revenue month for STRs in Adelaide Hills Council is typically December, while August often presents the lowest earnings, highlighting opportunities for strategic pricing adjustments during shoulder and low seasons. Explore the typical Airbnb income in Adelaide Hills Council across different performance tiers:
- Best-in-class properties (Top 10%) achieve $6,140+ monthly, often utilizing dynamic pricing and superior guest experiences.
- Strong performing properties (Top 25%) earn $4,478 or more, indicating effective management and desirable locations/amenities.
- Typical properties (Median) generate around $2,652 per month, representing the average market performance.
- Entry-level properties (Bottom 25%) see earnings around $1,443, often with potential for optimization.
Average Monthly Airbnb Earnings Trend in Adelaide Hills Council
Adelaide Hills Council Airbnb Occupancy Rate Trends (2025)
Maximize your bookings by understanding the Adelaide Hills Council STR occupancy trends. Seasonal demand shifts significantly influence how often properties are booked. Typically, Decembersees the highest demand (peak season occupancy), while August experiences the lowest (low season). Effective strategies, like adjusting minimum stays or offering promotions, can boost occupancy during slower periods. Here's how different property tiers perform in Adelaide Hills Council:
- Best-in-class properties (Top 10%) achieve 82%+ occupancy, indicating high desirability and potentially optimized availability.
- Strong performing properties (Top 25%) maintain 68% or higher occupancy, suggesting good market fit and guest satisfaction.
- Typical properties (Median) have an occupancy rate around 44%.
- Entry-level properties (Bottom 25%) average 24% occupancy, potentially facing higher vacancy.
Average Monthly Occupancy Rate Trend in Adelaide Hills Council
Average Daily Rate (ADR) Airbnb Trends in Adelaide Hills Council (2025)
Effective short term rental pricing strategy in Adelaide Hills Council involves understanding monthly ADR fluctuations. The Average Daily Rate (ADR) for Airbnb in Adelaide Hills Council typically peaks in December and dips lowest during August. Leveraging Airbnb dynamic pricing tools or strategies based on this seasonality can significantly boost revenue. Here's a look at the typical nightly rates achieved:
- Best-in-class properties (Top 10%) command rates of $395+ per night, often due to premium features or locations.
- Strong performing properties (Top 25%) achieve nightly rates of $236 or more.
- Typical properties (Median) charge around $173 per night.
- Entry-level properties (Bottom 25%) earn around $127 per night.
Average Daily Rate (ADR) Trend by Month in Adelaide Hills Council
Get Live Adelaide Hills Council Market Intelligence 👇

Explore Real-time Analytics
Airbnb Seasonality Analysis & Trends in Adelaide Hills Council (2025)
Peak Season (December, April, January)
- Revenue averages $3,977 per month
- Occupancy rates average 52.6%
- Daily rates average $232
Shoulder Season
- Revenue averages $3,278 per month
- Occupancy maintains around 47.4%
- Daily rates hold near $221
Low Season (February, August, September)
- Revenue drops to average $2,504 per month
- Occupancy decreases to average 40.7%
- Daily rates adjust to average $220
Seasonality Insights for Adelaide Hills Council
- The Airbnb seasonality in Adelaide Hills Council shows moderate seasonality with distinct peak and low periods. While the sections above show seasonal averages, it's also insightful to look at the extremes:
- During the high season, the absolute peak month showcases Adelaide Hills Council's highest earning potential, with monthly revenues capable of climbing to $4,289, occupancy reaching a high of 54.3%, and ADRs peaking at $238.
- Conversely, the slowest single month of the year, typically falling within the low season, marks the market's lowest point. In this month, revenue might dip to $2,356, occupancy could drop to 38.6%, and ADRs may adjust down to $217.
- Understanding both the seasonal averages and these monthly peaks and troughs in revenue, occupancy, and ADR is crucial for maximizing your Airbnb profit potential in Adelaide Hills Council.
Seasonal Strategies for Maximizing Profit
- Peak Season: Maximize revenue through premium pricing and potentially longer minimum stays. Ensure high availability.
- Low Season: Offer competitive pricing, special promotions (e.g., extended stay discounts), and flexible cancellation policies. Target off-season travelers like remote workers or budget-conscious guests.
- Shoulder Seasons: Implement dynamic pricing that balances peak and low rates. Target weekend travelers or specific events. Offer slightly more flexible terms than peak season.
- Regularly analyze your own performance against these Adelaide Hills Council seasonality benchmarks and adjust your pricing and availability strategy accordingly.
Best Areas for Airbnb Investment in Adelaide Hills Council (2025)
Exploring the top neighborhoods for short-term rentals in Adelaide Hills Council? This section highlights key areas, outlining why they are attractive for hosts and guests, along with notable local attractions. Consider these locations based on your target guest profile and investment strategy.
| Neighborhood / Area | Why Host Here? (Target Guests & Appeal) | Key Attractions & Landmarks |
|---|---|---|
| Hahndorf | A charming village with a rich German heritage, Hahndorf attracts tourists looking for unique dining, shopping, and cultural experiences. Its proximity to Adelaide makes it popular among visitors. | Hahndorf Village, Beerenberg Farm, Hahndorf Academy, The German Arms Hotel, Hahndorf Walking Tours |
| Mount Barker | As a growing regional hub, Mount Barker offers a mix of modern amenities and a relaxed lifestyle. With expanding housing developments, it appeals to families and long-term visitors alike. | Mount Barker Summit, Mount Barker Central, Local wineries, Adelaide Hills Farmers Market, Mt Barker Heritage Trail |
| Stirling | Known for its beautiful gardens and historic buildings, Stirling is an attractive location for visitors seeking tranquility and nature, as well as close proximity to Adelaide's city. | Stirling Market, Cleland Conservation Park, Stirling District School, Stirling Golf Club, Gardens of the Adelaide Hills |
| Adelaide Hills Wine Region | Famous for its vineyards and wineries, this region attracts wine enthusiasts and food lovers. Airbnb hosts can cater to tourists looking for wine-tasting experiences and gourmet dining. | Shaw + Smith, The Lane Vineyard, Adelaide Hills Wine Centre, Ambleside Distillers, The Old Murray Bridge |
| Bridgewater | A small suburb that offers a peaceful escape with stunning natural landscapes. Ideal for those seeking a rural getaway while remaining accessible to the city. | Pine Park, Bridgewater Mill, Onkaparinga River National Park, Local walking trails, Historic sites |
| Balhannah | A quaint little town rich in local produce, Balhannah is ideal for those looking to explore the Adelaide Hills and its surrounding nature while enjoying a small-town atmosphere. | Citizen Cane, Balhannah Mountain Bike Trails, Local markets, Balhannah Railway Station, Nearby hiking trails |
| Little Para Reservoir | A natural reserve area great for outdoor activities such as hiking, fishing, and picnicking. It's perfect for hosting guests interested in nature and outdoor adventures. | Little Para Reservoir, Wetlands trail, Picnic areas, Bird watching, Fishing spots |
| Mylor | A small and scenic town that offers an authentic countryside experience. Ideal for guests looking for peace, quiet, and a retreat from city life. | Mylor Conservation Park, Local farms, Mylor Oval, Hiking opportunities, Scenic lookout points |
Understanding Airbnb License Requirements & STR Laws in Adelaide Hills Council (2025)
While Adelaide Hills Council, South Australia, Australia currently shows low STR regulations, specific Airbnb license requirements might still exist or change. Always verify the latest short term rental regulations and Airbnb license requirements directly with local government authorities for Adelaide Hills Council to ensure full compliance before hosting.
(Source: AirROI data, 2025, finding no licensed listings among those analyzed)
Top Performing Airbnb Properties in Adelaide Hills Council (2025)
Benchmark your potential! Explore examples of top-performing Airbnb properties in Adelaide Hills Councilbased on Trailing Twelve Month (TTM) revenue. Analyze their characteristics, revenue, occupancy rate, and ADR to understand what drives success in this market.
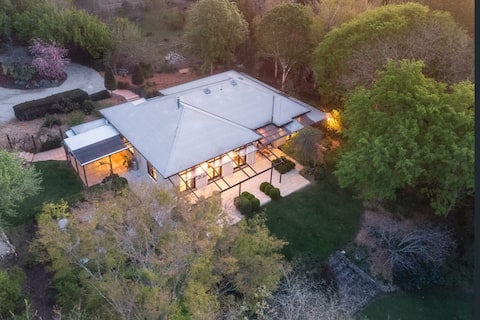
Botanique House secret gardens on 35 acres
Entire Place • 4 bedrooms

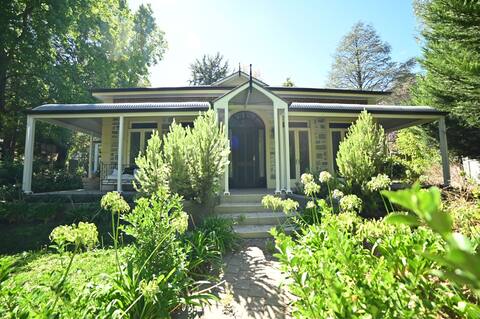
Carriage House 1884
Entire Place • 2 bedrooms
Katherine Homestead in the Adelaide Hills
Entire Place • 4 bedrooms

Manoah House Cottages + Manoah House Manor
Entire Place • 3 bedrooms

Mylor Getaway: Scenic Adelaide Hills Cottage
Entire Place • 3 bedrooms
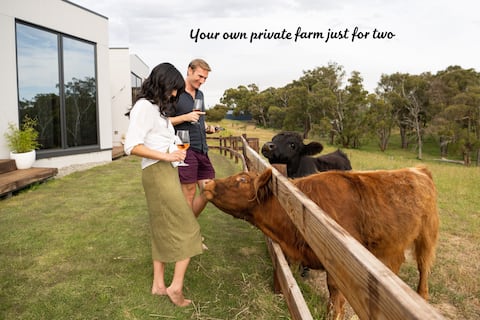
Casa Luna - A Private Luxury Farm-stay for 2
Entire Place • 1 bedroom
Note: Performance varies based on location, size, amenities, seasonality, and management quality. Data reflects the past 12 months.
Top Performing Airbnb Hosts in Adelaide Hills Council (2025)
Learn from the best! This table showcases top-performing Airbnb hosts in Adelaide Hills Council based on the number of properties managed and estimated total revenue over the past year. Analyze their scale and performance metrics.
| Host Name | Properties | Grossing Revenue | Stay Reviews | Avg Rating |
|---|---|---|---|---|
| Chloe | 2 | $131,279 | 17 | 5.00/5.0 |
| Deb | 1 | $127,922 | 33 | 5.00/5.0 |
| John | 2 | $92,303 | 43 | 4.70/5.0 |
| Christopher & Jacquie | 1 | $85,699 | 26 | 5.00/5.0 |
| Rebecca | 1 | $77,714 | 121 | 4.78/5.0 |
| Wendy | 2 | $72,205 | 56 | 4.67/5.0 |
| Wendy | 1 | $71,415 | 255 | 4.96/5.0 |
| Scott | 1 | $68,720 | 241 | 4.98/5.0 |
| The Crafers | 2 | $68,710 | 49 | 4.96/5.0 |
| Katarina | 1 | $67,023 | 17 | 4.65/5.0 |
Analyzing the strategies of top hosts, such as their property selection, pricing, and guest communication, can offer valuable lessons for optimizing your own Airbnb operations in Adelaide Hills Council.
Dive Deeper: Advanced Adelaide Hills Council STR Market Data (2025)
Ready to unlock more insights? AirROI provides access to advanced metrics and comprehensive Airbnb data for Adelaide Hills Council. Explore detailed analytics beyond this report to refine your investment strategy, optimize pricing, and maximize your vacation rental profits.
Explore Advanced MetricsAdelaide Hills Council Short-Term Rental Market Composition (2025): Property & Room Types
Room Type Distribution
Property Type Distribution
Market Composition Insights for Adelaide Hills Council
- The Adelaide Hills Council Airbnb market composition is heavily skewed towards Entire Home/Apt listings, which make up 86.7% of the 75 active rentals. This indicates strong guest preference for privacy and space.
- Looking at the property type distribution in Adelaide Hills Council, House properties are the most common (49.3%), reflecting the local real estate landscape.
- Houses represent a significant 49.3% portion, catering likely to families or larger groups.
- The presence of 22.7% Hotel/Boutique listings indicates integration with traditional hospitality.
- Smaller segments like unique stays, apartment/condo (combined 8.0%) offer potential for unique stay experiences.
Adelaide Hills Council Airbnb Room Capacity Analysis (2025): Bedroom Distribution
Distribution of Listings by Number of Bedrooms
Room Capacity Insights for Adelaide Hills Council
- The dominant room capacity in Adelaide Hills Council is 1 bedroom listings, making up 41.3% of the market. This suggests a strong demand for properties suitable for couples or solo travelers.
- Together, 1 bedroom and 2 bedrooms properties represent 68.0% of the active Airbnb listings in Adelaide Hills Council, indicating a high concentration in these sizes.
- A significant 21.3% of listings offer 3+ bedrooms, catering to larger groups and families seeking more space in Adelaide Hills Council.
Adelaide Hills Council Vacation Rental Guest Capacity Trends (2025)
Distribution of Listings by Guest Capacity
Guest Capacity Insights for Adelaide Hills Council
- The most common guest capacity trend in Adelaide Hills Council vacation rentals is listings accommodating 2 guests (36%). This suggests the primary traveler segment is likely couples or solo travelers.
- Properties designed for 2 guests and 4 guests dominate the Adelaide Hills Council STR market, accounting for 62.7% of listings.
- 22.7% of properties accommodate 6+ guests, serving the market segment for larger families or group travel in Adelaide Hills Council.
- On average, properties in Adelaide Hills Council are equipped to host 3.5 guests.
Adelaide Hills Council Airbnb Booking Patterns (2025): Available vs. Booked Days
Available Days Distribution
Booked Days Distribution
Booking Pattern Insights for Adelaide Hills Council
- The most common availability pattern in Adelaide Hills Council falls within the 91-180 days range, representing 38.7% of listings. This suggests many properties have significant open periods on their calendars.
- Approximately 56.0% of listings show high availability (181+ days open annually), indicating potential for increased bookings or specific owner usage patterns.
- For booked days, the 181-270 days range is most frequent in Adelaide Hills Council (37.3%), reflecting common guest stay durations or potential owner blocking patterns.
- A notable 46.6% of properties secure long booking periods (181+ days booked per year), highlighting successful long-term rental strategies or significant owner usage.
Adelaide Hills Council Airbnb Minimum Stay Requirements Analysis
Distribution of Listings by Minimum Night Requirement
1 Night
17 listings
23% of total
2 Nights
40 listings
54.1% of total
3 Nights
3 listings
4.1% of total
7-29 Nights
1 listings
1.4% of total
30+ Nights
13 listings
17.6% of total
Key Insights
- The most prevalent minimum stay requirement in Adelaide Hills Council is 2 Nights, adopted by 54.1% of listings. This highlights the market's preference for shorter, flexible bookings.
- A strong majority (77.1%) of the Adelaide Hills Council Airbnb data shows acceptance of very short stays (1-2 nights), indicating a dynamic, high-turnover market.
- A significant segment (17.6%) caters to monthly stays (30+ nights) in Adelaide Hills Council, pointing to opportunities in the extended-stay market.
Recommendations
- Align with the market by considering a 2 Nights minimum stay, as 54.1% of Adelaide Hills Council hosts use this setting.
- If feasible, allowing 1-night stays, especially midweek or during low season, could capture last-minute bookings, as only 23% currently do.
- Explore offering discounts for stays of 30+ nights to attract the 17.6% of the market seeking extended stays.
- Adjust minimum nights based on seasonality – potentially shorter during low season and longer during peak demand periods in Adelaide Hills Council.
Adelaide Hills Council Airbnb Cancellation Policy Trends Analysis (2025)
Flexible
18 listings
25.4% of total
Moderate
28 listings
39.4% of total
Firm
14 listings
19.7% of total
Strict
11 listings
15.5% of total
Cancellation Policy Insights for Adelaide Hills Council
- The prevailing Airbnb cancellation policy trend in Adelaide Hills Council is Moderate, used by 39.4% of listings.
- There's a relatively balanced mix between guest-friendly (64.8%) and stricter (35.2%) policies, offering choices for different guest needs.
Recommendations for Hosts
- Consider adopting a Moderate policy to align with the 39.4% market standard in Adelaide Hills Council.
- Regularly review your cancellation policy against competitors and market demand shifts in Adelaide Hills Council.
Adelaide Hills Council STR Booking Lead Time Analysis (2025)
Average Booking Lead Time by Month
Booking Lead Time Insights for Adelaide Hills Council
- The overall average booking lead time for vacation rentals in Adelaide Hills Council is 54 days.
- Guests book furthest in advance for stays during April (average 82 days), likely coinciding with peak travel demand or local events.
- The shortest booking windows occur for stays in August (average 43 days), indicating more last-minute travel plans during this time.
- Seasonally, Spring (65 days avg.) sees the longest lead times, while Summer (54 days avg.) has the shortest, reflecting typical travel planning cycles.
Recommendations for Hosts
- Use the overall average lead time (54 days) as a baseline for your pricing and availability strategy in Adelaide Hills Council.
- For April stays, consider implementing length-of-stay discounts or slightly higher rates for bookings made less than 82 days out to capitalize on advance planning.
- Target marketing efforts for the Spring season well in advance (at least 65 days) to capture early planners.
- Monitor your own booking lead times against these Adelaide Hills Council averages to identify opportunities for dynamic pricing adjustments.
Popular & Essential Airbnb Amenities in Adelaide Hills Council (2025)
Amenity Prevalence
Amenity Insights for Adelaide Hills Council
- Essential amenities in Adelaide Hills Council that guests expect include: Essentials, Free parking on premises. Lacking these (any) could significantly impact bookings.
- Popular amenities like Hot water, Heating, Smoke alarm are common but not universal. Offering these can provide a competitive edge.
Recommendations for Hosts
- Ensure your listing includes all essential amenities for Adelaide Hills Council: Essentials, Free parking on premises.
- Prioritize adding missing essentials: Essentials, Free parking on premises.
- Consider adding popular differentiators like Hot water or Heating to increase appeal.
- Highlight unique or less common amenities you offer (e.g., hot tub, dedicated workspace, EV charger) in your listing description and photos.
- Regularly check competitor amenities in Adelaide Hills Council to stay competitive.
Adelaide Hills Council Airbnb Guest Demographics & Profile Analysis (2025)
Guest Profile Summary for Adelaide Hills Council
- The typical guest profile for Airbnb in Adelaide Hills Council consists of primarily domestic travelers (91%), often arriving from nearby Adelaide, typically belonging to the Post-2000s (Gen Z/Alpha) group (50%), primarily speaking English or Chinese.
- Domestic travelers account for 91.4% of guests.
- Key international markets include Australia (91.4%) and United States (2.7%).
- Top languages spoken are English (73.5%) followed by Chinese (4.6%).
- A significant demographic segment is the Post-2000s (Gen Z/Alpha) group, representing 50% of guests.
Recommendations for Hosts
- Target domestic marketing efforts towards travelers from Adelaide and Melbourne.
- Tailor amenities and listing descriptions to appeal to the dominant Post-2000s (Gen Z/Alpha) demographic (e.g., highlight fast WiFi, smart home features, local guides).
- Highlight unique local experiences or amenities relevant to the primary guest profile.
- Consider seasonal promotions aligned with peak travel times for key origin markets.
Nearby Short-Term Rental Market Comparison
How does the Adelaide Hills Council Airbnb market stack up against its neighbors? Compare key performance metrics like average monthly revenue, ADR, and occupancy rates in surrounding areas to understand the broader regional STR landscape.
| Market | Active Properties | Monthly Revenue | Daily Rate | Avg. Occupancy |
|---|---|---|---|---|
| Middle River | 21 | $5,185 | $377.28 | 50% |
| Lyndoch | 21 | $4,127 | $378.23 | 36% |
| Nuriootpa | 19 | $3,539 | $320.16 | 41% |
| Tanunda | 90 | $3,531 | $278.27 | 44% |
| Light Regional Council | 18 | $3,443 | $287.57 | 42% |
| Stirling | 36 | $3,306 | $311.89 | 42% |
| Uraidla | 10 | $3,115 | $210.19 | 45% |
| Angaston | 51 | $3,099 | $294.72 | 41% |
| Emu Bay | 41 | $3,015 | $209.16 | 50% |
| Auburn | 17 | $2,987 | $189.27 | 51% |