Woodgate Beach Airbnb Market Analysis 2025: Short Term Rental Data & Vacation Rental Statistics in Queensland, Australia
Is Airbnb profitable in Woodgate Beach in 2025? Explore comprehensive Airbnb analytics for Woodgate Beach, Queensland, Australia to uncover income potential. This 2025 STR market report for Woodgate Beach, based on AirROI data from April 2024 to March 2025, reveals key trends in the niche market of 90 active listings.
Whether you're considering an Airbnb investment in Woodgate Beach, optimizing your existing vacation rental, or exploring rental arbitrage opportunities, understanding the Woodgate Beach Airbnb data is crucial. Leveraging the low regulation environment is key to maximizing your short term rental income potential. Let's dive into the specifics.
Key Woodgate Beach Airbnb Performance Metrics Overview
Monthly Airbnb Revenue Variations & Income Potential in Woodgate Beach (2025)
Understanding the monthly revenue variations for Airbnb listings in Woodgate Beach is key to maximizing your short term rental income potential. Seasonality significantly impacts earnings. Our analysis, based on data from the past 12 months, shows that the peak revenue month for STRs in Woodgate Beach is typically January, while February often presents the lowest earnings, highlighting opportunities for strategic pricing adjustments during shoulder and low seasons. Explore the typical Airbnb income in Woodgate Beach across different performance tiers:
- Best-in-class properties (Top 10%) achieve $3,223+ monthly, often utilizing dynamic pricing and superior guest experiences.
- Strong performing properties (Top 25%) earn $2,206 or more, indicating effective management and desirable locations/amenities.
- Typical properties (Median) generate around $1,334 per month, representing the average market performance.
- Entry-level properties (Bottom 25%) see earnings around $663, often with potential for optimization.
Average Monthly Airbnb Earnings Trend in Woodgate Beach
Woodgate Beach Airbnb Occupancy Rate Trends (2025)
Maximize your bookings by understanding the Woodgate Beach STR occupancy trends. Seasonal demand shifts significantly influence how often properties are booked. Typically, Septembersees the highest demand (peak season occupancy), while June experiences the lowest (low season). Effective strategies, like adjusting minimum stays or offering promotions, can boost occupancy during slower periods. Here's how different property tiers perform in Woodgate Beach:
- Best-in-class properties (Top 10%) achieve 75%+ occupancy, indicating high desirability and potentially optimized availability.
- Strong performing properties (Top 25%) maintain 57% or higher occupancy, suggesting good market fit and guest satisfaction.
- Typical properties (Median) have an occupancy rate around 34%.
- Entry-level properties (Bottom 25%) average 16% occupancy, potentially facing higher vacancy.
Average Monthly Occupancy Rate Trend in Woodgate Beach
Average Daily Rate (ADR) Airbnb Trends in Woodgate Beach (2025)
Effective short term rental pricing strategy in Woodgate Beach involves understanding monthly ADR fluctuations. The Average Daily Rate (ADR) for Airbnb in Woodgate Beach typically peaks in January and dips lowest during August. Leveraging Airbnb dynamic pricing tools or strategies based on this seasonality can significantly boost revenue. Here's a look at the typical nightly rates achieved:
- Best-in-class properties (Top 10%) command rates of $175+ per night, often due to premium features or locations.
- Strong performing properties (Top 25%) achieve nightly rates of $137 or more.
- Typical properties (Median) charge around $114 per night.
- Entry-level properties (Bottom 25%) earn around $99 per night.
Average Daily Rate (ADR) Trend by Month in Woodgate Beach
Get Live Woodgate Beach Market Intelligence 👇

Explore Real-time Analytics
Airbnb Seasonality Analysis & Trends in Woodgate Beach (2025)
Peak Season (January, December, September)
- Revenue averages $1,885 per month
- Occupancy rates average 44.6%
- Daily rates average $144
Shoulder Season
- Revenue averages $1,614 per month
- Occupancy maintains around 37.5%
- Daily rates hold near $118
Low Season (February, March, August)
- Revenue drops to average $1,173 per month
- Occupancy decreases to average 34.2%
- Daily rates adjust to average $117
Seasonality Insights for Woodgate Beach
- The Airbnb seasonality in Woodgate Beach shows moderate seasonality with distinct peak and low periods. While the sections above show seasonal averages, it's also insightful to look at the extremes:
- During the high season, the absolute peak month showcases Woodgate Beach's highest earning potential, with monthly revenues capable of climbing to $2,013, occupancy reaching a high of 47.2%, and ADRs peaking at $165.
- Conversely, the slowest single month of the year, typically falling within the low season, marks the market's lowest point. In this month, revenue might dip to $1,025, occupancy could drop to 28.9%, and ADRs may adjust down to $112.
- Understanding both the seasonal averages and these monthly peaks and troughs in revenue, occupancy, and ADR is crucial for maximizing your Airbnb profit potential in Woodgate Beach.
Seasonal Strategies for Maximizing Profit
- Peak Season: Maximize revenue through premium pricing and potentially longer minimum stays. Ensure high availability.
- Low Season: Offer competitive pricing, special promotions (e.g., extended stay discounts), and flexible cancellation policies. Target off-season travelers like remote workers or budget-conscious guests.
- Shoulder Seasons: Implement dynamic pricing that balances peak and low rates. Target weekend travelers or specific events. Offer slightly more flexible terms than peak season.
- Regularly analyze your own performance against these Woodgate Beach seasonality benchmarks and adjust your pricing and availability strategy accordingly.
Best Areas for Airbnb Investment in Woodgate Beach (2025)
Exploring the top neighborhoods for short-term rentals in Woodgate Beach? This section highlights key areas, outlining why they are attractive for hosts and guests, along with notable local attractions. Consider these locations based on your target guest profile and investment strategy.
| Neighborhood / Area | Why Host Here? (Target Guests & Appeal) | Key Attractions & Landmarks |
|---|---|---|
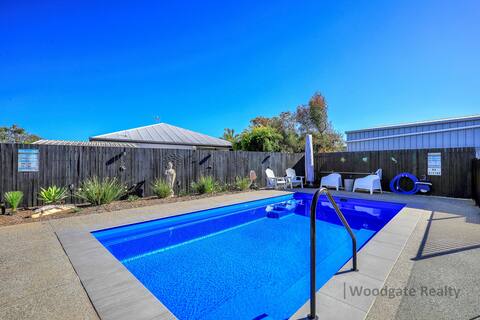
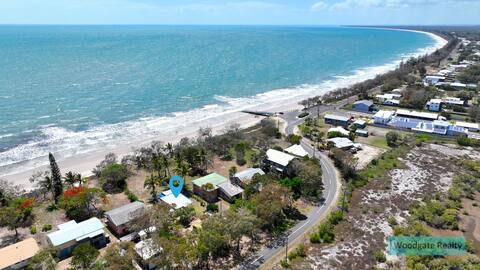
| Woodgate Beach | A tranquil and scenic beachside destination known for its stunning natural beauty and relaxed atmosphere. Ideal for families and couples seeking a peaceful getaway with easy access to the beach and local attractions. | Woodgate Beach, Woodgate National Park, Mouth of the Burrum River, Local fishing spots, Surfing and swimming spots, Wildlife watching opportunities |
| Burrum Heads | A charming coastal village nearby known for its fishing and beautiful beaches. Popular among those who enjoy outdoor activities and a laid-back lifestyle, making it attractive for holiday let options. | Burrum Heads Beach, Burrum River, Local parks, Fishing jetties, Kayaking and boating |
| Eli Creek | Located a short drive from Woodgate Beach, Eli Creek is noted for its natural beauty and crystal-clear waters. A great spot for those looking to explore the natural wonders of the region. | Eli Creek, Fraser Island, Eco-tours, Fishing spots, Beautiful hiking trails |
| Bundaberg | Although slightly further away, Bundaberg offers a mix of urban amenities and access to nearby attractions. Known for its rum distillery and botanical gardens, it appeals to a broader range of tourists. | Bundaberg Rum Distillery, Botanic Gardens, Mon Repos Conservation Park, Bundaberg Regional Art Gallery, Local markets |
| Hervey Bay | Famous for whale watching and beautiful beaches. A more developed area compared to Woodgate Beach, it offers many attractions and activities, making it a prime investment location. | Hervey Bay Whale Watching, Fraser Island tours, Urangan Pier, Local seafood dining, Botanic Gardens |
| Burnett Heads | A coastal suburb of Bundaberg known for its marina and fishing opportunities. It attracts visitors interested in water-based activities and outdoor adventures. | Burnett Heads Lighthouse, Fishing spots, Local beaches, Marina and boating, Beachfront parks |
| Rainbow Beach | A little further away, but popular for its stunning coastal landscapes and access to the Great Sandy National Park. It attracts adventurous tourists seeking outdoor experiences. | Rainbow Beach, Sandy Cape Lighthouse, Great Sandy National Park, 4WD tours, Surfing and swimming |
| Fraser Island | The world's largest sand island, Fraser Island is a UNESCO World Heritage Site attracting tourists interested in its unique ecosystems and landscapes. Perfect for nature lovers and adventure seekers. | Lake McKenzie, Maheno Shipwreck, Eli Creek, Fraser Island Rainforest, 4WD driving |
Understanding Airbnb License Requirements & STR Laws in Woodgate Beach (2025)
While Woodgate Beach, Queensland, Australia currently shows low STR regulations, specific Airbnb license requirements might still exist or change. Always verify the latest short term rental regulations and Airbnb license requirements directly with local government authorities for Woodgate Beach to ensure full compliance before hosting.
(Source: AirROI data, 2025, finding no licensed listings among those analyzed)
Top Performing Airbnb Properties in Woodgate Beach (2025)
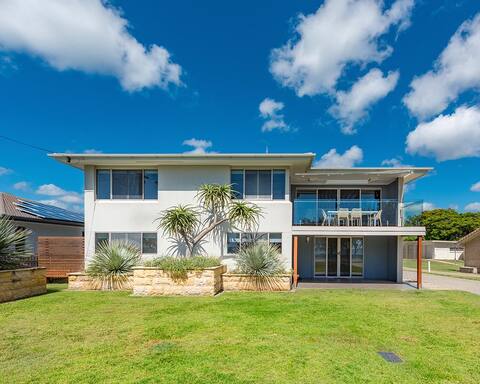
Benchmark your potential! Explore examples of top-performing Airbnb properties in Woodgate Beachbased on Trailing Twelve Month (TTM) revenue. Analyze their characteristics, revenue, occupancy rate, and ADR to understand what drives success in this market.
Beachside Bliss
Entire Place • 3 bedrooms
Bradshaw Family Beach house -The Beach at Backyard
Entire Place • 3 bedrooms

Luray Beach Retreat - Pet Friendly Beach House
Entire Place • 4 bedrooms

The Last Resort
Entire Place • 4 bedrooms

Big family holiday house for Woodgate Beach life
Entire Place • 4 bedrooms
Deluxe Beach House
Entire Place • 4 bedrooms
Note: Performance varies based on location, size, amenities, seasonality, and management quality. Data reflects the past 12 months.
Top Performing Airbnb Hosts in Woodgate Beach (2025)
Learn from the best! This table showcases top-performing Airbnb hosts in Woodgate Beach based on the number of properties managed and estimated total revenue over the past year. Analyze their scale and performance metrics.
| Host Name | Properties | Grossing Revenue | Stay Reviews | Avg Rating |
|---|---|---|---|---|
| Woodgate Beach First National | 56 | $375,368 | 346 | 1.43/5.0 |
| Woodgate Realty | 11 | $152,022 | 179 | 4.24/5.0 |
| A1 Realty-Lisa | 8 | $107,145 | 81 | 4.16/5.0 |
| Julie | 2 | $50,826 | 39 | 4.89/5.0 |
| Luray | 1 | $33,111 | 84 | 4.90/5.0 |
| Ella | 1 | $30,262 | 20 | 4.70/5.0 |
| Rhys And Vanessa | 1 | $28,325 | 41 | 4.73/5.0 |
| Tammy | 1 | $25,355 | 8 | 4.75/5.0 |
| Tammy | 1 | $22,171 | 206 | 4.64/5.0 |
| Ron | 1 | $21,004 | 13 | 4.85/5.0 |
Analyzing the strategies of top hosts, such as their property selection, pricing, and guest communication, can offer valuable lessons for optimizing your own Airbnb operations in Woodgate Beach.
Dive Deeper: Advanced Woodgate Beach STR Market Data (2025)
Ready to unlock more insights? AirROI provides access to advanced metrics and comprehensive Airbnb data for Woodgate Beach. Explore detailed analytics beyond this report to refine your investment strategy, optimize pricing, and maximize your vacation rental profits.
Explore Advanced MetricsWoodgate Beach Short-Term Rental Market Composition (2025): Property & Room Types
Room Type Distribution
Property Type Distribution
Market Composition Insights for Woodgate Beach
- The Woodgate Beach Airbnb market composition is heavily skewed towards Entire Home/Apt listings, which make up 98.9% of the 90 active rentals. This indicates strong guest preference for privacy and space.
- Looking at the property type distribution in Woodgate Beach, House properties are the most common (87.8%), reflecting the local real estate landscape.
- Houses represent a significant 87.8% portion, catering likely to families or larger groups.
- Smaller segments like others, hotel/boutique (combined 5.5%) offer potential for unique stay experiences.
Woodgate Beach Airbnb Room Capacity Analysis (2025): Bedroom Distribution
Distribution of Listings by Number of Bedrooms
Room Capacity Insights for Woodgate Beach
- The dominant room capacity in Woodgate Beach is 3 bedrooms listings, making up 43.3% of the market. This suggests a strong demand for properties suitable for families or small groups.
- Together, 3 bedrooms and 4 bedrooms properties represent 71.1% of the active Airbnb listings in Woodgate Beach, indicating a high concentration in these sizes.
- A significant 75.5% of listings offer 3+ bedrooms, catering to larger groups and families seeking more space in Woodgate Beach.
Woodgate Beach Vacation Rental Guest Capacity Trends (2025)
Distribution of Listings by Guest Capacity
Guest Capacity Insights for Woodgate Beach
- The most common guest capacity trend in Woodgate Beach vacation rentals is listings accommodating 6 guests (37.8%). This suggests the primary traveler segment is likely larger groups.
- Properties designed for 6 guests and 8+ guests dominate the Woodgate Beach STR market, accounting for 74.5% of listings.
- 81.2% of properties accommodate 6+ guests, serving the market segment for larger families or group travel in Woodgate Beach.
- On average, properties in Woodgate Beach are equipped to host 6.3 guests.
Woodgate Beach Airbnb Booking Patterns (2025): Available vs. Booked Days
Available Days Distribution
Booked Days Distribution
Booking Pattern Insights for Woodgate Beach
- The most common availability pattern in Woodgate Beach falls within the 271-366 days range, representing 64.4% of listings. This suggests many properties have significant open periods on their calendars.
- Approximately 87.7% of listings show high availability (181+ days open annually), indicating potential for increased bookings or specific owner usage patterns.
- For booked days, the 31-90 days range is most frequent in Woodgate Beach (35.6%), reflecting common guest stay durations or potential owner blocking patterns.
- A notable 12.2% of properties secure long booking periods (181+ days booked per year), highlighting successful long-term rental strategies or significant owner usage.
Woodgate Beach Airbnb Minimum Stay Requirements Analysis
Distribution of Listings by Minimum Night Requirement
1 Night
9 listings
10.2% of total
2 Nights
10 listings
11.4% of total
3 Nights
12 listings
13.6% of total
4-6 Nights
12 listings
13.6% of total
7-29 Nights
1 listings
1.1% of total
30+ Nights
44 listings
50% of total
Key Insights
- The most prevalent minimum stay requirement in Woodgate Beach is 30+ Nights, adopted by 50% of listings. This highlights the market's preference for longer commitments.
- A significant segment (50%) caters to monthly stays (30+ nights) in Woodgate Beach, pointing to opportunities in the extended-stay market.
Recommendations
- Align with the market by considering a 30+ Nights minimum stay, as 50% of Woodgate Beach hosts use this setting.
- If feasible, allowing 1-night stays, especially midweek or during low season, could capture last-minute bookings, as only 10.2% currently do.
- Explore offering discounts for stays of 30+ nights to attract the 50% of the market seeking extended stays.
- Adjust minimum nights based on seasonality – potentially shorter during low season and longer during peak demand periods in Woodgate Beach.
Woodgate Beach Airbnb Cancellation Policy Trends Analysis (2025)
Super Strict 60 Days
17 listings
36.2% of total
Flexible
4 listings
8.5% of total
Moderate
3 listings
6.4% of total
Firm
2 listings
4.3% of total
Strict
21 listings
44.7% of total
Cancellation Policy Insights for Woodgate Beach
- The prevailing Airbnb cancellation policy trend in Woodgate Beach is Strict, used by 44.7% of listings.
- There's a relatively balanced mix between guest-friendly (14.9%) and stricter (49.0%) policies, offering choices for different guest needs.
Recommendations for Hosts
- Consider adopting a Strict policy to align with the 44.7% market standard in Woodgate Beach.
- With 44.7% using Strict terms, this is a viable option in Woodgate Beach, particularly for high-value properties or during peak demand periods.
- Regularly review your cancellation policy against competitors and market demand shifts in Woodgate Beach.
Woodgate Beach STR Booking Lead Time Analysis (2025)
Average Booking Lead Time by Month
Booking Lead Time Insights for Woodgate Beach
- The overall average booking lead time for vacation rentals in Woodgate Beach is 64 days.
- Guests book furthest in advance for stays during December (average 110 days), likely coinciding with peak travel demand or local events.
- The shortest booking windows occur for stays in May (average 48 days), indicating more last-minute travel plans during this time.
- Seasonally, Winter (90 days avg.) sees the longest lead times, while Summer (58 days avg.) has the shortest, reflecting typical travel planning cycles.
Recommendations for Hosts
- Use the overall average lead time (64 days) as a baseline for your pricing and availability strategy in Woodgate Beach.
- For December stays, consider implementing length-of-stay discounts or slightly higher rates for bookings made less than 110 days out to capitalize on advance planning.
- Target marketing efforts for the Winter season well in advance (at least 90 days) to capture early planners.
- Monitor your own booking lead times against these Woodgate Beach averages to identify opportunities for dynamic pricing adjustments.
Popular & Essential Airbnb Amenities in Woodgate Beach (2025)
Amenity Prevalence
Amenity Insights for Woodgate Beach
- Essential amenities in Woodgate Beach that guests expect include: Kitchen, TV, Washer, Smoke alarm. Lacking these (any) could significantly impact bookings.
- Popular amenities like Refrigerator, Microwave, Air conditioning are common but not universal. Offering these can provide a competitive edge.
Recommendations for Hosts
- Ensure your listing includes all essential amenities for Woodgate Beach: Kitchen, TV, Washer, Smoke alarm.
- Prioritize adding missing essentials: Washer, Smoke alarm.
- Consider adding popular differentiators like Refrigerator or Microwave to increase appeal.
- Highlight unique or less common amenities you offer (e.g., hot tub, dedicated workspace, EV charger) in your listing description and photos.
- Regularly check competitor amenities in Woodgate Beach to stay competitive.
Woodgate Beach Airbnb Guest Demographics & Profile Analysis (2025)
Guest Profile Summary for Woodgate Beach
- The typical guest profile for Airbnb in Woodgate Beach consists of primarily domestic travelers (93%), often arriving from nearby Brisbane, typically belonging to the Post-2000s (Gen Z/Alpha) group (50%), primarily speaking English or German.
- Domestic travelers account for 92.5% of guests.
- Key international markets include Australia (92.5%) and New Zealand (1.9%).
- Top languages spoken are English (75.4%) followed by German (9.2%).
- A significant demographic segment is the Post-2000s (Gen Z/Alpha) group, representing 50% of guests.
Recommendations for Hosts
- Target domestic marketing efforts towards travelers from Brisbane and Queensland.
- Tailor amenities and listing descriptions to appeal to the dominant Post-2000s (Gen Z/Alpha) demographic (e.g., highlight fast WiFi, smart home features, local guides).
- Highlight unique local experiences or amenities relevant to the primary guest profile.
- Consider seasonal promotions aligned with peak travel times for key origin markets.
Nearby Short-Term Rental Market Comparison
How does the Woodgate Beach Airbnb market stack up against its neighbors? Compare key performance metrics like average monthly revenue, ADR, and occupancy rates in surrounding areas to understand the broader regional STR landscape.
| Market | Active Properties | Monthly Revenue | Daily Rate | Avg. Occupancy |
|---|---|---|---|---|
| Castaways Beach | 17 | $5,430 | $517.24 | 47% |
| Noosa Heads | 1,002 | $4,142 | $382.10 | 48% |
| Kingfisher Bay | 29 | $4,002 | $342.74 | 42% |
| Happy Valley | 10 | $3,770 | $222.76 | 57% |
| Sunrise Beach | 110 | $3,666 | $357.47 | 48% |
| Sunshine Beach | 289 | $3,550 | $402.94 | 42% |
| Marcus Beach | 22 | $3,309 | $439.85 | 45% |
| Eurong | 24 | $3,111 | $222.15 | 54% |
| Seventeen Seventy | 29 | $3,032 | $270.56 | 42% |
| Sunshine Coast Regional | 3,453 | $2,894 | $243.73 | 48% |