Wongaling Beach Airbnb Market Analysis 2025: Short Term Rental Data & Vacation Rental Statistics in Queensland, Australia
Is Airbnb profitable in Wongaling Beach in 2025? Explore comprehensive Airbnb analytics for Wongaling Beach, Queensland, Australia to uncover income potential. This 2025 STR market report for Wongaling Beach, based on AirROI data from April 2024 to March 2025, reveals key trends in the niche market of 52 active listings.
Whether you're considering an Airbnb investment in Wongaling Beach, optimizing your existing vacation rental, or exploring rental arbitrage opportunities, understanding the Wongaling Beach Airbnb data is crucial. Leveraging the low regulation environment is key to maximizing your short term rental income potential. Let's dive into the specifics.
Key Wongaling Beach Airbnb Performance Metrics Overview
Monthly Airbnb Revenue Variations & Income Potential in Wongaling Beach (2025)
Understanding the monthly revenue variations for Airbnb listings in Wongaling Beach is key to maximizing your short term rental income potential. Seasonality significantly impacts earnings. Our analysis, based on data from the past 12 months, shows that the peak revenue month for STRs in Wongaling Beach is typically July, while March often presents the lowest earnings, highlighting opportunities for strategic pricing adjustments during shoulder and low seasons. Explore the typical Airbnb income in Wongaling Beach across different performance tiers:
- Best-in-class properties (Top 10%) achieve $5,044+ monthly, often utilizing dynamic pricing and superior guest experiences.
- Strong performing properties (Top 25%) earn $3,405 or more, indicating effective management and desirable locations/amenities.
- Typical properties (Median) generate around $1,908 per month, representing the average market performance.
- Entry-level properties (Bottom 25%) see earnings around $965, often with potential for optimization.
Average Monthly Airbnb Earnings Trend in Wongaling Beach
Wongaling Beach Airbnb Occupancy Rate Trends (2025)
Maximize your bookings by understanding the Wongaling Beach STR occupancy trends. Seasonal demand shifts significantly influence how often properties are booked. Typically, Julysees the highest demand (peak season occupancy), while March experiences the lowest (low season). Effective strategies, like adjusting minimum stays or offering promotions, can boost occupancy during slower periods. Here's how different property tiers perform in Wongaling Beach:
- Best-in-class properties (Top 10%) achieve 74%+ occupancy, indicating high desirability and potentially optimized availability.
- Strong performing properties (Top 25%) maintain 48% or higher occupancy, suggesting good market fit and guest satisfaction.
- Typical properties (Median) have an occupancy rate around 30%.
- Entry-level properties (Bottom 25%) average 16% occupancy, potentially facing higher vacancy.
Average Monthly Occupancy Rate Trend in Wongaling Beach
Average Daily Rate (ADR) Airbnb Trends in Wongaling Beach (2025)
Effective short term rental pricing strategy in Wongaling Beach involves understanding monthly ADR fluctuations. The Average Daily Rate (ADR) for Airbnb in Wongaling Beach typically peaks in October and dips lowest during March. Leveraging Airbnb dynamic pricing tools or strategies based on this seasonality can significantly boost revenue. Here's a look at the typical nightly rates achieved:
- Best-in-class properties (Top 10%) command rates of $467+ per night, often due to premium features or locations.
- Strong performing properties (Top 25%) achieve nightly rates of $320 or more.
- Typical properties (Median) charge around $207 per night.
- Entry-level properties (Bottom 25%) earn around $144 per night.
Average Daily Rate (ADR) Trend by Month in Wongaling Beach
Get Live Wongaling Beach Market Intelligence 👇

Explore Real-time Analytics
Airbnb Seasonality Analysis & Trends in Wongaling Beach (2025)
Peak Season (July, November, August)
- Revenue averages $3,236 per month
- Occupancy rates average 45.6%
- Daily rates average $254
Shoulder Season
- Revenue averages $2,436 per month
- Occupancy maintains around 34.6%
- Daily rates hold near $252
Low Season (February, March, April)
- Revenue drops to average $1,631 per month
- Occupancy decreases to average 25.2%
- Daily rates adjust to average $239
Seasonality Insights for Wongaling Beach
- The Airbnb seasonality in Wongaling Beach shows highly seasonal trends requiring careful strategy. While the sections above show seasonal averages, it's also insightful to look at the extremes:
- During the high season, the absolute peak month showcases Wongaling Beach's highest earning potential, with monthly revenues capable of climbing to $3,525, occupancy reaching a high of 49.4%, and ADRs peaking at $264.
- Conversely, the slowest single month of the year, typically falling within the low season, marks the market's lowest point. In this month, revenue might dip to $1,303, occupancy could drop to 19.5%, and ADRs may adjust down to $226.
- Understanding both the seasonal averages and these monthly peaks and troughs in revenue, occupancy, and ADR is crucial for maximizing your Airbnb profit potential in Wongaling Beach.
Seasonal Strategies for Maximizing Profit
- Peak Season: Maximize revenue through premium pricing and potentially longer minimum stays. Ensure high availability.
- Low Season: Offer competitive pricing, special promotions (e.g., extended stay discounts), and flexible cancellation policies. Target off-season travelers like remote workers or budget-conscious guests.
- Shoulder Seasons: Implement dynamic pricing that balances peak and low rates. Target weekend travelers or specific events. Offer slightly more flexible terms than peak season.
- Regularly analyze your own performance against these Wongaling Beach seasonality benchmarks and adjust your pricing and availability strategy accordingly.
Best Areas for Airbnb Investment in Wongaling Beach (2025)
Exploring the top neighborhoods for short-term rentals in Wongaling Beach? This section highlights key areas, outlining why they are attractive for hosts and guests, along with notable local attractions. Consider these locations based on your target guest profile and investment strategy.
| Neighborhood / Area | Why Host Here? (Target Guests & Appeal) | Key Attractions & Landmarks |
|---|---|---|
| Wongaling Beach | A beautiful beach destination popular among tourists for its stunning natural scenery, warm climate, and laid-back lifestyle. Ideal for guests wanting a beach getaway with access to the Great Barrier Reef. | Mission Beach, Bramston Beach, Family-friendly activities, Daintree Rainforest, Great Barrier Reef access, Water sports and activities |
| Mission Beach | Famous for its pristine beaches and opportunities for adventure activities like skydiving and reef tours. A prime spot for tourists looking for action and relaxation in one location. | Mission Beach Markets, Skydiving over the beach, Wet Tropics World Heritage Area, Boat tours to Dunk Island, Local cafes and restaurants, Nature walking trails |
| Dunk Island | A tropical island paradise offering stunning landscapes, hiking trails, and beautiful beaches. Ideal for guests looking for a serene escape and nature adventures. | Dunk Island Resort, Scenic walking trails, Snorkeling spots, Shell Beach, Rainforest walks, Dunk Island National Park |
| Tully | Just a short drive from Wongaling Beach, Tully offers access to Queensland's lush rainforests and is known for its rich agricultural background. Great for guests interested in exploring the area further. | Tully Gorge National Park, Tully Sugar Mill, The iconic Tully River, Kayaking and rafting activities, Local markets, Tully's scenic hinterland |
| Kurrimine Beach | A quiet beach spot just south of Wongaling Beach, perfect for fishing enthusiasts and those looking to escape the crowds. Family-friendly activities are plentiful here. | Fishing spots, Beachfront camping, Kurrimine Beach Markets, Turtle watching, Nature parks, Local eateries |
| Cardwell | Situated north of Wongaling Beach, Cardwell features stunning views of Hinchinbrook Island and lush tropical landscapes. Popular for fishing, bushwalking, and enjoying the outdoors. | Cardwell Jetty, Hinchinbrook Island, Bushwalking trails, Cardwell Spa Pool, Local seafood restaurants, Scenic viewpoints |
| Innisfail | Just a bit inland, Innisfail is known for its rich history and beautiful heritage buildings. It offers a different perspective of Queensland's lush environment and attracts visitors seeking cultural experiences. | Paronella Park, Historic Johnstone River, Local artisan shops, Botanical gardens, Innisfail Art Deco architecture, River cruises |
| Cairns | A major tourist hub that provides access to the Great Barrier Reef and numerous adventure activities. An ideal base for guests planning to explore the region. | Cairns Esplanade, Great Barrier Reef tours, Kuranda Scenic Railway, Cairns Night Markets, Skyrail Rainforest Cableway, Local dining and nightlife options |
Understanding Airbnb License Requirements & STR Laws in Wongaling Beach (2025)
While Wongaling Beach, Queensland, Australia currently shows low STR regulations, specific Airbnb license requirements might still exist or change. Always verify the latest short term rental regulations and Airbnb license requirements directly with local government authorities for Wongaling Beach to ensure full compliance before hosting.
(Source: AirROI data, 2025, finding no licensed listings among those analyzed)
Top Performing Airbnb Properties in Wongaling Beach (2025)
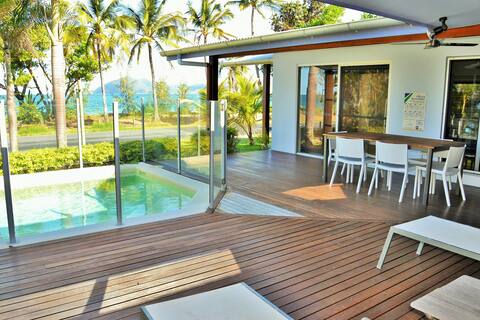
Benchmark your potential! Explore examples of top-performing Airbnb properties in Wongaling Beachbased on Trailing Twelve Month (TTM) revenue. Analyze their characteristics, revenue, occupancy rate, and ADR to understand what drives success in this market.

The Sandpit Beachfront Bliss: Luxurious 4-Bedroom
Entire Place • 4 bedrooms
Banfields Retreat
Entire Place • 3 bedrooms

Litoria Mission Beach
Entire Place • 4 bedrooms

Frangipani Place - 1 Bedroom - Beachfront
Entire Place • 1 bedroom

The Boat House - Absolute Beachfront Luxury
Entire Place • 3 bedrooms
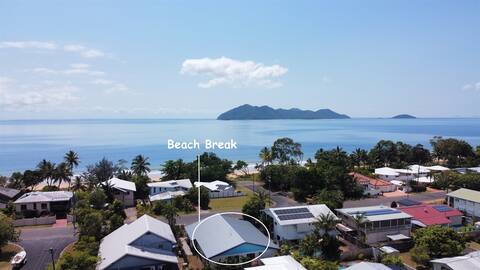
Beach Break - 4 Bedroom use - Family Home
Entire Place • 4 bedrooms
Note: Performance varies based on location, size, amenities, seasonality, and management quality. Data reflects the past 12 months.
Top Performing Airbnb Hosts in Wongaling Beach (2025)
Learn from the best! This table showcases top-performing Airbnb hosts in Wongaling Beach based on the number of properties managed and estimated total revenue over the past year. Analyze their scale and performance metrics.
| Host Name | Properties | Grossing Revenue | Stay Reviews | Avg Rating |
|---|---|---|---|---|
| Karyn Mel Natalia And Vicki | 20 | $324,471 | 189 | 3.51/5.0 |
| Tropical Holidays | 11 | $155,812 | 165 | 4.29/5.0 |
| Todd | 4 | $127,213 | 140 | 4.71/5.0 |
| Taleah | 1 | $87,563 | 286 | 4.98/5.0 |
| Melissa | 2 | $75,931 | 168 | 4.96/5.0 |
| Anne | 1 | $59,067 | 145 | 4.92/5.0 |
| Host #139373626 | 1 | $32,432 | 139 | 4.76/5.0 |
| Rylie | 1 | $29,952 | 120 | 4.94/5.0 |
| Host #431061254 | 1 | $29,331 | 41 | 4.98/5.0 |
| Paul | 1 | $27,826 | 277 | 4.83/5.0 |
Analyzing the strategies of top hosts, such as their property selection, pricing, and guest communication, can offer valuable lessons for optimizing your own Airbnb operations in Wongaling Beach.
Dive Deeper: Advanced Wongaling Beach STR Market Data (2025)
Ready to unlock more insights? AirROI provides access to advanced metrics and comprehensive Airbnb data for Wongaling Beach. Explore detailed analytics beyond this report to refine your investment strategy, optimize pricing, and maximize your vacation rental profits.
Explore Advanced MetricsWongaling Beach Short-Term Rental Market Composition (2025): Property & Room Types
Room Type Distribution
Property Type Distribution
Market Composition Insights for Wongaling Beach
- The Wongaling Beach Airbnb market composition is heavily skewed towards Entire Home/Apt listings, which make up 100% of the 52 active rentals. This indicates strong guest preference for privacy and space.
- Looking at the property type distribution in Wongaling Beach, House properties are the most common (75%), reflecting the local real estate landscape.
- Houses represent a significant 75% portion, catering likely to families or larger groups.
- Smaller segments like hotel/boutique, outdoor/unique, others (combined 7.6%) offer potential for unique stay experiences.
Wongaling Beach Airbnb Room Capacity Analysis (2025): Bedroom Distribution
Distribution of Listings by Number of Bedrooms
Room Capacity Insights for Wongaling Beach
- The dominant room capacity in Wongaling Beach is 2 bedrooms listings, making up 40.4% of the market. This suggests a strong demand for properties suitable for couples or solo travelers.
- Together, 2 bedrooms and 3 bedrooms properties represent 69.2% of the active Airbnb listings in Wongaling Beach, indicating a high concentration in these sizes.
- A significant 40.3% of listings offer 3+ bedrooms, catering to larger groups and families seeking more space in Wongaling Beach.
Wongaling Beach Vacation Rental Guest Capacity Trends (2025)
Distribution of Listings by Guest Capacity
Guest Capacity Insights for Wongaling Beach
- The most common guest capacity trend in Wongaling Beach vacation rentals is listings accommodating 6 guests (28.8%). This suggests the primary traveler segment is likely larger groups.
- Properties designed for 6 guests and 4 guests dominate the Wongaling Beach STR market, accounting for 55.7% of listings.
- 46.1% of properties accommodate 6+ guests, serving the market segment for larger families or group travel in Wongaling Beach.
- On average, properties in Wongaling Beach are equipped to host 4.8 guests.
Wongaling Beach Airbnb Booking Patterns (2025): Available vs. Booked Days
Available Days Distribution
Booked Days Distribution
Booking Pattern Insights for Wongaling Beach
- The most common availability pattern in Wongaling Beach falls within the 271-366 days range, representing 53.8% of listings. This suggests many properties have significant open periods on their calendars.
- Approximately 88.4% of listings show high availability (181+ days open annually), indicating potential for increased bookings or specific owner usage patterns.
- For booked days, the 31-90 days range is most frequent in Wongaling Beach (36.5%), reflecting common guest stay durations or potential owner blocking patterns.
- A notable 15.4% of properties secure long booking periods (181+ days booked per year), highlighting successful long-term rental strategies or significant owner usage.
Wongaling Beach Airbnb Minimum Stay Requirements Analysis
Distribution of Listings by Minimum Night Requirement
2 Nights
21 listings
46.7% of total
3 Nights
5 listings
11.1% of total
4-6 Nights
8 listings
17.8% of total
30+ Nights
11 listings
24.4% of total
Key Insights
- The most prevalent minimum stay requirement in Wongaling Beach is 2 Nights, adopted by 46.7% of listings. This highlights the market's preference for shorter, flexible bookings.
- A significant segment (24.4%) caters to monthly stays (30+ nights) in Wongaling Beach, pointing to opportunities in the extended-stay market.
Recommendations
- Align with the market by considering a 2 Nights minimum stay, as 46.7% of Wongaling Beach hosts use this setting.
- A 2-night minimum appears standard (46.7%). Consider this for weekends or peak periods.
- Explore offering discounts for stays of 30+ nights to attract the 24.4% of the market seeking extended stays.
- Adjust minimum nights based on seasonality – potentially shorter during low season and longer during peak demand periods in Wongaling Beach.
Wongaling Beach Airbnb Cancellation Policy Trends Analysis (2025)
Flexible
3 listings
7% of total
Moderate
3 listings
7% of total
Firm
10 listings
23.3% of total
Strict
27 listings
62.8% of total
Cancellation Policy Insights for Wongaling Beach
- The prevailing Airbnb cancellation policy trend in Wongaling Beach is Strict, used by 62.8% of listings.
- A majority (86.1%) of hosts in Wongaling Beach utilize Firm or Strict policies, indicating a market where hosts prioritize booking security.
Recommendations for Hosts
- Consider adopting a Strict policy to align with the 62.8% market standard in Wongaling Beach.
- With 62.8% using Strict terms, this is a viable option in Wongaling Beach, particularly for high-value properties or during peak demand periods.
- Regularly review your cancellation policy against competitors and market demand shifts in Wongaling Beach.
Wongaling Beach STR Booking Lead Time Analysis (2025)
Average Booking Lead Time by Month
Booking Lead Time Insights for Wongaling Beach
- The overall average booking lead time for vacation rentals in Wongaling Beach is 70 days.
- Guests book furthest in advance for stays during June (average 108 days), likely coinciding with peak travel demand or local events.
- The shortest booking windows occur for stays in February (average 30 days), indicating more last-minute travel plans during this time.
- Seasonally, Summer (94 days avg.) sees the longest lead times, while Spring (64 days avg.) has the shortest, reflecting typical travel planning cycles.
Recommendations for Hosts
- Use the overall average lead time (70 days) as a baseline for your pricing and availability strategy in Wongaling Beach.
- For June stays, consider implementing length-of-stay discounts or slightly higher rates for bookings made less than 108 days out to capitalize on advance planning.
- Target marketing efforts for the Summer season well in advance (at least 94 days) to capture early planners.
- Monitor your own booking lead times against these Wongaling Beach averages to identify opportunities for dynamic pricing adjustments.
Popular & Essential Airbnb Amenities in Wongaling Beach (2025)
Amenity Prevalence
Amenity Insights for Wongaling Beach
- Essential amenities in Wongaling Beach that guests expect include: Kitchen, TV, Free parking on premises, Air conditioning, Essentials, Iron, Refrigerator, Washer, Dryer, Hangers. Lacking these (any) could significantly impact bookings.
Recommendations for Hosts
- Ensure your listing includes all essential amenities for Wongaling Beach: Kitchen, TV, Free parking on premises, Air conditioning, Essentials, Iron, Refrigerator, Washer, Dryer, Hangers.
- Prioritize adding missing essentials: Free parking on premises, Air conditioning, Essentials, Iron, Refrigerator, Washer, Dryer, Hangers.
- Highlight unique or less common amenities you offer (e.g., hot tub, dedicated workspace, EV charger) in your listing description and photos.
- Regularly check competitor amenities in Wongaling Beach to stay competitive.
Wongaling Beach Airbnb Guest Demographics & Profile Analysis (2025)
Guest Profile Summary for Wongaling Beach
- The typical guest profile for Airbnb in Wongaling Beach consists of primarily domestic travelers (83%), often arriving from nearby Cairns, typically belonging to the Post-2000s (Gen Z/Alpha) group (50%), primarily speaking English or German.
- Domestic travelers account for 83.0% of guests.
- Key international markets include Australia (83%) and United Kingdom (3.9%).
- Top languages spoken are English (67.7%) followed by German (11.5%).
- A significant demographic segment is the Post-2000s (Gen Z/Alpha) group, representing 50% of guests.
Recommendations for Hosts
- Target domestic marketing efforts towards travelers from Cairns and Townsville.
- Tailor amenities and listing descriptions to appeal to the dominant Post-2000s (Gen Z/Alpha) demographic (e.g., highlight fast WiFi, smart home features, local guides).
- Highlight unique local experiences or amenities relevant to the primary guest profile.
- Consider seasonal promotions aligned with peak travel times for key origin markets.
Nearby Short-Term Rental Market Comparison
How does the Wongaling Beach Airbnb market stack up against its neighbors? Compare key performance metrics like average monthly revenue, ADR, and occupancy rates in surrounding areas to understand the broader regional STR landscape.
| Market | Active Properties | Monthly Revenue | Daily Rate | Avg. Occupancy |
|---|---|---|---|---|
| Cairns Regional | 798 | $3,196 | $270.26 | 47% |
| Port Douglas | 628 | $3,131 | $326.85 | 42% |
| Douglas Shire | 156 | $2,839 | $285.24 | 43% |
| Tablelands Regional | 50 | $2,714 | $218.21 | 47% |
| Mission Beach | 60 | $2,544 | $262.59 | 40% |
| Cairns | 929 | $2,484 | $164.58 | 57% |
| Yungaburra | 50 | $2,284 | $187.52 | 43% |
| Cardwell | 16 | $2,084 | $245.41 | 37% |
| South Mission Beach | 36 | $1,957 | $242.65 | 31% |
| Mareeba Shire | 40 | $1,949 | $160.23 | 42% |