Townsville City Airbnb Market Analysis 2025: Short Term Rental Data & Vacation Rental Statistics in Queensland, Australia
Is Airbnb profitable in Townsville City in 2025? Explore comprehensive Airbnb analytics for Townsville City, Queensland, Australia to uncover income potential. This 2025 STR market report for Townsville City, based on AirROI data from April 2024 to March 2025, reveals key trends in the market of 324 active listings.
Whether you're considering an Airbnb investment in Townsville City, optimizing your existing vacation rental, or exploring rental arbitrage opportunities, understanding the Townsville City Airbnb data is crucial. Leveraging the low regulation environment is key to maximizing your short term rental income potential. Let's dive into the specifics.
Key Townsville City Airbnb Performance Metrics Overview
Monthly Airbnb Revenue Variations & Income Potential in Townsville City (2025)
Understanding the monthly revenue variations for Airbnb listings in Townsville City is key to maximizing your short term rental income potential. Seasonality significantly impacts earnings. Our analysis, based on data from the past 12 months, shows that the peak revenue month for STRs in Townsville City is typically August, while February often presents the lowest earnings, highlighting opportunities for strategic pricing adjustments during shoulder and low seasons. Explore the typical Airbnb income in Townsville City across different performance tiers:
- Best-in-class properties (Top 10%) achieve $5,330+ monthly, often utilizing dynamic pricing and superior guest experiences.
- Strong performing properties (Top 25%) earn $3,486 or more, indicating effective management and desirable locations/amenities.
- Typical properties (Median) generate around $2,118 per month, representing the average market performance.
- Entry-level properties (Bottom 25%) see earnings around $1,100, often with potential for optimization.
Average Monthly Airbnb Earnings Trend in Townsville City
Townsville City Airbnb Occupancy Rate Trends (2025)
Maximize your bookings by understanding the Townsville City STR occupancy trends. Seasonal demand shifts significantly influence how often properties are booked. Typically, Augustsees the highest demand (peak season occupancy), while February experiences the lowest (low season). Effective strategies, like adjusting minimum stays or offering promotions, can boost occupancy during slower periods. Here's how different property tiers perform in Townsville City:
- Best-in-class properties (Top 10%) achieve 75%+ occupancy, indicating high desirability and potentially optimized availability.
- Strong performing properties (Top 25%) maintain 59% or higher occupancy, suggesting good market fit and guest satisfaction.
- Typical properties (Median) have an occupancy rate around 36%.
- Entry-level properties (Bottom 25%) average 19% occupancy, potentially facing higher vacancy.
Average Monthly Occupancy Rate Trend in Townsville City
Average Daily Rate (ADR) Airbnb Trends in Townsville City (2025)
Effective short term rental pricing strategy in Townsville City involves understanding monthly ADR fluctuations. The Average Daily Rate (ADR) for Airbnb in Townsville City typically peaks in September and dips lowest during February. Leveraging Airbnb dynamic pricing tools or strategies based on this seasonality can significantly boost revenue. Here's a look at the typical nightly rates achieved:
- Best-in-class properties (Top 10%) command rates of $350+ per night, often due to premium features or locations.
- Strong performing properties (Top 25%) achieve nightly rates of $263 or more.
- Typical properties (Median) charge around $189 per night.
- Entry-level properties (Bottom 25%) earn around $128 per night.
Average Daily Rate (ADR) Trend by Month in Townsville City
Get Live Townsville City Market Intelligence 👇

Explore Real-time Analytics
Airbnb Seasonality Analysis & Trends in Townsville City (2025)
Peak Season (August, July, September)
- Revenue averages $3,557 per month
- Occupancy rates average 55.1%
- Daily rates average $215
Shoulder Season
- Revenue averages $2,552 per month
- Occupancy maintains around 36.4%
- Daily rates hold near $212
Low Season (January, February, March)
- Revenue drops to average $1,708 per month
- Occupancy decreases to average 30.4%
- Daily rates adjust to average $205
Seasonality Insights for Townsville City
- The Airbnb seasonality in Townsville City shows highly seasonal trends requiring careful strategy. While the sections above show seasonal averages, it's also insightful to look at the extremes:
- During the high season, the absolute peak month showcases Townsville City's highest earning potential, with monthly revenues capable of climbing to $3,672, occupancy reaching a high of 58.4%, and ADRs peaking at $216.
- Conversely, the slowest single month of the year, typically falling within the low season, marks the market's lowest point. In this month, revenue might dip to $1,495, occupancy could drop to 29.2%, and ADRs may adjust down to $200.
- Understanding both the seasonal averages and these monthly peaks and troughs in revenue, occupancy, and ADR is crucial for maximizing your Airbnb profit potential in Townsville City.
Seasonal Strategies for Maximizing Profit
- Peak Season: Maximize revenue through premium pricing and potentially longer minimum stays. Ensure high availability.
- Low Season: Offer competitive pricing, special promotions (e.g., extended stay discounts), and flexible cancellation policies. Target off-season travelers like remote workers or budget-conscious guests.
- Shoulder Seasons: Implement dynamic pricing that balances peak and low rates. Target weekend travelers or specific events. Offer slightly more flexible terms than peak season.
- Regularly analyze your own performance against these Townsville City seasonality benchmarks and adjust your pricing and availability strategy accordingly.
Best Areas for Airbnb Investment in Townsville City (2025)
Exploring the top neighborhoods for short-term rentals in Townsville City? This section highlights key areas, outlining why they are attractive for hosts and guests, along with notable local attractions. Consider these locations based on your target guest profile and investment strategy.
| Neighborhood / Area | Why Host Here? (Target Guests & Appeal) | Key Attractions & Landmarks |
|---|---|---|
| The Strand | A beautiful waterfront promenade that offers stunning views and easy access to the beach. Popular with tourists for its beautiful scenery, cafes, and recreational activities. | The Strand Park, Jezzine Barracks, Casino, Aquatic Adventures, Beachfront Markets |
| Townsville CBD | The central business district is bustling with cafes, restaurants, and nightlife. It's a hub for both business and leisure travelers, making it an ideal spot for Airbnb hosting. | Townsville Cultural Centre, Empire Theatre, Flinders Street, Reef HQ Aquarium, Townsville Bulletin Square |
| Castle Hill | Known for its iconic landmark, Castle Hill offers panoramic views of the city and the ocean. This area attracts tourists wanting to hike and enjoy nature while staying close to the city. | Castle Hill Lookout, Walking Trails, Rock Climbing, Infinity Pools |
| Cleveland Bay | A coastal area that's popular with families and beachgoers. It has beautiful beaches and parks, making it great for family-oriented Airbnb listings. | Cleveland Bay Beach, Pallarenda Beach, Bicentennial Park, Family-friendly amenities |
| Palm Island | A tropical island experience just a short ferry ride from Townsville. It offers unique cultural experiences and beautiful natural landscapes, attracting adventurous travelers. | Local Indigenous Culture, Beachfront Activities, Bushwalking Trails |
| Magnetic Island | A nearby island known for its beautiful beaches and national parks. A favorite for backpackers and tourists looking for outdoor adventures, snorkeling, and beach fun. | Horseshoe Bay, Snorkeling Spots, National Park Trails, Kayaking |
| North Ward | A charming suburb close to beaches and the city, perfect for visitors looking for a quieter stay while still being near key attractions. | Queens Gardens, Flinders Street Markets, Local Dining Options |
| South Townsville | An emerging area with trendy new developments, it’s becoming popular with both tourists and locals. Close to the ferry terminal for Magnetic Island. | Ferry Terminal, Local Breweries, Restaurants, Art Galleries |
Understanding Airbnb License Requirements & STR Laws in Townsville City (2025)
While Townsville City, Queensland, Australia currently shows low STR regulations, specific Airbnb license requirements might still exist or change. Always verify the latest short term rental regulations and Airbnb license requirements directly with local government authorities for Townsville City to ensure full compliance before hosting.
(Source: AirROI data, 2025, finding no licensed listings among those analyzed)
Top Performing Airbnb Properties in Townsville City (2025)
Benchmark your potential! Explore examples of top-performing Airbnb properties in Townsville Citybased on Trailing Twelve Month (TTM) revenue. Analyze their characteristics, revenue, occupancy rate, and ADR to understand what drives success in this market.
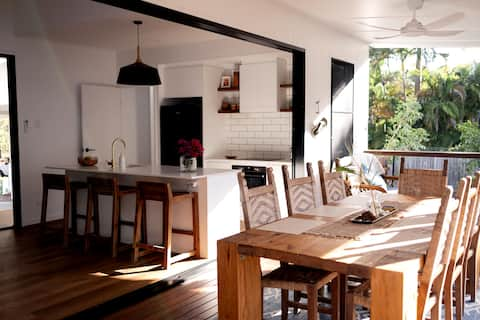
Architecturally designed retreat - Horseshoe Bay
Entire Place • 4 bedrooms
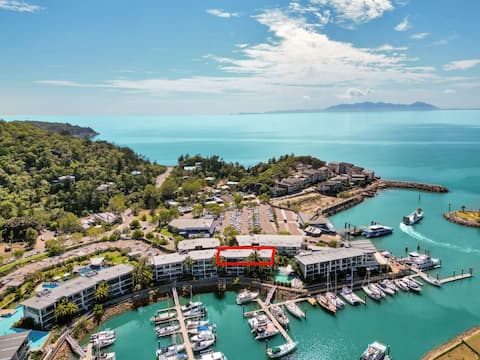
Luxury Waterfront Penthouse Blue on Blue Resort
Entire Place • 4 bedrooms
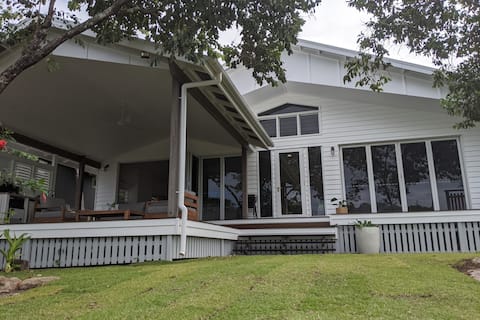
NEW Home"Reef Shack" sleep-9
Entire Place • 4 bedrooms
Paradise Beach House
Entire Place • 4 bedrooms

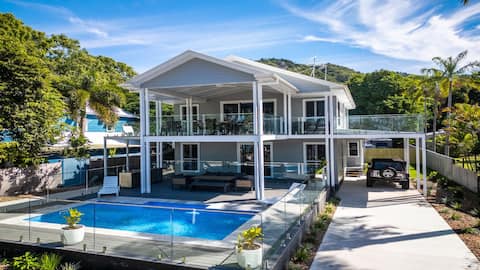
Stunning 5 Bedroom Home with Pool
Entire Place • 5 bedrooms

Absolute Beach front
Entire Place • 4 bedrooms
Note: Performance varies based on location, size, amenities, seasonality, and management quality. Data reflects the past 12 months.
Top Performing Airbnb Hosts in Townsville City (2025)
Learn from the best! This table showcases top-performing Airbnb hosts in Townsville City based on the number of properties managed and estimated total revenue over the past year. Analyze their scale and performance metrics.
| Host Name | Properties | Grossing Revenue | Stay Reviews | Avg Rating |
|---|---|---|---|---|
| Will | 122 | $2,282,232 | 708 | 2.86/5.0 |
| Compass Property | 32 | $816,563 | 1646 | 4.43/5.0 |
| Ekaterina | 3 | $170,953 | 276 | 4.90/5.0 |
| Roxanne | 9 | $167,045 | 309 | 4.86/5.0 |
| Ingenia Holidays | 5 | $120,284 | 47 | 4.53/5.0 |
| Karen | 2 | $118,843 | 25 | 2.50/5.0 |
| Richard | 1 | $100,020 | 29 | 5.00/5.0 |
| Alex | 4 | $96,990 | 95 | 3.64/5.0 |
| Lysa | 1 | $87,028 | 121 | 4.90/5.0 |
| Frankie | 2 | $81,134 | 688 | 4.88/5.0 |
Analyzing the strategies of top hosts, such as their property selection, pricing, and guest communication, can offer valuable lessons for optimizing your own Airbnb operations in Townsville City.
Dive Deeper: Advanced Townsville City STR Market Data (2025)
Ready to unlock more insights? AirROI provides access to advanced metrics and comprehensive Airbnb data for Townsville City. Explore detailed analytics beyond this report to refine your investment strategy, optimize pricing, and maximize your vacation rental profits.
Explore Advanced MetricsTownsville City Short-Term Rental Market Composition (2025): Property & Room Types
Room Type Distribution
Property Type Distribution
Market Composition Insights for Townsville City
- The Townsville City Airbnb market composition is heavily skewed towards Entire Home/Apt listings, which make up 91.4% of the 324 active rentals. This indicates strong guest preference for privacy and space.
- Looking at the property type distribution in Townsville City, House properties are the most common (45.4%), reflecting the local real estate landscape.
- Houses represent a significant 45.4% portion, catering likely to families or larger groups.
- Smaller segments like hotel/boutique, others (combined 6.8%) offer potential for unique stay experiences.
Townsville City Airbnb Room Capacity Analysis (2025): Bedroom Distribution
Distribution of Listings by Number of Bedrooms
Room Capacity Insights for Townsville City
- The dominant room capacity in Townsville City is 2 bedrooms listings, making up 33.3% of the market. This suggests a strong demand for properties suitable for couples or solo travelers.
- Together, 2 bedrooms and 3 bedrooms properties represent 61.1% of the active Airbnb listings in Townsville City, indicating a high concentration in these sizes.
- A significant 36.2% of listings offer 3+ bedrooms, catering to larger groups and families seeking more space in Townsville City.
Townsville City Vacation Rental Guest Capacity Trends (2025)
Distribution of Listings by Guest Capacity
Guest Capacity Insights for Townsville City
- The most common guest capacity trend in Townsville City vacation rentals is listings accommodating 4 guests (24.7%). This suggests the primary traveler segment is likely small families or groups.
- Properties designed for 4 guests and 6 guests dominate the Townsville City STR market, accounting for 48.8% of listings.
- 38.6% of properties accommodate 6+ guests, serving the market segment for larger families or group travel in Townsville City.
- On average, properties in Townsville City are equipped to host 4.5 guests.
Townsville City Airbnb Booking Patterns (2025): Available vs. Booked Days
Available Days Distribution
Booked Days Distribution
Booking Pattern Insights for Townsville City
- The most common availability pattern in Townsville City falls within the 271-366 days range, representing 49.4% of listings. This suggests many properties have significant open periods on their calendars.
- Approximately 78.7% of listings show high availability (181+ days open annually), indicating potential for increased bookings or specific owner usage patterns.
- For booked days, the 31-90 days range is most frequent in Townsville City (37.7%), reflecting common guest stay durations or potential owner blocking patterns.
- A notable 21.9% of properties secure long booking periods (181+ days booked per year), highlighting successful long-term rental strategies or significant owner usage.
Townsville City Airbnb Minimum Stay Requirements Analysis
Distribution of Listings by Minimum Night Requirement
1 Night
32 listings
10.4% of total
2 Nights
58 listings
18.9% of total
3 Nights
85 listings
27.7% of total
4-6 Nights
29 listings
9.4% of total
7-29 Nights
5 listings
1.6% of total
30+ Nights
98 listings
31.9% of total
Key Insights
- The most prevalent minimum stay requirement in Townsville City is 30+ Nights, adopted by 31.9% of listings. This highlights the market's preference for longer commitments.
- A significant segment (31.9%) caters to monthly stays (30+ nights) in Townsville City, pointing to opportunities in the extended-stay market.
Recommendations
- Align with the market by considering a 30+ Nights minimum stay, as 31.9% of Townsville City hosts use this setting.
- If feasible, allowing 1-night stays, especially midweek or during low season, could capture last-minute bookings, as only 10.4% currently do.
- Explore offering discounts for stays of 30+ nights to attract the 31.9% of the market seeking extended stays.
- Adjust minimum nights based on seasonality – potentially shorter during low season and longer during peak demand periods in Townsville City.
Townsville City Airbnb Cancellation Policy Trends Analysis (2025)
Super Strict 60 Days
1 listings
0.4% of total
Super Strict 30 Days
103 listings
40.1% of total
Flexible
37 listings
14.4% of total
Moderate
56 listings
21.8% of total
Firm
32 listings
12.5% of total
Strict
28 listings
10.9% of total
Cancellation Policy Insights for Townsville City
- The prevailing Airbnb cancellation policy trend in Townsville City is Super Strict 30 Days, used by 40.1% of listings.
- There's a relatively balanced mix between guest-friendly (36.2%) and stricter (23.4%) policies, offering choices for different guest needs.
Recommendations for Hosts
- Consider adopting a Super Strict 30 Days policy to align with the 40.1% market standard in Townsville City.
- Using a Strict policy might deter some guests, as only 10.9% of listings use it. Evaluate if potential revenue protection outweighs possible lower booking rates.
- Regularly review your cancellation policy against competitors and market demand shifts in Townsville City.
Townsville City STR Booking Lead Time Analysis (2025)
Average Booking Lead Time by Month
Booking Lead Time Insights for Townsville City
- The overall average booking lead time for vacation rentals in Townsville City is 74 days.
- Guests book furthest in advance for stays during July (average 122 days), likely coinciding with peak travel demand or local events.
- The shortest booking windows occur for stays in February (average 44 days), indicating more last-minute travel plans during this time.
- Seasonally, Summer (111 days avg.) sees the longest lead times, while Winter (62 days avg.) has the shortest, reflecting typical travel planning cycles.
Recommendations for Hosts
- Use the overall average lead time (74 days) as a baseline for your pricing and availability strategy in Townsville City.
- For July stays, consider implementing length-of-stay discounts or slightly higher rates for bookings made less than 122 days out to capitalize on advance planning.
- Target marketing efforts for the Summer season well in advance (at least 111 days) to capture early planners.
- Monitor your own booking lead times against these Townsville City averages to identify opportunities for dynamic pricing adjustments.
Popular & Essential Airbnb Amenities in Townsville City (2025)
Amenity Prevalence
Amenity Insights for Townsville City
- Essential amenities in Townsville City that guests expect include: Smoke alarm, Air conditioning, TV. Lacking these (any) could significantly impact bookings.
- Popular amenities like Kitchen, Washer, Free parking on premises are common but not universal. Offering these can provide a competitive edge.
Recommendations for Hosts
- Ensure your listing includes all essential amenities for Townsville City: Smoke alarm, Air conditioning, TV.
- Prioritize adding missing essentials: Smoke alarm, Air conditioning, TV.
- Consider adding popular differentiators like Kitchen or Washer to increase appeal.
- Highlight unique or less common amenities you offer (e.g., hot tub, dedicated workspace, EV charger) in your listing description and photos.
- Regularly check competitor amenities in Townsville City to stay competitive.
Townsville City Airbnb Guest Demographics & Profile Analysis (2025)
Guest Profile Summary for Townsville City
- The typical guest profile for Airbnb in Townsville City consists of primarily domestic travelers (80%), often arriving from nearby Townsville City, typically belonging to the Post-2000s (Gen Z/Alpha) group (50%), primarily speaking English or German.
- Domestic travelers account for 80.4% of guests.
- Key international markets include Australia (80.4%) and United Kingdom (5.2%).
- Top languages spoken are English (67.3%) followed by German (7.1%).
- A significant demographic segment is the Post-2000s (Gen Z/Alpha) group, representing 50% of guests.
Recommendations for Hosts
- Target domestic marketing efforts towards travelers from Townsville City and Melbourne.
- Tailor amenities and listing descriptions to appeal to the dominant Post-2000s (Gen Z/Alpha) demographic (e.g., highlight fast WiFi, smart home features, local guides).
- Highlight unique local experiences or amenities relevant to the primary guest profile.
- Consider seasonal promotions aligned with peak travel times for key origin markets.
Nearby Short-Term Rental Market Comparison
How does the Townsville City Airbnb market stack up against its neighbors? Compare key performance metrics like average monthly revenue, ADR, and occupancy rates in surrounding areas to understand the broader regional STR landscape.
| Market | Active Properties | Monthly Revenue | Daily Rate | Avg. Occupancy |
|---|---|---|---|---|
| Cardwell | 16 | $2,084 | $245.41 | 37% |
| Townsville | 472 | $2,072 | $191.74 | 49% |
| Ayr | 12 | $1,323 | $92.07 | 55% |
| Forrest Beach | 11 | $1,250 | $148.48 | 33% |