Toowoomba Regional Airbnb Market Analysis 2025: Short Term Rental Data & Vacation Rental Statistics in Queensland, Australia
Is Airbnb profitable in Toowoomba Regional in 2025? Explore comprehensive Airbnb analytics for Toowoomba Regional, Queensland, Australia to uncover income potential. This 2025 STR market report for Toowoomba Regional, based on AirROI data from April 2024 to March 2025, reveals key trends in the niche market of 78 active listings.
Whether you're considering an Airbnb investment in Toowoomba Regional, optimizing your existing vacation rental, or exploring rental arbitrage opportunities, understanding the Toowoomba Regional Airbnb data is crucial. Leveraging the low regulation environment is key to maximizing your short term rental income potential. Let's dive into the specifics.
Key Toowoomba Regional Airbnb Performance Metrics Overview
Monthly Airbnb Revenue Variations & Income Potential in Toowoomba Regional (2025)
Understanding the monthly revenue variations for Airbnb listings in Toowoomba Regional is key to maximizing your short term rental income potential. Seasonality significantly impacts earnings. Our analysis, based on data from the past 12 months, shows that the peak revenue month for STRs in Toowoomba Regional is typically June, while November often presents the lowest earnings, highlighting opportunities for strategic pricing adjustments during shoulder and low seasons. Explore the typical Airbnb income in Toowoomba Regional across different performance tiers:
- Best-in-class properties (Top 10%) achieve $5,234+ monthly, often utilizing dynamic pricing and superior guest experiences.
- Strong performing properties (Top 25%) earn $3,415 or more, indicating effective management and desirable locations/amenities.
- Typical properties (Median) generate around $2,160 per month, representing the average market performance.
- Entry-level properties (Bottom 25%) see earnings around $1,185, often with potential for optimization.
Average Monthly Airbnb Earnings Trend in Toowoomba Regional
Toowoomba Regional Airbnb Occupancy Rate Trends (2025)
Maximize your bookings by understanding the Toowoomba Regional STR occupancy trends. Seasonal demand shifts significantly influence how often properties are booked. Typically, Septembersees the highest demand (peak season occupancy), while November experiences the lowest (low season). Effective strategies, like adjusting minimum stays or offering promotions, can boost occupancy during slower periods. Here's how different property tiers perform in Toowoomba Regional:
- Best-in-class properties (Top 10%) achieve 76%+ occupancy, indicating high desirability and potentially optimized availability.
- Strong performing properties (Top 25%) maintain 58% or higher occupancy, suggesting good market fit and guest satisfaction.
- Typical properties (Median) have an occupancy rate around 35%.
- Entry-level properties (Bottom 25%) average 19% occupancy, potentially facing higher vacancy.
Average Monthly Occupancy Rate Trend in Toowoomba Regional
Average Daily Rate (ADR) Airbnb Trends in Toowoomba Regional (2025)
Effective short term rental pricing strategy in Toowoomba Regional involves understanding monthly ADR fluctuations. The Average Daily Rate (ADR) for Airbnb in Toowoomba Regional typically peaks in November and dips lowest during April. Leveraging Airbnb dynamic pricing tools or strategies based on this seasonality can significantly boost revenue. Here's a look at the typical nightly rates achieved:
- Best-in-class properties (Top 10%) command rates of $339+ per night, often due to premium features or locations.
- Strong performing properties (Top 25%) achieve nightly rates of $281 or more.
- Typical properties (Median) charge around $171 per night.
- Entry-level properties (Bottom 25%) earn around $97 per night.
Average Daily Rate (ADR) Trend by Month in Toowoomba Regional
Get Live Toowoomba Regional Market Intelligence 👇
Explore Real-time Analytics
Airbnb Seasonality Analysis & Trends in Toowoomba Regional (2025)
Peak Season (June, May, September)
- Revenue averages $3,231 per month
- Occupancy rates average 44.8%
- Daily rates average $193
Shoulder Season
- Revenue averages $2,652 per month
- Occupancy maintains around 40.4%
- Daily rates hold near $197
Low Season (January, February, November)
- Revenue drops to average $2,039 per month
- Occupancy decreases to average 33.4%
- Daily rates adjust to average $212
Seasonality Insights for Toowoomba Regional
- The Airbnb seasonality in Toowoomba Regional shows moderate seasonality with distinct peak and low periods. While the sections above show seasonal averages, it's also insightful to look at the extremes:
- During the high season, the absolute peak month showcases Toowoomba Regional's highest earning potential, with monthly revenues capable of climbing to $3,586, occupancy reaching a high of 49.1%, and ADRs peaking at $217.
- Conversely, the slowest single month of the year, typically falling within the low season, marks the market's lowest point. In this month, revenue might dip to $1,881, occupancy could drop to 28.2%, and ADRs may adjust down to $186.
- Understanding both the seasonal averages and these monthly peaks and troughs in revenue, occupancy, and ADR is crucial for maximizing your Airbnb profit potential in Toowoomba Regional.
Seasonal Strategies for Maximizing Profit
- Peak Season: Maximize revenue through premium pricing and potentially longer minimum stays. Ensure high availability.
- Low Season: Offer competitive pricing, special promotions (e.g., extended stay discounts), and flexible cancellation policies. Target off-season travelers like remote workers or budget-conscious guests.
- Shoulder Seasons: Implement dynamic pricing that balances peak and low rates. Target weekend travelers or specific events. Offer slightly more flexible terms than peak season.
- Regularly analyze your own performance against these Toowoomba Regional seasonality benchmarks and adjust your pricing and availability strategy accordingly.
Best Areas for Airbnb Investment in Toowoomba Regional (2025)
Exploring the top neighborhoods for short-term rentals in Toowoomba Regional? This section highlights key areas, outlining why they are attractive for hosts and guests, along with notable local attractions. Consider these locations based on your target guest profile and investment strategy.
| Neighborhood / Area | Why Host Here? (Target Guests & Appeal) | Key Attractions & Landmarks |
|---|---|---|
| Toowoomba City | The central business district of Toowoomba, featuring numerous shops, restaurants, and cafes. A prime location for tourists seeking convenient access to local attractions and events. | Toowoomba Carnival of Flowers, Queens Park, Toowoomba Railway Station, Grand Central Shopping Centre, Empire Theatre |
| East Toowoomba | A residential suburb known for its lovely parks, gardens, and heritage-listed buildings. Popular among families and tourists who appreciate a quieter atmosphere with access to amenities. | Queens Park Botanical Gardens, St Luke's Anglican Church, Toowoomba Grammar School, Cooby Dam, East Toowoomba Sports Club |
| South Toowoomba | Close to the city center, South Toowoomba offers a mix of residential and commercial areas. Ideal for families and tourists looking for a laid-back atmosphere while still near the action. | Cliffords Gardens Shopping Centre, Toowoomba Golf Club, University of Southern Queensland, Laurel Bank Park, Toowoomba Language Centre |
| West Toowoomba | A suburban area that provides a peaceful environment with easy access to parks and outdoor activities. Great for visitors who enjoy nature and community vibes. | North Toowoomba Park, Queens Park, Toowoomba Sports Ground, Newtown Park, Viscount Park |
| Middle Ridge | Known for its affluent community and quality housing, Middle Ridge is popular among visitors seeking tranquility and easy access to nature reserves and golf courses. | Middle Ridge Golf Club, Kearneys Spring Park, Picnic Point Lookout, The Ridge Shoppingworld, Toowoomba Regional Art Gallery |
| Darling Heights | Home to the University of Southern Queensland, this area attracts students and academics, making it a great spot for short-term rentals. | University of Southern Queensland, Darling Heights Park, Toowoomba City Botanic Gardens, Japanese Gardens at USQ, Gardens of the Toowoomba Regional Botanical Gardens |
| Cotswold Hills | A peaceful suburb on the outskirts of Toowoomba, Cotswold Hills offers spacious properties and scenic views, ideal for visitors looking for a relaxing getaway. | Cotswold Hills Golf Club, Local parks and walking trails, Toowoomba Showgrounds, Cotswold Hills Waterfall, Connells Point |
| Kearneys Spring | A family-friendly suburb with easy access to parks, schools, and shopping. Attractive to renters looking for comfort and convenience near the city. | Kearneys Spring Park, Emerald Park, Toowoomba Plaza, Local shopping centers, Nearby cafes and restaurants |
Understanding Airbnb License Requirements & STR Laws in Toowoomba Regional (2025)
While Toowoomba Regional, Queensland, Australia currently shows low STR regulations, specific Airbnb license requirements might still exist or change. Always verify the latest short term rental regulations and Airbnb license requirements directly with local government authorities for Toowoomba Regional to ensure full compliance before hosting.
(Source: AirROI data, 2025, finding no licensed listings among those analyzed)
Top Performing Airbnb Properties in Toowoomba Regional (2025)
Benchmark your potential! Explore examples of top-performing Airbnb properties in Toowoomba Regionalbased on Trailing Twelve Month (TTM) revenue. Analyze their characteristics, revenue, occupancy rate, and ADR to understand what drives success in this market.
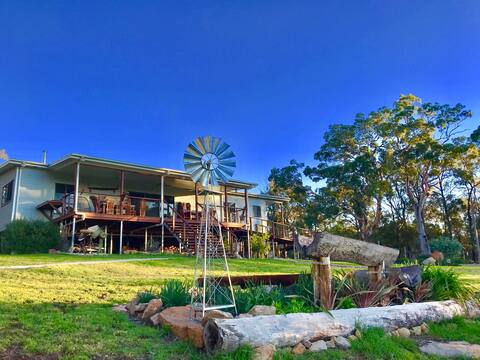
Large group & family farmstay 2 hrs from Brisbane
Entire Place • 6 bedrooms

The Quince Cottage - 3 Bedrooms
Entire Place • 3 bedrooms

Kenti's House /Luxurious Space for Families&Groups
Entire Place • 3 bedrooms

Whiptail Cottage Hirstglen, QLD
Entire Place • 3 bedrooms

Tiny Charlie
Entire Place • 1 bedroom

"Divinely Guided" - Off grid retreat style home.
Entire Place • 3 bedrooms
Note: Performance varies based on location, size, amenities, seasonality, and management quality. Data reflects the past 12 months.
Top Performing Airbnb Hosts in Toowoomba Regional (2025)
Learn from the best! This table showcases top-performing Airbnb hosts in Toowoomba Regional based on the number of properties managed and estimated total revenue over the past year. Analyze their scale and performance metrics.
| Host Name | Properties | Grossing Revenue | Stay Reviews | Avg Rating |
|---|---|---|---|---|
| Rob | 21 | $570,806 | 199 | 2.13/5.0 |
| Caroline | 3 | $106,024 | 62 | 3.32/5.0 |
| Glenaven Country Escape | 1 | $101,643 | 81 | 4.94/5.0 |
| Doyle | 4 | $81,310 | 149 | 4.97/5.0 |
| Host #255959678 | 3 | $61,534 | 3 | 0.00/5.0 |
| Into The Wild Escapes | 2 | $60,025 | 10 | 2.20/5.0 |
| Julia | 1 | $55,805 | 18 | 4.94/5.0 |
| Chris | 12 | $53,449 | 75 | 2.44/5.0 |
| Michelle | 3 | $48,625 | 7 | 3.33/5.0 |
| Inga And Marc | 1 | $41,467 | 68 | 4.91/5.0 |
Analyzing the strategies of top hosts, such as their property selection, pricing, and guest communication, can offer valuable lessons for optimizing your own Airbnb operations in Toowoomba Regional.
Dive Deeper: Advanced Toowoomba Regional STR Market Data (2025)
Ready to unlock more insights? AirROI provides access to advanced metrics and comprehensive Airbnb data for Toowoomba Regional. Explore detailed analytics beyond this report to refine your investment strategy, optimize pricing, and maximize your vacation rental profits.
Explore Advanced MetricsToowoomba Regional Short-Term Rental Market Composition (2025): Property & Room Types
Room Type Distribution
Property Type Distribution
Market Composition Insights for Toowoomba Regional
- The Toowoomba Regional Airbnb market composition is heavily skewed towards Entire Home/Apt listings, which make up 80.8% of the 78 active rentals. This indicates strong guest preference for privacy and space.
- Looking at the property type distribution in Toowoomba Regional, House properties are the most common (56.4%), reflecting the local real estate landscape.
- Houses represent a significant 56.4% portion, catering likely to families or larger groups.
- The presence of 6.4% Hotel/Boutique listings indicates integration with traditional hospitality.
- Smaller segments like others, unique stays, apartment/condo (combined 6.5%) offer potential for unique stay experiences.
Toowoomba Regional Airbnb Room Capacity Analysis (2025): Bedroom Distribution
Distribution of Listings by Number of Bedrooms
Room Capacity Insights for Toowoomba Regional
- The dominant room capacity in Toowoomba Regional is 1 bedroom listings, making up 52.6% of the market. This suggests a strong demand for properties suitable for couples or solo travelers.
- Together, 1 bedroom and 3 bedrooms properties represent 69.3% of the active Airbnb listings in Toowoomba Regional, indicating a high concentration in these sizes.
- With over half the market (52.6%) consisting of studios or 1-bedroom units, Toowoomba Regional is particularly well-suited for individuals or couples.
- A significant 27.0% of listings offer 3+ bedrooms, catering to larger groups and families seeking more space in Toowoomba Regional.
Toowoomba Regional Vacation Rental Guest Capacity Trends (2025)
Distribution of Listings by Guest Capacity
Guest Capacity Insights for Toowoomba Regional
- The most common guest capacity trend in Toowoomba Regional vacation rentals is listings accommodating 2 guests (44.9%). This suggests the primary traveler segment is likely couples or solo travelers.
- Properties designed for 2 guests and 8+ guests dominate the Toowoomba Regional STR market, accounting for 61.6% of listings.
- A significant 44.9% of listings cater specifically to 1-2 guests, highlighting strong demand from couples and solo travelers in Toowoomba Regional.
- 30.8% of properties accommodate 6+ guests, serving the market segment for larger families or group travel in Toowoomba Regional.
- On average, properties in Toowoomba Regional are equipped to host 3.9 guests.
Toowoomba Regional Airbnb Booking Patterns (2025): Available vs. Booked Days
Available Days Distribution
Booked Days Distribution
Booking Pattern Insights for Toowoomba Regional
- The most common availability pattern in Toowoomba Regional falls within the 271-366 days range, representing 44.9% of listings. This suggests many properties have significant open periods on their calendars.
- Approximately 79.5% of listings show high availability (181+ days open annually), indicating potential for increased bookings or specific owner usage patterns.
- For booked days, the 31-90 days range is most frequent in Toowoomba Regional (32.1%), reflecting common guest stay durations or potential owner blocking patterns.
- A notable 23.1% of properties secure long booking periods (181+ days booked per year), highlighting successful long-term rental strategies or significant owner usage.
Toowoomba Regional Airbnb Minimum Stay Requirements Analysis
Distribution of Listings by Minimum Night Requirement
1 Night
11 listings
14.9% of total
2 Nights
43 listings
58.1% of total
3 Nights
2 listings
2.7% of total
30+ Nights
18 listings
24.3% of total
Key Insights
- The most prevalent minimum stay requirement in Toowoomba Regional is 2 Nights, adopted by 58.1% of listings. This highlights the market's preference for shorter, flexible bookings.
- A strong majority (73.0%) of the Toowoomba Regional Airbnb data shows acceptance of very short stays (1-2 nights), indicating a dynamic, high-turnover market.
- A significant segment (24.3%) caters to monthly stays (30+ nights) in Toowoomba Regional, pointing to opportunities in the extended-stay market.
Recommendations
- Align with the market by considering a 2 Nights minimum stay, as 58.1% of Toowoomba Regional hosts use this setting.
- If feasible, allowing 1-night stays, especially midweek or during low season, could capture last-minute bookings, as only 14.9% currently do.
- A 2-night minimum appears standard (58.1%). Consider this for weekends or peak periods.
- Explore offering discounts for stays of 30+ nights to attract the 24.3% of the market seeking extended stays.
- Adjust minimum nights based on seasonality – potentially shorter during low season and longer during peak demand periods in Toowoomba Regional.
Toowoomba Regional Airbnb Cancellation Policy Trends Analysis (2025)
Super Strict 30 Days
3 listings
5.7% of total
Flexible
11 listings
20.8% of total
Moderate
22 listings
41.5% of total
Firm
8 listings
15.1% of total
Strict
9 listings
17% of total
Cancellation Policy Insights for Toowoomba Regional
- The prevailing Airbnb cancellation policy trend in Toowoomba Regional is Moderate, used by 41.5% of listings.
- There's a relatively balanced mix between guest-friendly (62.3%) and stricter (32.1%) policies, offering choices for different guest needs.
Recommendations for Hosts
- Consider adopting a Moderate policy to align with the 41.5% market standard in Toowoomba Regional.
- Regularly review your cancellation policy against competitors and market demand shifts in Toowoomba Regional.
Toowoomba Regional STR Booking Lead Time Analysis (2025)
Average Booking Lead Time by Month
Booking Lead Time Insights for Toowoomba Regional
- The overall average booking lead time for vacation rentals in Toowoomba Regional is 68 days.
- Guests book furthest in advance for stays during April (average 98 days), likely coinciding with peak travel demand or local events.
- The shortest booking windows occur for stays in August (average 44 days), indicating more last-minute travel plans during this time.
- Seasonally, Spring (78 days avg.) sees the longest lead times, while Summer (63 days avg.) has the shortest, reflecting typical travel planning cycles.
Recommendations for Hosts
- Use the overall average lead time (68 days) as a baseline for your pricing and availability strategy in Toowoomba Regional.
- For April stays, consider implementing length-of-stay discounts or slightly higher rates for bookings made less than 98 days out to capitalize on advance planning.
- Target marketing efforts for the Spring season well in advance (at least 78 days) to capture early planners.
- Monitor your own booking lead times against these Toowoomba Regional averages to identify opportunities for dynamic pricing adjustments.
Popular & Essential Airbnb Amenities in Toowoomba Regional (2025)
Amenity Prevalence
Amenity Insights for Toowoomba Regional
- Essential amenities in Toowoomba Regional that guests expect include: Hot water, Free parking on premises. Lacking these (any) could significantly impact bookings.
- Popular amenities like Heating, Smoke alarm, Essentials are common but not universal. Offering these can provide a competitive edge.
Recommendations for Hosts
- Ensure your listing includes all essential amenities for Toowoomba Regional: Hot water, Free parking on premises.
- Prioritize adding missing essentials: Hot water, Free parking on premises.
- Consider adding popular differentiators like Heating or Smoke alarm to increase appeal.
- Highlight unique or less common amenities you offer (e.g., hot tub, dedicated workspace, EV charger) in your listing description and photos.
- Regularly check competitor amenities in Toowoomba Regional to stay competitive.
Toowoomba Regional Airbnb Guest Demographics & Profile Analysis (2025)
Guest Profile Summary for Toowoomba Regional
- The typical guest profile for Airbnb in Toowoomba Regional consists of primarily domestic travelers (96%), often arriving from nearby Brisbane, typically belonging to the Post-2000s (Gen Z/Alpha) group (50%), primarily speaking English or Spanish.
- Domestic travelers account for 96.0% of guests.
- Key international markets include Australia (96%) and New Zealand (1.1%).
- Top languages spoken are English (75.5%) followed by Spanish (4.2%).
- A significant demographic segment is the Post-2000s (Gen Z/Alpha) group, representing 50% of guests.
Recommendations for Hosts
- Target domestic marketing efforts towards travelers from Brisbane and Queensland.
- Tailor amenities and listing descriptions to appeal to the dominant Post-2000s (Gen Z/Alpha) demographic (e.g., highlight fast WiFi, smart home features, local guides).
- Highlight unique local experiences or amenities relevant to the primary guest profile.
- Consider seasonal promotions aligned with peak travel times for key origin markets.
Nearby Short-Term Rental Market Comparison
How does the Toowoomba Regional Airbnb market stack up against its neighbors? Compare key performance metrics like average monthly revenue, ADR, and occupancy rates in surrounding areas to understand the broader regional STR landscape.
| Market | Active Properties | Monthly Revenue | Daily Rate | Avg. Occupancy |
|---|---|---|---|---|
| Tenterfield Shire Council | 10 | $2,863 | $188.34 | 50% |
| Somerset Regional | 54 | $2,748 | $217.48 | 43% |
| Ballandean | 22 | $2,719 | $288.70 | 34% |
| Boonah | 14 | $2,635 | $155.84 | 54% |
| Stanthorpe | 70 | $2,575 | $206.86 | 43% |
| Warwick | 28 | $2,541 | $184.46 | 53% |
| Amamoor | 12 | $2,358 | $147.43 | 48% |
| Southern Downs Regional | 91 | $2,288 | $229.21 | 40% |
| Cooroy | 16 | $2,265 | $197.32 | 49% |
| Imbil | 17 | $2,221 | $144.24 | 47% |