Toowoomba Airbnb Market Analysis 2025: Short Term Rental Data & Vacation Rental Statistics in Queensland, Australia
Is Airbnb profitable in Toowoomba in 2025? Explore comprehensive Airbnb analytics for Toowoomba, Queensland, Australia to uncover income potential. This 2025 STR market report for Toowoomba, based on AirROI data from April 2024 to March 2025, reveals key trends in the market of 279 active listings.
Whether you're considering an Airbnb investment in Toowoomba, optimizing your existing vacation rental, or exploring rental arbitrage opportunities, understanding the Toowoomba Airbnb data is crucial. Leveraging the low regulation environment is key to maximizing your short term rental income potential. Let's dive into the specifics.
Key Toowoomba Airbnb Performance Metrics Overview
Monthly Airbnb Revenue Variations & Income Potential in Toowoomba (2025)
Understanding the monthly revenue variations for Airbnb listings in Toowoomba is key to maximizing your short term rental income potential. Seasonality significantly impacts earnings. Our analysis, based on data from the past 12 months, shows that the peak revenue month for STRs in Toowoomba is typically September, while February often presents the lowest earnings, highlighting opportunities for strategic pricing adjustments during shoulder and low seasons. Explore the typical Airbnb income in Toowoomba across different performance tiers:
- Best-in-class properties (Top 10%) achieve $4,585+ monthly, often utilizing dynamic pricing and superior guest experiences.
- Strong performing properties (Top 25%) earn $3,296 or more, indicating effective management and desirable locations/amenities.
- Typical properties (Median) generate around $2,259 per month, representing the average market performance.
- Entry-level properties (Bottom 25%) see earnings around $1,367, often with potential for optimization.
Average Monthly Airbnb Earnings Trend in Toowoomba
Toowoomba Airbnb Occupancy Rate Trends (2025)
Maximize your bookings by understanding the Toowoomba STR occupancy trends. Seasonal demand shifts significantly influence how often properties are booked. Typically, Septembersees the highest demand (peak season occupancy), while March experiences the lowest (low season). Effective strategies, like adjusting minimum stays or offering promotions, can boost occupancy during slower periods. Here's how different property tiers perform in Toowoomba:
- Best-in-class properties (Top 10%) achieve 88%+ occupancy, indicating high desirability and potentially optimized availability.
- Strong performing properties (Top 25%) maintain 77% or higher occupancy, suggesting good market fit and guest satisfaction.
- Typical properties (Median) have an occupancy rate around 60%.
- Entry-level properties (Bottom 25%) average 39% occupancy, potentially facing higher vacancy.
Average Monthly Occupancy Rate Trend in Toowoomba
Average Daily Rate (ADR) Airbnb Trends in Toowoomba (2025)
Effective short term rental pricing strategy in Toowoomba involves understanding monthly ADR fluctuations. The Average Daily Rate (ADR) for Airbnb in Toowoomba typically peaks in December and dips lowest during May. Leveraging Airbnb dynamic pricing tools or strategies based on this seasonality can significantly boost revenue. Here's a look at the typical nightly rates achieved:
- Best-in-class properties (Top 10%) command rates of $212+ per night, often due to premium features or locations.
- Strong performing properties (Top 25%) achieve nightly rates of $166 or more.
- Typical properties (Median) charge around $120 per night.
- Entry-level properties (Bottom 25%) earn around $84 per night.
Average Daily Rate (ADR) Trend by Month in Toowoomba
Get Live Toowoomba Market Intelligence 👇

Explore Real-time Analytics
Airbnb Seasonality Analysis & Trends in Toowoomba (2025)
Peak Season (September, May, June)
- Revenue averages $2,962 per month
- Occupancy rates average 60.3%
- Daily rates average $130
Shoulder Season
- Revenue averages $2,580 per month
- Occupancy maintains around 58.2%
- Daily rates hold near $132
Low Season (January, February, March)
- Revenue drops to average $2,035 per month
- Occupancy decreases to average 51.3%
- Daily rates adjust to average $137
Seasonality Insights for Toowoomba
- The Airbnb seasonality in Toowoomba shows moderate seasonality with distinct peak and low periods. While the sections above show seasonal averages, it's also insightful to look at the extremes:
- During the high season, the absolute peak month showcases Toowoomba's highest earning potential, with monthly revenues capable of climbing to $3,129, occupancy reaching a high of 67.0%, and ADRs peaking at $147.
- Conversely, the slowest single month of the year, typically falling within the low season, marks the market's lowest point. In this month, revenue might dip to $1,854, occupancy could drop to 50.7%, and ADRs may adjust down to $124.
- Understanding both the seasonal averages and these monthly peaks and troughs in revenue, occupancy, and ADR is crucial for maximizing your Airbnb profit potential in Toowoomba.
Seasonal Strategies for Maximizing Profit
- Peak Season: Maximize revenue through premium pricing and potentially longer minimum stays. Ensure high availability.
- Low Season: Offer competitive pricing, special promotions (e.g., extended stay discounts), and flexible cancellation policies. Target off-season travelers like remote workers or budget-conscious guests.
- Shoulder Seasons: Implement dynamic pricing that balances peak and low rates. Target weekend travelers or specific events. Offer slightly more flexible terms than peak season.
- Regularly analyze your own performance against these Toowoomba seasonality benchmarks and adjust your pricing and availability strategy accordingly.
Best Areas for Airbnb Investment in Toowoomba (2025)
Exploring the top neighborhoods for short-term rentals in Toowoomba? This section highlights key areas, outlining why they are attractive for hosts and guests, along with notable local attractions. Consider these locations based on your target guest profile and investment strategy.
| Neighborhood / Area | Why Host Here? (Target Guests & Appeal) | Key Attractions & Landmarks |
|---|---|---|
| East Toowoomba | A desirable suburb known for its leafy streets, quaint cafes, and family-friendly atmosphere. It's close to parks and gardens, making it popular with both families and professionals. | Toowoomba Botanic Gardens, Queens Park, East Creek Park, Cafe by the Creek, Clifford Park, East Toowoomba Primary School |
| South Toowoomba | Characterized by its community feel and proximity to major amenities. It's an affordable area that attracts a mix of long-term residents and short-term guests. | Toowoomba Golf Club, South Toowoomba Park, Grand Central Shopping Centre, Toowoomba Showgrounds, St Joseph's Cathedral |
| North Toowoomba | Known for its historical charm and proximity to the CBD. This area offers attractive housing options and is popular among travelers looking for a quiet yet convenient base. | Toowoomba City Centre, Toowoomba Historical Society Museum, The Empire Theatre, Walnut Cottage, Toowoomba Regional Art Gallery |
| Toowoomba CBD | The heart of the city, bustling with activity, shops, and dining options. Ideal for business travelers and those who want to be in the center of action during events and festivals. | Grand Central Shopping Centre, Toowoomba Town Hall, Emporium Theatre, Toowoomba Carnival of Flowers Central Hub, Queens Park |
| Rangeville | A family orientated area with beautiful views and access to the famous Picnic Point Park. It's popular with tourists looking for nature and relaxation close to the city. | Picnic Point Lookout, Toowoomba Regional Botanic Gardens, Lake Annand, Rangeville State School, Waterbird Habitat |
| Kearneys Spring | A growing suburb with a mix of residential and commercial spaces, recently attracting more visitors due to new developments and amenities. | Toowoomba Plaza, Botanic Gardens at Queens Park, Kearneys Spring Park, Southern Queensland Institute of TAFE, Highfields Cultural Centre |
| West Toowoomba | Expanding suburb that is known for its quiet living and proximity to the city. It appeals to families and those looking for a community feel. | West Toowoomba Park, Toowoomba Racecourse, Dhimurru Aboriginal Corporation, Toowoomba West Special School, Wilsonton Shopping Centre |
| Mount Lofty | A scenic suburb featuring panoramic views and easy access to top-rated schools and parks. It's attractive for both families and tourists looking for peace and nature. | Mount Lofty Botanic Gardens, Jim McDonald Park, Sir Leslie Wilson Park, Mt Lofty Pilots Memorial, Toowoomba Water Park |
Understanding Airbnb License Requirements & STR Laws in Toowoomba (2025)
While Toowoomba, Queensland, Australia currently shows low STR regulations, specific Airbnb license requirements might still exist or change. Always verify the latest short term rental regulations and Airbnb license requirements directly with local government authorities for Toowoomba to ensure full compliance before hosting.
(Source: AirROI data, 2025, finding no licensed listings among those analyzed)
Top Performing Airbnb Properties in Toowoomba (2025)
Benchmark your potential! Explore examples of top-performing Airbnb properties in Toowoombabased on Trailing Twelve Month (TTM) revenue. Analyze their characteristics, revenue, occupancy rate, and ADR to understand what drives success in this market.
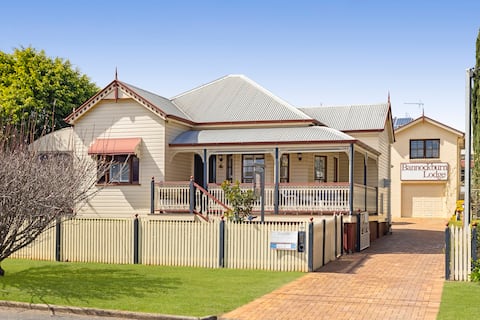
Two houses one location, sleeps 14, Toowoomba CBD.
Entire Place • 7 bedrooms
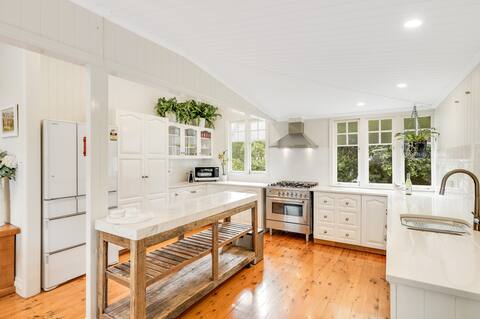
Historic Charm & Elegance, Near Grammar!
Entire Place • 5 bedrooms

Luxury Estate set over 2 acres w/ Tennis Court
Entire Place • 6 bedrooms

Toowoomba CBD, sleeps 8, opposite Queens Park.
Entire Place • 4 bedrooms
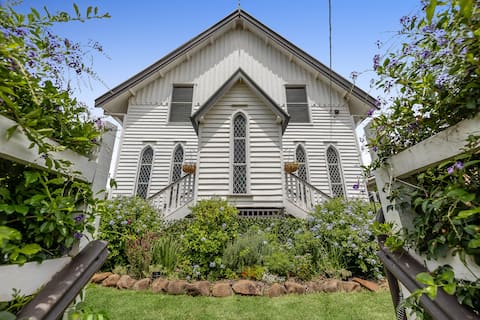
The Church Guesthouse
Entire Place • 5 bedrooms
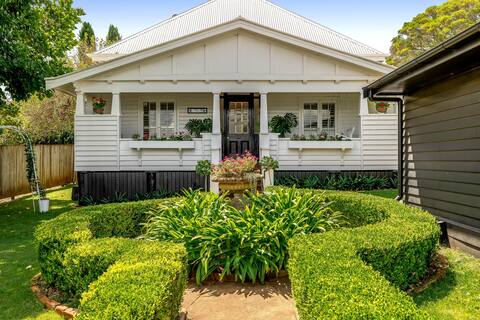
Charming Lou Lou
Entire Place • 4 bedrooms
Note: Performance varies based on location, size, amenities, seasonality, and management quality. Data reflects the past 12 months.
Top Performing Airbnb Hosts in Toowoomba (2025)
Learn from the best! This table showcases top-performing Airbnb hosts in Toowoomba based on the number of properties managed and estimated total revenue over the past year. Analyze their scale and performance metrics.
| Host Name | Properties | Grossing Revenue | Stay Reviews | Avg Rating |
|---|---|---|---|---|
| ShortStay Toowoomba | 34 | $751,236 | 1606 | 4.61/5.0 |
| Katie | 14 | $732,711 | 1106 | 4.90/5.0 |
| Mick | 15 | $607,779 | 1207 | 4.94/5.0 |
| Rikki | 14 | $369,357 | 480 | 4.73/5.0 |
| Acebnb | 8 | $296,059 | 1317 | 4.85/5.0 |
| Jess | 3 | $261,542 | 442 | 4.93/5.0 |
| Rachel | 6 | $150,732 | 658 | 4.89/5.0 |
| Toowoomba Central | 4 | $112,961 | 44 | 4.34/5.0 |
| Toni | 3 | $96,999 | 234 | 4.80/5.0 |
| Angela | 2 | $95,833 | 726 | 4.95/5.0 |
Analyzing the strategies of top hosts, such as their property selection, pricing, and guest communication, can offer valuable lessons for optimizing your own Airbnb operations in Toowoomba.
Dive Deeper: Advanced Toowoomba STR Market Data (2025)
Ready to unlock more insights? AirROI provides access to advanced metrics and comprehensive Airbnb data for Toowoomba. Explore detailed analytics beyond this report to refine your investment strategy, optimize pricing, and maximize your vacation rental profits.
Explore Advanced MetricsToowoomba Short-Term Rental Market Composition (2025): Property & Room Types
Room Type Distribution
Property Type Distribution
Market Composition Insights for Toowoomba
- The Toowoomba Airbnb market composition is heavily skewed towards Entire Home/Apt listings, which make up 89.2% of the 279 active rentals. This indicates strong guest preference for privacy and space.
- Looking at the property type distribution in Toowoomba, House properties are the most common (52.3%), reflecting the local real estate landscape.
- Houses represent a significant 52.3% portion, catering likely to families or larger groups.
- The presence of 9.7% Hotel/Boutique listings indicates integration with traditional hospitality.
- Smaller segments like outdoor/unique (combined 1.4%) offer potential for unique stay experiences.
Toowoomba Airbnb Room Capacity Analysis (2025): Bedroom Distribution
Distribution of Listings by Number of Bedrooms
Room Capacity Insights for Toowoomba
- The dominant room capacity in Toowoomba is 3 bedrooms listings, making up 31.9% of the market. This suggests a strong demand for properties suitable for families or small groups.
- Together, 3 bedrooms and 2 bedrooms properties represent 57.0% of the active Airbnb listings in Toowoomba, indicating a high concentration in these sizes.
- A significant 44.1% of listings offer 3+ bedrooms, catering to larger groups and families seeking more space in Toowoomba.
Toowoomba Vacation Rental Guest Capacity Trends (2025)
Distribution of Listings by Guest Capacity
Guest Capacity Insights for Toowoomba
- The most common guest capacity trend in Toowoomba vacation rentals is listings accommodating 6 guests (27.6%). This suggests the primary traveler segment is likely larger groups.
- Properties designed for 6 guests and 2 guests dominate the Toowoomba STR market, accounting for 49.5% of listings.
- 41.6% of properties accommodate 6+ guests, serving the market segment for larger families or group travel in Toowoomba.
- On average, properties in Toowoomba are equipped to host 4.4 guests.
Toowoomba Airbnb Booking Patterns (2025): Available vs. Booked Days
Available Days Distribution
Booked Days Distribution
Booking Pattern Insights for Toowoomba
- The most common availability pattern in Toowoomba falls within the 91-180 days range, representing 47% of listings. This suggests many properties have significant open periods on their calendars.
- Approximately 36.6% of listings show high availability (181+ days open annually), indicating potential for increased bookings or specific owner usage patterns.
- For booked days, the 181-270 days range is most frequent in Toowoomba (46.2%), reflecting common guest stay durations or potential owner blocking patterns.
- A notable 64.8% of properties secure long booking periods (181+ days booked per year), highlighting successful long-term rental strategies or significant owner usage.
Toowoomba Airbnb Minimum Stay Requirements Analysis
Distribution of Listings by Minimum Night Requirement
1 Night
60 listings
22.5% of total
2 Nights
99 listings
37.1% of total
3 Nights
43 listings
16.1% of total
4-6 Nights
13 listings
4.9% of total
7-29 Nights
5 listings
1.9% of total
30+ Nights
47 listings
17.6% of total
Key Insights
- The most prevalent minimum stay requirement in Toowoomba is 2 Nights, adopted by 37.1% of listings. This highlights the market's preference for shorter, flexible bookings.
- A significant segment (17.6%) caters to monthly stays (30+ nights) in Toowoomba, pointing to opportunities in the extended-stay market.
Recommendations
- Align with the market by considering a 2 Nights minimum stay, as 37.1% of Toowoomba hosts use this setting.
- If feasible, allowing 1-night stays, especially midweek or during low season, could capture last-minute bookings, as only 22.5% currently do.
- Explore offering discounts for stays of 30+ nights to attract the 17.6% of the market seeking extended stays.
- Adjust minimum nights based on seasonality – potentially shorter during low season and longer during peak demand periods in Toowoomba.
Toowoomba Airbnb Cancellation Policy Trends Analysis (2025)
Super Strict 30 Days
1 listings
0.4% of total
Flexible
89 listings
33% of total
Moderate
132 listings
48.9% of total
Firm
28 listings
10.4% of total
Strict
20 listings
7.4% of total
Cancellation Policy Insights for Toowoomba
- The prevailing Airbnb cancellation policy trend in Toowoomba is Moderate, used by 48.9% of listings.
- The market strongly favors guest-friendly terms, with 81.9% of listings offering Flexible or Moderate policies. This suggests guests in Toowoomba may expect booking flexibility.
- Strict cancellation policies are quite rare (7.4%), potentially making listings with this policy less competitive unless justified by high demand or property type.
Recommendations for Hosts
- Consider adopting a Moderate policy to align with the 48.9% market standard in Toowoomba.
- Using a Strict policy might deter some guests, as only 7.4% of listings use it. Evaluate if potential revenue protection outweighs possible lower booking rates.
- Regularly review your cancellation policy against competitors and market demand shifts in Toowoomba.
Toowoomba STR Booking Lead Time Analysis (2025)
Average Booking Lead Time by Month
Booking Lead Time Insights for Toowoomba
- The overall average booking lead time for vacation rentals in Toowoomba is 51 days.
- Guests book furthest in advance for stays during September (average 73 days), likely coinciding with peak travel demand or local events.
- The shortest booking windows occur for stays in February (average 38 days), indicating more last-minute travel plans during this time.
- Seasonally, Fall (62 days avg.) sees the longest lead times, while Winter (45 days avg.) has the shortest, reflecting typical travel planning cycles.
Recommendations for Hosts
- Use the overall average lead time (51 days) as a baseline for your pricing and availability strategy in Toowoomba.
- For September stays, consider implementing length-of-stay discounts or slightly higher rates for bookings made less than 73 days out to capitalize on advance planning.
- Target marketing efforts for the Fall season well in advance (at least 62 days) to capture early planners.
- Monitor your own booking lead times against these Toowoomba averages to identify opportunities for dynamic pricing adjustments.
Popular & Essential Airbnb Amenities in Toowoomba (2025)
Amenity Prevalence
Amenity Insights for Toowoomba
- Essential amenities in Toowoomba that guests expect include: Smoke alarm, TV, Wifi. Lacking these (any) could significantly impact bookings.
- Popular amenities like Heating, Kitchen, Dishes and silverware are common but not universal. Offering these can provide a competitive edge.
Recommendations for Hosts
- Ensure your listing includes all essential amenities for Toowoomba: Smoke alarm, TV, Wifi.
- Prioritize adding missing essentials: Smoke alarm, TV, Wifi.
- Consider adding popular differentiators like Heating or Kitchen to increase appeal.
- Highlight unique or less common amenities you offer (e.g., hot tub, dedicated workspace, EV charger) in your listing description and photos.
- Regularly check competitor amenities in Toowoomba to stay competitive.
Toowoomba Airbnb Guest Demographics & Profile Analysis (2025)
Guest Profile Summary for Toowoomba
- The typical guest profile for Airbnb in Toowoomba consists of primarily domestic travelers (95%), often arriving from nearby Brisbane, typically belonging to the Post-2000s (Gen Z/Alpha) group (50%), primarily speaking English or Chinese.
- Domestic travelers account for 95.4% of guests.
- Key international markets include Australia (95.4%) and New Zealand (1.3%).
- Top languages spoken are English (81.4%) followed by Chinese (2.6%).
- A significant demographic segment is the Post-2000s (Gen Z/Alpha) group, representing 50% of guests.
Recommendations for Hosts
- Target domestic marketing efforts towards travelers from Brisbane and Queensland.
- Tailor amenities and listing descriptions to appeal to the dominant Post-2000s (Gen Z/Alpha) demographic (e.g., highlight fast WiFi, smart home features, local guides).
- Highlight unique local experiences or amenities relevant to the primary guest profile.
- Consider seasonal promotions aligned with peak travel times for key origin markets.
Nearby Short-Term Rental Market Comparison
How does the Toowoomba Airbnb market stack up against its neighbors? Compare key performance metrics like average monthly revenue, ADR, and occupancy rates in surrounding areas to understand the broader regional STR landscape.
| Market | Active Properties | Monthly Revenue | Daily Rate | Avg. Occupancy |
|---|---|---|---|---|
| Tenterfield Shire Council | 10 | $2,863 | $188.34 | 50% |
| Somerset Regional | 54 | $2,748 | $217.48 | 43% |
| Ballandean | 22 | $2,719 | $288.70 | 34% |
| Boonah | 14 | $2,635 | $155.84 | 54% |
| Stanthorpe | 70 | $2,575 | $206.86 | 43% |
| Warwick | 28 | $2,541 | $184.46 | 53% |
| Amamoor | 12 | $2,358 | $147.43 | 48% |
| Southern Downs Regional | 91 | $2,288 | $229.21 | 40% |
| Cooroy | 16 | $2,265 | $197.32 | 49% |
| Imbil | 17 | $2,221 | $144.24 | 47% |