Tablelands Regional Airbnb Market Analysis 2025: Short Term Rental Data & Vacation Rental Statistics in Queensland, Australia
Is Airbnb profitable in Tablelands Regional in 2025? Explore comprehensive Airbnb analytics for Tablelands Regional, Queensland, Australia to uncover income potential. This 2025 STR market report for Tablelands Regional, based on AirROI data from April 2024 to March 2025, reveals key trends in the niche market of 50 active listings.
Whether you're considering an Airbnb investment in Tablelands Regional, optimizing your existing vacation rental, or exploring rental arbitrage opportunities, understanding the Tablelands Regional Airbnb data is crucial. Leveraging the low regulation environment is key to maximizing your short term rental income potential. Let's dive into the specifics.
Key Tablelands Regional Airbnb Performance Metrics Overview
Monthly Airbnb Revenue Variations & Income Potential in Tablelands Regional (2025)
Understanding the monthly revenue variations for Airbnb listings in Tablelands Regional is key to maximizing your short term rental income potential. Seasonality significantly impacts earnings. Our analysis, based on data from the past 12 months, shows that the peak revenue month for STRs in Tablelands Regional is typically June, while March often presents the lowest earnings, highlighting opportunities for strategic pricing adjustments during shoulder and low seasons. Explore the typical Airbnb income in Tablelands Regional across different performance tiers:
- Best-in-class properties (Top 10%) achieve $7,795+ monthly, often utilizing dynamic pricing and superior guest experiences.
- Strong performing properties (Top 25%) earn $4,302 or more, indicating effective management and desirable locations/amenities.
- Typical properties (Median) generate around $2,278 per month, representing the average market performance.
- Entry-level properties (Bottom 25%) see earnings around $1,266, often with potential for optimization.
Average Monthly Airbnb Earnings Trend in Tablelands Regional
Tablelands Regional Airbnb Occupancy Rate Trends (2025)
Maximize your bookings by understanding the Tablelands Regional STR occupancy trends. Seasonal demand shifts significantly influence how often properties are booked. Typically, Julysees the highest demand (peak season occupancy), while March experiences the lowest (low season). Effective strategies, like adjusting minimum stays or offering promotions, can boost occupancy during slower periods. Here's how different property tiers perform in Tablelands Regional:
- Best-in-class properties (Top 10%) achieve 86%+ occupancy, indicating high desirability and potentially optimized availability.
- Strong performing properties (Top 25%) maintain 71% or higher occupancy, suggesting good market fit and guest satisfaction.
- Typical properties (Median) have an occupancy rate around 48%.
- Entry-level properties (Bottom 25%) average 23% occupancy, potentially facing higher vacancy.
Average Monthly Occupancy Rate Trend in Tablelands Regional
Average Daily Rate (ADR) Airbnb Trends in Tablelands Regional (2025)
Effective short term rental pricing strategy in Tablelands Regional involves understanding monthly ADR fluctuations. The Average Daily Rate (ADR) for Airbnb in Tablelands Regional typically peaks in July and dips lowest during March. Leveraging Airbnb dynamic pricing tools or strategies based on this seasonality can significantly boost revenue. Here's a look at the typical nightly rates achieved:
- Best-in-class properties (Top 10%) command rates of $438+ per night, often due to premium features or locations.
- Strong performing properties (Top 25%) achieve nightly rates of $297 or more.
- Typical properties (Median) charge around $164 per night.
- Entry-level properties (Bottom 25%) earn around $97 per night.
Average Daily Rate (ADR) Trend by Month in Tablelands Regional
Get Live Tablelands Regional Market Intelligence 👇

Explore Real-time Analytics
Airbnb Seasonality Analysis & Trends in Tablelands Regional (2025)
Peak Season (June, April, December)
- Revenue averages $3,994 per month
- Occupancy rates average 48.7%
- Daily rates average $229
Shoulder Season
- Revenue averages $3,517 per month
- Occupancy maintains around 52.3%
- Daily rates hold near $230
Low Season (February, March, November)
- Revenue drops to average $2,558 per month
- Occupancy decreases to average 41.1%
- Daily rates adjust to average $215
Seasonality Insights for Tablelands Regional
- The Airbnb seasonality in Tablelands Regional shows moderate seasonality with distinct peak and low periods. While the sections above show seasonal averages, it's also insightful to look at the extremes:
- During the high season, the absolute peak month showcases Tablelands Regional's highest earning potential, with monthly revenues capable of climbing to $4,092, occupancy reaching a high of 59.3%, and ADRs peaking at $233.
- Conversely, the slowest single month of the year, typically falling within the low season, marks the market's lowest point. In this month, revenue might dip to $2,159, occupancy could drop to 34.6%, and ADRs may adjust down to $211.
- Understanding both the seasonal averages and these monthly peaks and troughs in revenue, occupancy, and ADR is crucial for maximizing your Airbnb profit potential in Tablelands Regional.
Seasonal Strategies for Maximizing Profit
- Peak Season: Maximize revenue through premium pricing and potentially longer minimum stays. Ensure high availability.
- Low Season: Offer competitive pricing, special promotions (e.g., extended stay discounts), and flexible cancellation policies. Target off-season travelers like remote workers or budget-conscious guests.
- Shoulder Seasons: Implement dynamic pricing that balances peak and low rates. Target weekend travelers or specific events. Offer slightly more flexible terms than peak season.
- Regularly analyze your own performance against these Tablelands Regional seasonality benchmarks and adjust your pricing and availability strategy accordingly.
Best Areas for Airbnb Investment in Tablelands Regional (2025)
Exploring the top neighborhoods for short-term rentals in Tablelands Regional? This section highlights key areas, outlining why they are attractive for hosts and guests, along with notable local attractions. Consider these locations based on your target guest profile and investment strategy.
| Neighborhood / Area | Why Host Here? (Target Guests & Appeal) | Key Attractions & Landmarks |
|---|---|---|
| Atherton | A charming tableland town known for its stunning scenery, waterfalls, and tropical climate. Attracts nature lovers, families, and those seeking a peaceful retreat. | Curtain Fig Tree, Crystal Cascades, Atherton Tablelands, Lake Tinaroo, Platypus Park |
| Yungaburra | A quaint village with a strong arts community, Yungaburra is known for its historic buildings and proximity to natural attractions. It's a favorite among tourists looking for a unique experience. | Yungaburra Markets, Lake Tinaroo, Curtain Fig Tree, Platypus Viewing Area, Mount Hypipamee National Park |
| Malanda | Famous for its dairy farming, Malanda also boasts beautiful waterfalls and a rich natural environment, making it appealing for visitors seeking local culture and farming experiences. | Malanda Falls, Malanda Dairy Centre, Mamu Rainforest Canopy Walkway, Mount Bartle Frere, Millaa Millaa Falls |
| Ravenshoe | Highest town in Queensland with a cool climate, Ravenshoe is ideal for those attracted to outdoor and eco-tourism activities, including hiking and bird watching. | Ravenshoe Heritage Centre, Windy Hill Wind Farm, Daniel's Lookout, The Big Mill, Murray Falls |
| Kairi | Known for its peaceful lake and picnic spots, Kairi is a small town perfect for visitors looking for relaxation and outdoor leisure activities. | Lake Kairi, Kairi Waterfall, Picnic areas, Walking trails, Local markets |
| Mt. Garnet | A small rural town with historical significance, Mt. Garnet is a base for adventurous travelers exploring the surrounding bushland and mining heritage. | Mt. Garnet Historic Cemetery, Mining relics, Bushwalking trails, Local fishing spots, Historic mining town tours |
| Herberton | Rich in history, Herberton features heritage-listed buildings and serves as a gateway to the Tablelands historic experiences. | Herberton Historic Village, Herberton Railway Station, Curtain Fig Tree, Local museums, Heritage walking trail |
| Tinaroo | Located near Lake Tinaroo, this area offers stunning recreational opportunities and is perfect for water sports enthusiasts and nature lovers. | Lake Tinaroo, Camping areas, Fishing spots, Water sports activities, Scenic views |
Understanding Airbnb License Requirements & STR Laws in Tablelands Regional (2025)
While Tablelands Regional, Queensland, Australia currently shows low STR regulations, specific Airbnb license requirements might still exist or change. Always verify the latest short term rental regulations and Airbnb license requirements directly with local government authorities for Tablelands Regional to ensure full compliance before hosting.
(Source: AirROI data, 2025, finding no licensed listings among those analyzed)
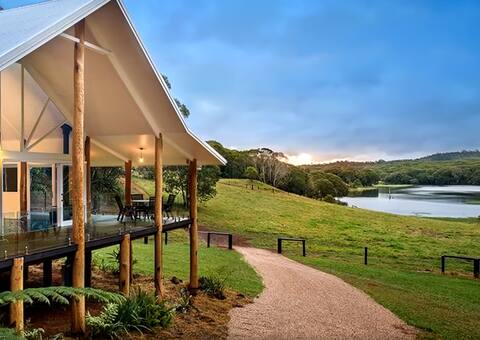
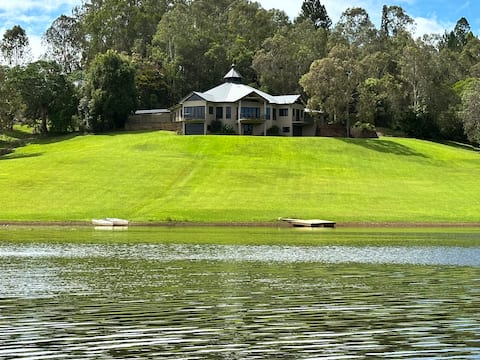
Top Performing Airbnb Properties in Tablelands Regional (2025)
Benchmark your potential! Explore examples of top-performing Airbnb properties in Tablelands Regionalbased on Trailing Twelve Month (TTM) revenue. Analyze their characteristics, revenue, occupancy rate, and ADR to understand what drives success in this market.

MainRidge on Lake Tinaroo
Entire Place • 7 bedrooms

Tuscany on Tinaroo - Lakeside Luxury
Entire Place • 5 bedrooms
The Lake House , Watermark Estate Lake Tinaroo.
Entire Place • 4 bedrooms

The Bower house in the trees with sweeping views
Private Room • 3 bedrooms

Tinaroo Lakefront Homestead
Entire Place • 4 bedrooms
Serenity Retreat, The Lakehouse, Lake Tinaroo
Entire Place • 7 bedrooms
Note: Performance varies based on location, size, amenities, seasonality, and management quality. Data reflects the past 12 months.
Top Performing Airbnb Hosts in Tablelands Regional (2025)
Learn from the best! This table showcases top-performing Airbnb hosts in Tablelands Regional based on the number of properties managed and estimated total revenue over the past year. Analyze their scale and performance metrics.
| Host Name | Properties | Grossing Revenue | Stay Reviews | Avg Rating |
|---|---|---|---|---|
| The Canopy | 3 | $211,274 | 144 | 4.68/5.0 |
| Amber | 1 | $156,255 | 15 | 5.00/5.0 |
| Nikki | 1 | $108,876 | 46 | 4.80/5.0 |
| Ralph | 1 | $94,524 | 35 | 4.94/5.0 |
| Bobbie-Lee | 1 | $83,792 | 96 | 4.95/5.0 |
| Rose Gums Wilderness Retreat | 4 | $77,646 | 72 | 3.59/5.0 |
| Suki | 1 | $75,979 | 6 | 5.00/5.0 |
| Keryn | 1 | $72,836 | 16 | 4.94/5.0 |
| Inge | 2 | $58,301 | 251 | 4.90/5.0 |
| Amanda | 1 | $54,100 | 155 | 4.98/5.0 |
Analyzing the strategies of top hosts, such as their property selection, pricing, and guest communication, can offer valuable lessons for optimizing your own Airbnb operations in Tablelands Regional.
Dive Deeper: Advanced Tablelands Regional STR Market Data (2025)
Ready to unlock more insights? AirROI provides access to advanced metrics and comprehensive Airbnb data for Tablelands Regional. Explore detailed analytics beyond this report to refine your investment strategy, optimize pricing, and maximize your vacation rental profits.
Explore Advanced MetricsTablelands Regional Short-Term Rental Market Composition (2025): Property & Room Types
Room Type Distribution
Property Type Distribution
Market Composition Insights for Tablelands Regional
- The Tablelands Regional Airbnb market composition is heavily skewed towards Entire Home/Apt listings, which make up 90% of the 50 active rentals. This indicates strong guest preference for privacy and space.
- Looking at the property type distribution in Tablelands Regional, House properties are the most common (42%), reflecting the local real estate landscape.
- Houses represent a significant 42% portion, catering likely to families or larger groups.
- The presence of 16% Hotel/Boutique listings indicates integration with traditional hospitality.
- Smaller segments like unique stays (combined 4.0%) offer potential for unique stay experiences.
Tablelands Regional Airbnb Room Capacity Analysis (2025): Bedroom Distribution
Distribution of Listings by Number of Bedrooms
Room Capacity Insights for Tablelands Regional
- The dominant room capacity in Tablelands Regional is 1 bedroom listings, making up 40% of the market. This suggests a strong demand for properties suitable for couples or solo travelers.
- Together, 1 bedroom and 2 bedrooms properties represent 66.0% of the active Airbnb listings in Tablelands Regional, indicating a high concentration in these sizes.
- A significant 28.0% of listings offer 3+ bedrooms, catering to larger groups and families seeking more space in Tablelands Regional.
Tablelands Regional Vacation Rental Guest Capacity Trends (2025)
Distribution of Listings by Guest Capacity
Guest Capacity Insights for Tablelands Regional
- The most common guest capacity trend in Tablelands Regional vacation rentals is listings accommodating 2 guests (34%). This suggests the primary traveler segment is likely couples or solo travelers.
- Properties designed for 2 guests and 4 guests dominate the Tablelands Regional STR market, accounting for 54.0% of listings.
- 32.0% of properties accommodate 6+ guests, serving the market segment for larger families or group travel in Tablelands Regional.
- On average, properties in Tablelands Regional are equipped to host 4.1 guests.
Tablelands Regional Airbnb Booking Patterns (2025): Available vs. Booked Days
Available Days Distribution
Booked Days Distribution
Booking Pattern Insights for Tablelands Regional
- The most common availability pattern in Tablelands Regional falls within the 271-366 days range, representing 36% of listings. This suggests many properties have significant open periods on their calendars.
- Approximately 54.0% of listings show high availability (181+ days open annually), indicating potential for increased bookings or specific owner usage patterns.
- For booked days, the 181-270 days range is most frequent in Tablelands Regional (36%), reflecting common guest stay durations or potential owner blocking patterns.
- A notable 46.0% of properties secure long booking periods (181+ days booked per year), highlighting successful long-term rental strategies or significant owner usage.
Tablelands Regional Airbnb Minimum Stay Requirements Analysis
Distribution of Listings by Minimum Night Requirement
1 Night
6 listings
13% of total
2 Nights
27 listings
58.7% of total
3 Nights
6 listings
13% of total
4-6 Nights
1 listings
2.2% of total
30+ Nights
6 listings
13% of total
Key Insights
- The most prevalent minimum stay requirement in Tablelands Regional is 2 Nights, adopted by 58.7% of listings. This highlights the market's preference for shorter, flexible bookings.
- A strong majority (71.7%) of the Tablelands Regional Airbnb data shows acceptance of very short stays (1-2 nights), indicating a dynamic, high-turnover market.
- A significant segment (13%) caters to monthly stays (30+ nights) in Tablelands Regional, pointing to opportunities in the extended-stay market.
Recommendations
- Align with the market by considering a 2 Nights minimum stay, as 58.7% of Tablelands Regional hosts use this setting.
- If feasible, allowing 1-night stays, especially midweek or during low season, could capture last-minute bookings, as only 13% currently do.
- A 2-night minimum appears standard (58.7%). Consider this for weekends or peak periods.
- Explore offering discounts for stays of 30+ nights to attract the 13% of the market seeking extended stays.
- Adjust minimum nights based on seasonality – potentially shorter during low season and longer during peak demand periods in Tablelands Regional.
Tablelands Regional Airbnb Cancellation Policy Trends Analysis (2025)
Super Strict 30 Days
1 listings
2.2% of total
Flexible
13 listings
28.9% of total
Moderate
17 listings
37.8% of total
Firm
4 listings
8.9% of total
Strict
10 listings
22.2% of total
Cancellation Policy Insights for Tablelands Regional
- The prevailing Airbnb cancellation policy trend in Tablelands Regional is Moderate, used by 37.8% of listings.
- There's a relatively balanced mix between guest-friendly (66.7%) and stricter (31.1%) policies, offering choices for different guest needs.
Recommendations for Hosts
- Consider adopting a Moderate policy to align with the 37.8% market standard in Tablelands Regional.
- Regularly review your cancellation policy against competitors and market demand shifts in Tablelands Regional.
Tablelands Regional STR Booking Lead Time Analysis (2025)
Average Booking Lead Time by Month
Booking Lead Time Insights for Tablelands Regional
- The overall average booking lead time for vacation rentals in Tablelands Regional is 55 days.
- Guests book furthest in advance for stays during October (average 67 days), likely coinciding with peak travel demand or local events.
- The shortest booking windows occur for stays in March (average 38 days), indicating more last-minute travel plans during this time.
- Seasonally, Fall (60 days avg.) sees the longest lead times, while Winter (52 days avg.) has the shortest, reflecting typical travel planning cycles.
Recommendations for Hosts
- Use the overall average lead time (55 days) as a baseline for your pricing and availability strategy in Tablelands Regional.
- For October stays, consider implementing length-of-stay discounts or slightly higher rates for bookings made less than 67 days out to capitalize on advance planning.
- Target marketing efforts for the Fall season well in advance (at least 60 days) to capture early planners.
- Monitor your own booking lead times against these Tablelands Regional averages to identify opportunities for dynamic pricing adjustments.
Popular & Essential Airbnb Amenities in Tablelands Regional (2025)
Amenity Prevalence
Amenity Insights for Tablelands Regional
- Popular amenities like Free parking on premises, Kitchen, Hot water are common but not universal. Offering these can provide a competitive edge.
Recommendations for Hosts
- Consider adding popular differentiators like Free parking on premises or Kitchen to increase appeal.
- Highlight unique or less common amenities you offer (e.g., hot tub, dedicated workspace, EV charger) in your listing description and photos.
- Regularly check competitor amenities in Tablelands Regional to stay competitive.
Tablelands Regional Airbnb Guest Demographics & Profile Analysis (2025)
Guest Profile Summary for Tablelands Regional
- The typical guest profile for Airbnb in Tablelands Regional consists of primarily domestic travelers (92%), often arriving from nearby Cairns, typically belonging to the Post-2000s (Gen Z/Alpha) group (50%), primarily speaking English or Spanish.
- Domestic travelers account for 91.7% of guests.
- Key international markets include Australia (91.7%) and United States (1.6%).
- Top languages spoken are English (75%) followed by Spanish (6.3%).
- A significant demographic segment is the Post-2000s (Gen Z/Alpha) group, representing 50% of guests.
Recommendations for Hosts
- Target domestic marketing efforts towards travelers from Cairns and Queensland.
- Tailor amenities and listing descriptions to appeal to the dominant Post-2000s (Gen Z/Alpha) demographic (e.g., highlight fast WiFi, smart home features, local guides).
- Highlight unique local experiences or amenities relevant to the primary guest profile.
- Consider seasonal promotions aligned with peak travel times for key origin markets.
Nearby Short-Term Rental Market Comparison
How does the Tablelands Regional Airbnb market stack up against its neighbors? Compare key performance metrics like average monthly revenue, ADR, and occupancy rates in surrounding areas to understand the broader regional STR landscape.
| Market | Active Properties | Monthly Revenue | Daily Rate | Avg. Occupancy |
|---|---|---|---|---|
| Cairns Regional | 798 | $3,196 | $270.26 | 47% |
| Port Douglas | 628 | $3,131 | $326.85 | 42% |
| Douglas Shire | 156 | $2,839 | $285.24 | 43% |
| Mission Beach | 60 | $2,544 | $262.59 | 40% |
| Cairns | 929 | $2,484 | $164.58 | 57% |
| Yungaburra | 50 | $2,284 | $187.52 | 43% |
| Cardwell | 16 | $2,084 | $245.41 | 37% |
| South Mission Beach | 36 | $1,957 | $242.65 | 31% |
| Mareeba Shire | 40 | $1,949 | $160.23 | 42% |
| Wongaling Beach | 52 | $1,759 | $244.38 | 36% |