South Burnett Regional Airbnb Market Analysis 2025: Short Term Rental Data & Vacation Rental Statistics in Queensland, Australia
Is Airbnb profitable in South Burnett Regional in 2025? Explore comprehensive Airbnb analytics for South Burnett Regional, Queensland, Australia to uncover income potential. This 2025 STR market report for South Burnett Regional, based on AirROI data from April 2024 to March 2025, reveals key trends in the niche market of 27 active listings.
Whether you're considering an Airbnb investment in South Burnett Regional, optimizing your existing vacation rental, or exploring rental arbitrage opportunities, understanding the South Burnett Regional Airbnb data is crucial. Leveraging the low regulation environment is key to maximizing your short term rental income potential. Let's dive into the specifics.
Key South Burnett Regional Airbnb Performance Metrics Overview
Monthly Airbnb Revenue Variations & Income Potential in South Burnett Regional (2025)
Understanding the monthly revenue variations for Airbnb listings in South Burnett Regional is key to maximizing your short term rental income potential. Seasonality significantly impacts earnings. Our analysis, based on data from the past 12 months, shows that the peak revenue month for STRs in South Burnett Regional is typically January, while March often presents the lowest earnings, highlighting opportunities for strategic pricing adjustments during shoulder and low seasons. Explore the typical Airbnb income in South Burnett Regional across different performance tiers:
- Best-in-class properties (Top 10%) achieve $3,892+ monthly, often utilizing dynamic pricing and superior guest experiences.
- Strong performing properties (Top 25%) earn $2,264 or more, indicating effective management and desirable locations/amenities.
- Typical properties (Median) generate around $1,531 per month, representing the average market performance.
- Entry-level properties (Bottom 25%) see earnings around $697, often with potential for optimization.
Average Monthly Airbnb Earnings Trend in South Burnett Regional
South Burnett Regional Airbnb Occupancy Rate Trends (2025)
Maximize your bookings by understanding the South Burnett Regional STR occupancy trends. Seasonal demand shifts significantly influence how often properties are booked. Typically, Octobersees the highest demand (peak season occupancy), while March experiences the lowest (low season). Effective strategies, like adjusting minimum stays or offering promotions, can boost occupancy during slower periods. Here's how different property tiers perform in South Burnett Regional:
- Best-in-class properties (Top 10%) achieve 74%+ occupancy, indicating high desirability and potentially optimized availability.
- Strong performing properties (Top 25%) maintain 59% or higher occupancy, suggesting good market fit and guest satisfaction.
- Typical properties (Median) have an occupancy rate around 43%.
- Entry-level properties (Bottom 25%) average 23% occupancy, potentially facing higher vacancy.
Average Monthly Occupancy Rate Trend in South Burnett Regional
Average Daily Rate (ADR) Airbnb Trends in South Burnett Regional (2025)
Effective short term rental pricing strategy in South Burnett Regional involves understanding monthly ADR fluctuations. The Average Daily Rate (ADR) for Airbnb in South Burnett Regional typically peaks in December and dips lowest during May. Leveraging Airbnb dynamic pricing tools or strategies based on this seasonality can significantly boost revenue. Here's a look at the typical nightly rates achieved:
- Best-in-class properties (Top 10%) command rates of $170+ per night, often due to premium features or locations.
- Strong performing properties (Top 25%) achieve nightly rates of $129 or more.
- Typical properties (Median) charge around $107 per night.
- Entry-level properties (Bottom 25%) earn around $78 per night.
Average Daily Rate (ADR) Trend by Month in South Burnett Regional
Get Live South Burnett Regional Market Intelligence 👇

Explore Real-time Analytics
Airbnb Seasonality Analysis & Trends in South Burnett Regional (2025)
Peak Season (January, December, June)
- Revenue averages $2,272 per month
- Occupancy rates average 48.4%
- Daily rates average $120
Shoulder Season
- Revenue averages $1,857 per month
- Occupancy maintains around 46.4%
- Daily rates hold near $110
Low Season (March, April, November)
- Revenue drops to average $1,363 per month
- Occupancy decreases to average 34.0%
- Daily rates adjust to average $113
Seasonality Insights for South Burnett Regional
- The Airbnb seasonality in South Burnett Regional shows moderate seasonality with distinct peak and low periods. While the sections above show seasonal averages, it's also insightful to look at the extremes:
- During the high season, the absolute peak month showcases South Burnett Regional's highest earning potential, with monthly revenues capable of climbing to $2,433, occupancy reaching a high of 55.2%, and ADRs peaking at $127.
- Conversely, the slowest single month of the year, typically falling within the low season, marks the market's lowest point. In this month, revenue might dip to $1,298, occupancy could drop to 29.3%, and ADRs may adjust down to $106.
- Understanding both the seasonal averages and these monthly peaks and troughs in revenue, occupancy, and ADR is crucial for maximizing your Airbnb profit potential in South Burnett Regional.
Seasonal Strategies for Maximizing Profit
- Peak Season: Maximize revenue through premium pricing and potentially longer minimum stays. Ensure high availability.
- Low Season: Offer competitive pricing, special promotions (e.g., extended stay discounts), and flexible cancellation policies. Target off-season travelers like remote workers or budget-conscious guests.
- Shoulder Seasons: Implement dynamic pricing that balances peak and low rates. Target weekend travelers or specific events. Offer slightly more flexible terms than peak season.
- Regularly analyze your own performance against these South Burnett Regional seasonality benchmarks and adjust your pricing and availability strategy accordingly.
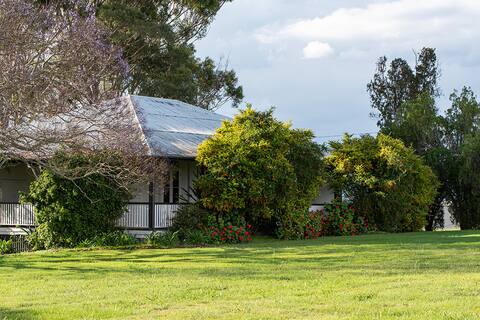
Best Areas for Airbnb Investment in South Burnett Regional (2025)
Exploring the top neighborhoods for short-term rentals in South Burnett Regional? This section highlights key areas, outlining why they are attractive for hosts and guests, along with notable local attractions. Consider these locations based on your target guest profile and investment strategy.
| Neighborhood / Area | Why Host Here? (Target Guests & Appeal) | Key Attractions & Landmarks |
|---|---|---|
| Kingaroy | The largest town in the South Burnett. Known for its agricultural significance and proximity to wineries. A great destination for tourists interested in nature, local produce, and rural experiences. | Peanut Van, Kingaroy Heritage Museum, Bjelke-Petersen Dam, Kingaroy Golf Course, South Burnett Rail Trail |
| Nanango | A charming rural town known for its historical significance and natural beauty. Attracts visitors interested in outdoor activities and heritage events. | Nanango Historical Museum, The King of the Mountain, Crows Nest National Park, Nanango Art Gallery, Bicentennial Park |
| Murgon | A vibrant town with rich agricultural backgrounds and local markets. Ideal for travelers looking for a genuine country experience with local hospitality. | Murgon RSL Park, Murgon Showgrounds, Bjelke-Petersen Dam, South Burnett Vineyards, Murgon Markets |
| Wondai | Known for its picturesque countryside and arts community. Offers visitors a peaceful retreat with local galleries and nature walks. | Wondai Heritage Museum, Wondai Arts and Historical Centre, Bunyas Bushland, Wondai Cinema, South Burnett Mountain Bike Trails |
| Blackbutt | Renowned for its lush landscapes and heritage buildings. Attracts nature lovers and those interested in historic exploration. | Blackbutt Avocado Festival, Blackbutt Rail Trail, The Blackbutt Information Centre, Murgon Mountain Bike Trails, Wellington Caves |
| Taromeo | A small village with beautiful natural scenery perfect for peaceful getaways. Great for guests seeking tranquility and rural landscapes. | Taromeo Falls, Local farmland, Scenic hikes, Horse riding, Camping areas |
| Bunya Mountains | A beautiful national park region with stunning landscapes and abundant wildlife. Ideal for nature enthusiasts and eco-tourism. | Bunya Mountain National Park, Picnic areas, Bushwalking trails, Wildlife spotting, Stargazing opportunities |
| Lifeline South Burnett | A community-focused area with strong support for charity and sustainability. Unique destination for socially conscious travelers. | Lifeline Op Shops, Community gardens, Local workshops, Sustainable craft events, Volunteer opportunities |
Understanding Airbnb License Requirements & STR Laws in South Burnett Regional (2025)
While South Burnett Regional, Queensland, Australia currently shows low STR regulations, specific Airbnb license requirements might still exist or change. Always verify the latest short term rental regulations and Airbnb license requirements directly with local government authorities for South Burnett Regional to ensure full compliance before hosting.
(Source: AirROI data, 2025, finding no licensed listings among those analyzed)
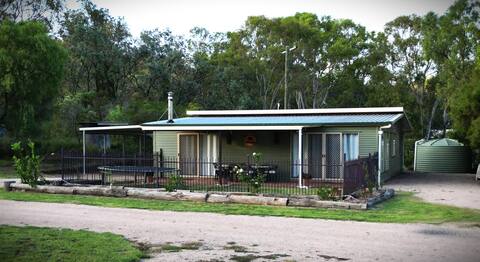
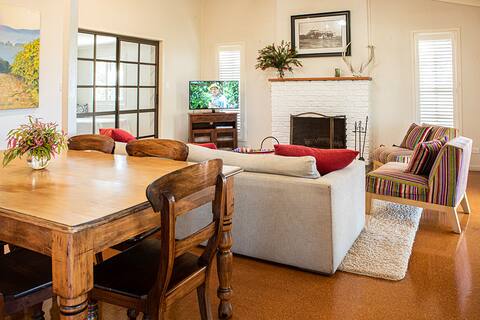
Top Performing Airbnb Properties in South Burnett Regional (2025)
Benchmark your potential! Explore examples of top-performing Airbnb properties in South Burnett Regionalbased on Trailing Twelve Month (TTM) revenue. Analyze their characteristics, revenue, occupancy rate, and ADR to understand what drives success in this market.
Vineyard Cottage
Entire Place • 4 bedrooms
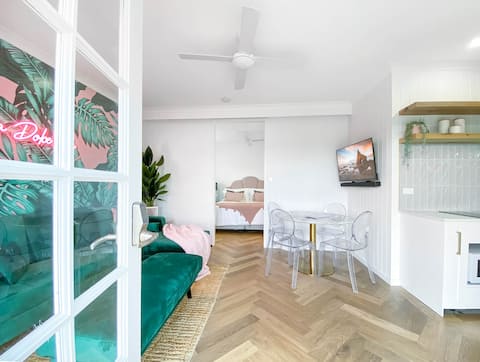
Lusso Retreats - South Burnett 1 Bedroom Retreat
Entire Place • 1 bedroom
Spacious 3 bedroom country cottage
Entire Place • 3 bedrooms

Farm Escape w/ Spa Bath, Fire-pit & Country Views
Entire Place • 3 bedrooms

Nanango Eco Cottage
Entire Place • 3 bedrooms
Hilltop Cottage
Entire Place • 4 bedrooms
Note: Performance varies based on location, size, amenities, seasonality, and management quality. Data reflects the past 12 months.
Top Performing Airbnb Hosts in South Burnett Regional (2025)
Learn from the best! This table showcases top-performing Airbnb hosts in South Burnett Regional based on the number of properties managed and estimated total revenue over the past year. Analyze their scale and performance metrics.
| Host Name | Properties | Grossing Revenue | Stay Reviews | Avg Rating |
|---|---|---|---|---|
| Susan | 4 | $112,676 | 432 | 4.85/5.0 |
| Lusso | 1 | $36,277 | 18 | 4.94/5.0 |
| Phil And Suzy | 1 | $30,771 | 28 | 5.00/5.0 |
| Catherine | 1 | $30,583 | 28 | 4.89/5.0 |
| J & M | 1 | $28,643 | 140 | 4.95/5.0 |
| Rob And Tania | 2 | $23,915 | 205 | 4.96/5.0 |
| Jo | 1 | $23,353 | 18 | 5.00/5.0 |
| Graham | 1 | $23,023 | 208 | 4.93/5.0 |
| Melissa | 1 | $20,941 | 191 | 4.96/5.0 |
| Sarah | 1 | $20,907 | 64 | 4.94/5.0 |
Analyzing the strategies of top hosts, such as their property selection, pricing, and guest communication, can offer valuable lessons for optimizing your own Airbnb operations in South Burnett Regional.
Dive Deeper: Advanced South Burnett Regional STR Market Data (2025)
Ready to unlock more insights? AirROI provides access to advanced metrics and comprehensive Airbnb data for South Burnett Regional. Explore detailed analytics beyond this report to refine your investment strategy, optimize pricing, and maximize your vacation rental profits.
Explore Advanced MetricsSouth Burnett Regional Short-Term Rental Market Composition (2025): Property & Room Types
Room Type Distribution
Property Type Distribution
Market Composition Insights for South Burnett Regional
- The South Burnett Regional Airbnb market composition is heavily skewed towards Entire Home/Apt listings, which make up 81.5% of the 27 active rentals. This indicates strong guest preference for privacy and space.
- Looking at the property type distribution in South Burnett Regional, House properties are the most common (59.3%), reflecting the local real estate landscape.
- Houses represent a significant 59.3% portion, catering likely to families or larger groups.
- The presence of 7.4% Hotel/Boutique listings indicates integration with traditional hospitality.
South Burnett Regional Airbnb Room Capacity Analysis (2025): Bedroom Distribution
Distribution of Listings by Number of Bedrooms
Room Capacity Insights for South Burnett Regional
- The dominant room capacity in South Burnett Regional is 3 bedrooms listings, making up 33.3% of the market. This suggests a strong demand for properties suitable for families or small groups.
- Together, 3 bedrooms and 1 bedroom properties represent 59.2% of the active Airbnb listings in South Burnett Regional, indicating a high concentration in these sizes.
- A significant 40.7% of listings offer 3+ bedrooms, catering to larger groups and families seeking more space in South Burnett Regional.
South Burnett Regional Vacation Rental Guest Capacity Trends (2025)
Distribution of Listings by Guest Capacity
Guest Capacity Insights for South Burnett Regional
- The most common guest capacity trend in South Burnett Regional vacation rentals is listings accommodating 6 guests (25.9%). This suggests the primary traveler segment is likely larger groups.
- Properties designed for 6 guests and 4 guests dominate the South Burnett Regional STR market, accounting for 51.8% of listings.
- 37.0% of properties accommodate 6+ guests, serving the market segment for larger families or group travel in South Burnett Regional.
- On average, properties in South Burnett Regional are equipped to host 4.2 guests.
South Burnett Regional Airbnb Booking Patterns (2025): Available vs. Booked Days
Available Days Distribution
Booked Days Distribution
Booking Pattern Insights for South Burnett Regional
- The most common availability pattern in South Burnett Regional falls within the 271-366 days range, representing 37% of listings. This suggests many properties have significant open periods on their calendars.
- Approximately 62.9% of listings show high availability (181+ days open annually), indicating potential for increased bookings or specific owner usage patterns.
- For booked days, the 91-180 days range is most frequent in South Burnett Regional (33.3%), reflecting common guest stay durations or potential owner blocking patterns.
- A notable 37.0% of properties secure long booking periods (181+ days booked per year), highlighting successful long-term rental strategies or significant owner usage.
South Burnett Regional Airbnb Minimum Stay Requirements Analysis
Distribution of Listings by Minimum Night Requirement
1 Night
8 listings
30.8% of total
2 Nights
14 listings
53.8% of total
3 Nights
2 listings
7.7% of total
4-6 Nights
1 listings
3.8% of total
30+ Nights
1 listings
3.8% of total
Key Insights
- The most prevalent minimum stay requirement in South Burnett Regional is 2 Nights, adopted by 53.8% of listings. This highlights the market's preference for shorter, flexible bookings.
- A strong majority (84.6%) of the South Burnett Regional Airbnb data shows acceptance of very short stays (1-2 nights), indicating a dynamic, high-turnover market.
Recommendations
- Align with the market by considering a 2 Nights minimum stay, as 53.8% of South Burnett Regional hosts use this setting.
- Adjust minimum nights based on seasonality – potentially shorter during low season and longer during peak demand periods in South Burnett Regional.
South Burnett Regional Airbnb Cancellation Policy Trends Analysis (2025)
Flexible
9 listings
34.6% of total
Moderate
15 listings
57.7% of total
Firm
2 listings
7.7% of total
Cancellation Policy Insights for South Burnett Regional
- The prevailing Airbnb cancellation policy trend in South Burnett Regional is Moderate, used by 57.7% of listings.
- The market strongly favors guest-friendly terms, with 92.3% of listings offering Flexible or Moderate policies. This suggests guests in South Burnett Regional may expect booking flexibility.
Recommendations for Hosts
- Consider adopting a Moderate policy to align with the 57.7% market standard in South Burnett Regional.
- Regularly review your cancellation policy against competitors and market demand shifts in South Burnett Regional.
South Burnett Regional STR Booking Lead Time Analysis (2025)
Average Booking Lead Time by Month
Booking Lead Time Insights for South Burnett Regional
- The overall average booking lead time for vacation rentals in South Burnett Regional is 43 days.
- Guests book furthest in advance for stays during October (average 68 days), likely coinciding with peak travel demand or local events.
- The shortest booking windows occur for stays in November (average 28 days), indicating more last-minute travel plans during this time.
- Seasonally, Fall (47 days avg.) sees the longest lead times, while Winter (41 days avg.) has the shortest, reflecting typical travel planning cycles.
Recommendations for Hosts
- Use the overall average lead time (43 days) as a baseline for your pricing and availability strategy in South Burnett Regional.
- For October stays, consider implementing length-of-stay discounts or slightly higher rates for bookings made less than 68 days out to capitalize on advance planning.
- Target marketing efforts for the Fall season well in advance (at least 47 days) to capture early planners.
- Monitor your own booking lead times against these South Burnett Regional averages to identify opportunities for dynamic pricing adjustments.
Popular & Essential Airbnb Amenities in South Burnett Regional (2025)
Amenity Prevalence
Amenity Insights for South Burnett Regional
- Essential amenities in South Burnett Regional that guests expect include: Free parking on premises, Hot water, TV, Smoke alarm. Lacking these (any) could significantly impact bookings.
- Popular amenities like Dishes and silverware, Heating, Backyard are common but not universal. Offering these can provide a competitive edge.
Recommendations for Hosts
- Ensure your listing includes all essential amenities for South Burnett Regional: Free parking on premises, Hot water, TV, Smoke alarm.
- Prioritize adding missing essentials: Hot water, TV, Smoke alarm.
- Consider adding popular differentiators like Dishes and silverware or Heating to increase appeal.
- Highlight unique or less common amenities you offer (e.g., hot tub, dedicated workspace, EV charger) in your listing description and photos.
- Regularly check competitor amenities in South Burnett Regional to stay competitive.
South Burnett Regional Airbnb Guest Demographics & Profile Analysis (2025)
Guest Profile Summary for South Burnett Regional
- The typical guest profile for Airbnb in South Burnett Regional consists of primarily domestic travelers (97%), often arriving from nearby Brisbane, typically belonging to the Post-2000s (Gen Z/Alpha) group (50%), primarily speaking English or German.
- Domestic travelers account for 97.4% of guests.
- Key international markets include Australia (97.4%) and New Zealand (0.8%).
- Top languages spoken are English (76.9%) followed by German (4.3%).
- A significant demographic segment is the Post-2000s (Gen Z/Alpha) group, representing 50% of guests.
Recommendations for Hosts
- Target domestic marketing efforts towards travelers from Brisbane and Queensland.
- Tailor amenities and listing descriptions to appeal to the dominant Post-2000s (Gen Z/Alpha) demographic (e.g., highlight fast WiFi, smart home features, local guides).
- Highlight unique local experiences or amenities relevant to the primary guest profile.
- Consider seasonal promotions aligned with peak travel times for key origin markets.
Nearby Short-Term Rental Market Comparison
How does the South Burnett Regional Airbnb market stack up against its neighbors? Compare key performance metrics like average monthly revenue, ADR, and occupancy rates in surrounding areas to understand the broader regional STR landscape.
| Market | Active Properties | Monthly Revenue | Daily Rate | Avg. Occupancy |
|---|---|---|---|---|
| Somerset Regional | 54 | $2,748 | $217.48 | 43% |
| Boonah | 14 | $2,635 | $155.84 | 54% |
| Toogoom | 27 | $2,503 | $233.58 | 47% |
| Amamoor | 12 | $2,358 | $147.43 | 48% |
| Cooroy | 16 | $2,265 | $197.32 | 49% |
| Burrum Heads | 58 | $2,240 | $288.13 | 41% |
| Imbil | 17 | $2,221 | $144.24 | 47% |
| Lockyer Valley Regional | 20 | $2,208 | $148.83 | 55% |
| Toowoomba | 279 | $2,196 | $136.95 | 56% |
| Hervey Bay | 336 | $2,134 | $150.43 | 54% |