Shute Harbour Airbnb Market Analysis 2025: Short Term Rental Data & Vacation Rental Statistics in Queensland, Australia
Is Airbnb profitable in Shute Harbour in 2025? Explore comprehensive Airbnb analytics for Shute Harbour, Queensland, Australia to uncover income potential. This 2025 STR market report for Shute Harbour, based on AirROI data from April 2024 to March 2025, reveals key trends in the niche market of 19 active listings.
Whether you're considering an Airbnb investment in Shute Harbour, optimizing your existing vacation rental, or exploring rental arbitrage opportunities, understanding the Shute Harbour Airbnb data is crucial. Leveraging the low regulation environment is key to maximizing your short term rental income potential. Let's dive into the specifics.
Key Shute Harbour Airbnb Performance Metrics Overview
Monthly Airbnb Revenue Variations & Income Potential in Shute Harbour (2025)
Understanding the monthly revenue variations for Airbnb listings in Shute Harbour is key to maximizing your short term rental income potential. Seasonality significantly impacts earnings. Our analysis, based on data from the past 12 months, shows that the peak revenue month for STRs in Shute Harbour is typically December, while March often presents the lowest earnings, highlighting opportunities for strategic pricing adjustments during shoulder and low seasons. Explore the typical Airbnb income in Shute Harbour across different performance tiers:
- Best-in-class properties (Top 10%) achieve $11,499+ monthly, often utilizing dynamic pricing and superior guest experiences.
- Strong performing properties (Top 25%) earn $7,960 or more, indicating effective management and desirable locations/amenities.
- Typical properties (Median) generate around $3,350 per month, representing the average market performance.
- Entry-level properties (Bottom 25%) see earnings around $1,689, often with potential for optimization.
Average Monthly Airbnb Earnings Trend in Shute Harbour
Shute Harbour Airbnb Occupancy Rate Trends (2025)
Maximize your bookings by understanding the Shute Harbour STR occupancy trends. Seasonal demand shifts significantly influence how often properties are booked. Typically, Aprilsees the highest demand (peak season occupancy), while March experiences the lowest (low season). Effective strategies, like adjusting minimum stays or offering promotions, can boost occupancy during slower periods. Here's how different property tiers perform in Shute Harbour:
- Best-in-class properties (Top 10%) achieve 75%+ occupancy, indicating high desirability and potentially optimized availability.
- Strong performing properties (Top 25%) maintain 65% or higher occupancy, suggesting good market fit and guest satisfaction.
- Typical properties (Median) have an occupancy rate around 42%.
- Entry-level properties (Bottom 25%) average 19% occupancy, potentially facing higher vacancy.
Average Monthly Occupancy Rate Trend in Shute Harbour
Average Daily Rate (ADR) Airbnb Trends in Shute Harbour (2025)
Effective short term rental pricing strategy in Shute Harbour involves understanding monthly ADR fluctuations. The Average Daily Rate (ADR) for Airbnb in Shute Harbour typically peaks in December and dips lowest during May. Leveraging Airbnb dynamic pricing tools or strategies based on this seasonality can significantly boost revenue. Here's a look at the typical nightly rates achieved:
- Best-in-class properties (Top 10%) command rates of $652+ per night, often due to premium features or locations.
- Strong performing properties (Top 25%) achieve nightly rates of $508 or more.
- Typical properties (Median) charge around $345 per night.
- Entry-level properties (Bottom 25%) earn around $161 per night.
Average Daily Rate (ADR) Trend by Month in Shute Harbour
Get Live Shute Harbour Market Intelligence 👇

Explore Real-time Analytics
Airbnb Seasonality Analysis & Trends in Shute Harbour (2025)
Peak Season (December, January, April)
- Revenue averages $6,327 per month
- Occupancy rates average 50.4%
- Daily rates average $380
Shoulder Season
- Revenue averages $5,153 per month
- Occupancy maintains around 46.4%
- Daily rates hold near $341
Low Season (February, March, May)
- Revenue drops to average $3,570 per month
- Occupancy decreases to average 30.8%
- Daily rates adjust to average $349
Seasonality Insights for Shute Harbour
- The Airbnb seasonality in Shute Harbour shows highly seasonal trends requiring careful strategy. While the sections above show seasonal averages, it's also insightful to look at the extremes:
- During the high season, the absolute peak month showcases Shute Harbour's highest earning potential, with monthly revenues capable of climbing to $6,771, occupancy reaching a high of 53.0%, and ADRs peaking at $407.
- Conversely, the slowest single month of the year, typically falling within the low season, marks the market's lowest point. In this month, revenue might dip to $3,195, occupancy could drop to 27.0%, and ADRs may adjust down to $318.
- Understanding both the seasonal averages and these monthly peaks and troughs in revenue, occupancy, and ADR is crucial for maximizing your Airbnb profit potential in Shute Harbour.
Seasonal Strategies for Maximizing Profit
- Peak Season: Maximize revenue through premium pricing and potentially longer minimum stays. Ensure high availability.
- Low Season: Offer competitive pricing, special promotions (e.g., extended stay discounts), and flexible cancellation policies. Target off-season travelers like remote workers or budget-conscious guests.
- Shoulder Seasons: Implement dynamic pricing that balances peak and low rates. Target weekend travelers or specific events. Offer slightly more flexible terms than peak season.
- Regularly analyze your own performance against these Shute Harbour seasonality benchmarks and adjust your pricing and availability strategy accordingly.
Best Areas for Airbnb Investment in Shute Harbour (2025)
Exploring the top neighborhoods for short-term rentals in Shute Harbour? This section highlights key areas, outlining why they are attractive for hosts and guests, along with notable local attractions. Consider these locations based on your target guest profile and investment strategy.
| Neighborhood / Area | Why Host Here? (Target Guests & Appeal) | Key Attractions & Landmarks |
|---|---|---|
| Whitsunday Coast | Gateway to the Great Barrier Reef and known for its stunning natural beauty. Ideal for tourists looking for adventure, relaxation, and outdoor activities. | Whitsunday Islands, Great Barrier Reef, Whitehaven Beach, Airlie Beach, Coral Sea |
| Airlie Beach | The main hub for travelers visiting the Whitsunday Islands, with a lively atmosphere, restaurants, bars, and access to various boat tours and water activities. | Airlie Beach Lagoon, Coral Sea Marina, Boat tours to islands, Nightlife and dining, Whitsunday Crocodile Safari |
| Hamilton Island | A popular resort destination with beautiful beaches, golf courses, and luxury accommodations. Attracts honeymooners and families seeking a premium getaway. | Catseye Beach, Hamilton Island Golf Club, Snorkeling and water sports, Sunset cruises, Whitsunday Sky |
| Proserpine | Close to the Whitsunday Coast and Great Barrier Reef, providing access to the local culture and outdoor activities. Ideal for travelers who prefer a more local experience. | Proserpine Historical Museum, Whitsunday Gold Coffee Plantation, Fishing and hiking opportunities, Local markets, Access to nearby beaches |
| Shute Harbour | A quieter area with stunning coastlines and proximity to the Whitsunday Islands. Great for those looking for a peaceful escape while being near tourist attractions. | Shute Harbour Marina, Scenic walks, Access to sailing tours, Stunning views of the islands, Nature trails |
| Cannonvale | A suburb of Airlie Beach that offers a mix of residential living and holiday accommodations. Popular with families and longer-term stays. | Cannonvale Beach, Shopping centers, Nearby parks, Local dining, Proximity to Airlie Beach |
| Daydream Island | A small island resort with beautiful beaches and a focus on eco-tourism. Attracts those looking for relaxation and unique experiences with nature. | Daydream Island Resort, Coral Lagoon, Snorkeling spots, Nature walks, Resort amenities |
| Long Island | Known for its natural beauty and secluded beaches, ideal for a more tranquil experience away from the busier tourism spots. | Long Island National Park, Beaches and snorkeling, Tranquil hiking trails, Relaxation spots, Secluded coves |
Understanding Airbnb License Requirements & STR Laws in Shute Harbour (2025)
While Shute Harbour, Queensland, Australia currently shows low STR regulations, specific Airbnb license requirements might still exist or change. Always verify the latest short term rental regulations and Airbnb license requirements directly with local government authorities for Shute Harbour to ensure full compliance before hosting.
(Source: AirROI data, 2025, finding no licensed listings among those analyzed)
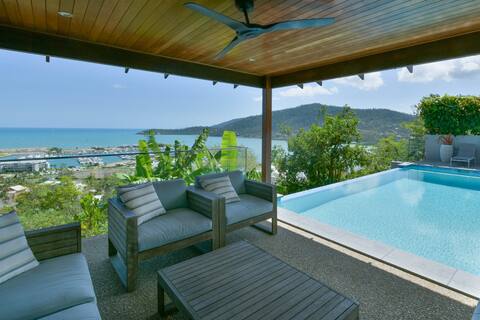
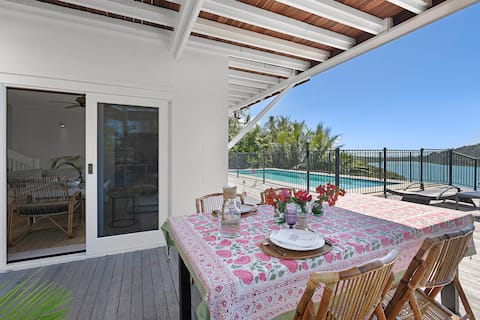
Top Performing Airbnb Properties in Shute Harbour (2025)
Benchmark your potential! Explore examples of top-performing Airbnb properties in Shute Harbourbased on Trailing Twelve Month (TTM) revenue. Analyze their characteristics, revenue, occupancy rate, and ADR to understand what drives success in this market.

Picturesque on Passage
Entire Place • 6 bedrooms

The Point Whitsundays - Romantic Couples Getaway
Entire Place • 1 bedroom
Elementa Whitsundays House 7 - Wood Forest
Entire Place • 4 bedrooms

'Vue de Bleu' Luxury Whitsunday Retreat
Entire Place • 4 bedrooms
The Tropical House Whitsundays
Entire Place • 4 bedrooms

Shutehaven Villa
Entire Place • 5 bedrooms
Note: Performance varies based on location, size, amenities, seasonality, and management quality. Data reflects the past 12 months.
Top Performing Airbnb Hosts in Shute Harbour (2025)
Learn from the best! This table showcases top-performing Airbnb hosts in Shute Harbour based on the number of properties managed and estimated total revenue over the past year. Analyze their scale and performance metrics.
| Host Name | Properties | Grossing Revenue | Stay Reviews | Avg Rating |
|---|---|---|---|---|
| Mark | 4 | $239,052 | 92 | 4.87/5.0 |
| Whitsunday Holiday Rentals | 3 | $191,194 | 60 | 4.24/5.0 |
| Accom | 2 | $139,300 | 12 | 4.62/5.0 |
| Catherine | 1 | $97,345 | 410 | 4.99/5.0 |
| Anna | 1 | $92,330 | 82 | 4.88/5.0 |
| Kat And Iain | 2 | $56,590 | 254 | 4.99/5.0 |
| Holiday In The Whitsundays | 4 | $39,424 | 184 | 4.70/5.0 |
| John | 1 | $30,600 | 13 | 5.00/5.0 |
| Host #364995921 | 1 | $10,679 | 0 | 0.00/5.0 |
Analyzing the strategies of top hosts, such as their property selection, pricing, and guest communication, can offer valuable lessons for optimizing your own Airbnb operations in Shute Harbour.
Dive Deeper: Advanced Shute Harbour STR Market Data (2025)
Ready to unlock more insights? AirROI provides access to advanced metrics and comprehensive Airbnb data for Shute Harbour. Explore detailed analytics beyond this report to refine your investment strategy, optimize pricing, and maximize your vacation rental profits.
Explore Advanced MetricsShute Harbour Short-Term Rental Market Composition (2025): Property & Room Types
Room Type Distribution
Property Type Distribution
Market Composition Insights for Shute Harbour
- The Shute Harbour Airbnb market composition is heavily skewed towards Entire Home/Apt listings, which make up 94.7% of the 19 active rentals. This indicates strong guest preference for privacy and space.
- Looking at the property type distribution in Shute Harbour, House properties are the most common (63.2%), reflecting the local real estate landscape.
- Houses represent a significant 63.2% portion, catering likely to families or larger groups.
Shute Harbour Airbnb Room Capacity Analysis (2025): Bedroom Distribution
Distribution of Listings by Number of Bedrooms
Room Capacity Insights for Shute Harbour
- The dominant room capacity in Shute Harbour is 4 bedrooms listings, making up 26.3% of the market. This suggests a strong demand for properties suitable for families or small groups.
- Together, 4 bedrooms and 3 bedrooms properties represent 47.4% of the active Airbnb listings in Shute Harbour, indicating a high concentration in these sizes.
- A significant 57.9% of listings offer 3+ bedrooms, catering to larger groups and families seeking more space in Shute Harbour.
Shute Harbour Vacation Rental Guest Capacity Trends (2025)
Distribution of Listings by Guest Capacity
Guest Capacity Insights for Shute Harbour
- The most common guest capacity trend in Shute Harbour vacation rentals is listings accommodating 2 guests (36.8%). This suggests the primary traveler segment is likely couples or solo travelers.
- Properties designed for 2 guests and 8+ guests dominate the Shute Harbour STR market, accounting for 68.4% of listings.
- 52.7% of properties accommodate 6+ guests, serving the market segment for larger families or group travel in Shute Harbour.
- On average, properties in Shute Harbour are equipped to host 4.9 guests.
Shute Harbour Airbnb Booking Patterns (2025): Available vs. Booked Days
Available Days Distribution
Booked Days Distribution
Booking Pattern Insights for Shute Harbour
- The most common availability pattern in Shute Harbour falls within the 271-366 days range, representing 42.1% of listings. This suggests many properties have significant open periods on their calendars.
- Approximately 73.7% of listings show high availability (181+ days open annually), indicating potential for increased bookings or specific owner usage patterns.
- For booked days, the 91-180 days range is most frequent in Shute Harbour (31.6%), reflecting common guest stay durations or potential owner blocking patterns.
- A notable 26.4% of properties secure long booking periods (181+ days booked per year), highlighting successful long-term rental strategies or significant owner usage.
Shute Harbour Airbnb Minimum Stay Requirements Analysis
Distribution of Listings by Minimum Night Requirement
2 Nights
1 listings
5.3% of total
3 Nights
5 listings
26.3% of total
4-6 Nights
3 listings
15.8% of total
30+ Nights
10 listings
52.6% of total
Key Insights
- The most prevalent minimum stay requirement in Shute Harbour is 30+ Nights, adopted by 52.6% of listings. This highlights the market's preference for longer commitments.
- Very short stays (1-2 nights) are less common (5.3%), suggesting hosts prefer slightly longer bookings to optimize turnover.
- A significant segment (52.6%) caters to monthly stays (30+ nights) in Shute Harbour, pointing to opportunities in the extended-stay market.
Recommendations
- Align with the market by considering a 30+ Nights minimum stay, as 52.6% of Shute Harbour hosts use this setting.
- Explore offering discounts for stays of 30+ nights to attract the 52.6% of the market seeking extended stays.
- Adjust minimum nights based on seasonality – potentially shorter during low season and longer during peak demand periods in Shute Harbour.
Shute Harbour Airbnb Cancellation Policy Trends Analysis (2025)
Super Strict 30 Days
7 listings
38.9% of total
Flexible
1 listings
5.6% of total
Moderate
2 listings
11.1% of total
Firm
2 listings
11.1% of total
Strict
6 listings
33.3% of total
Cancellation Policy Insights for Shute Harbour
- The prevailing Airbnb cancellation policy trend in Shute Harbour is Super Strict 30 Days, used by 38.9% of listings.
- There's a relatively balanced mix between guest-friendly (16.7%) and stricter (44.4%) policies, offering choices for different guest needs.
Recommendations for Hosts
- Consider adopting a Super Strict 30 Days policy to align with the 38.9% market standard in Shute Harbour.
- With 33.3% using Strict terms, this is a viable option in Shute Harbour, particularly for high-value properties or during peak demand periods.
- Regularly review your cancellation policy against competitors and market demand shifts in Shute Harbour.
Shute Harbour STR Booking Lead Time Analysis (2025)
Average Booking Lead Time by Month
Booking Lead Time Insights for Shute Harbour
- The overall average booking lead time for vacation rentals in Shute Harbour is 56 days.
- Guests book furthest in advance for stays during July (average 91 days), likely coinciding with peak travel demand or local events.
- The shortest booking windows occur for stays in May (average 44 days), indicating more last-minute travel plans during this time.
- Seasonally, Summer (80 days avg.) sees the longest lead times, while Fall (59 days avg.) has the shortest, reflecting typical travel planning cycles.
Recommendations for Hosts
- Use the overall average lead time (56 days) as a baseline for your pricing and availability strategy in Shute Harbour.
- For July stays, consider implementing length-of-stay discounts or slightly higher rates for bookings made less than 91 days out to capitalize on advance planning.
- Target marketing efforts for the Summer season well in advance (at least 80 days) to capture early planners.
- Monitor your own booking lead times against these Shute Harbour averages to identify opportunities for dynamic pricing adjustments.
Popular & Essential Airbnb Amenities in Shute Harbour (2025)
Amenity Prevalence
Amenity Insights for Shute Harbour
- Essential amenities in Shute Harbour that guests expect include: Air conditioning. Lacking these (this) could significantly impact bookings.
- Popular amenities like Smoke alarm, Kitchen, Coffee maker are common but not universal. Offering these can provide a competitive edge.
- A pool is a highly desired but not standard amenity, making it a key feature for attracting guests seeking leisure in Shute Harbour.
- Warning: Wifi is not universally provided but is considered essential globally. Ensure reliable Wifi is offered.
Recommendations for Hosts
- Ensure your listing includes all essential amenities for Shute Harbour: Air conditioning.
- Consider adding popular differentiators like Smoke alarm or Kitchen to increase appeal.
- Highlight unique or less common amenities you offer (e.g., hot tub, dedicated workspace, EV charger) in your listing description and photos.
- Regularly check competitor amenities in Shute Harbour to stay competitive.
Shute Harbour Airbnb Guest Demographics & Profile Analysis (2025)
Guest Profile Summary for Shute Harbour
- The typical guest profile for Airbnb in Shute Harbour consists of a mix of domestic (62%) and international guests, often arriving from nearby Melbourne, typically belonging to the Post-2000s (Gen Z/Alpha) group (50%), primarily speaking English or French.
- Domestic travelers account for 62.2% of guests.
- Key international markets include Australia (62.2%) and United Kingdom (10.9%).
- Top languages spoken are English (64.5%) followed by French (6.6%).
- A significant demographic segment is the Post-2000s (Gen Z/Alpha) group, representing 50% of guests.
Recommendations for Hosts
- Target domestic marketing efforts towards travelers from Melbourne and Mackay.
- Tailor amenities and listing descriptions to appeal to the dominant Post-2000s (Gen Z/Alpha) demographic (e.g., highlight fast WiFi, smart home features, local guides).
- Highlight unique local experiences or amenities relevant to the primary guest profile.
- Consider seasonal promotions aligned with peak travel times for key origin markets.
Nearby Short-Term Rental Market Comparison
How does the Shute Harbour Airbnb market stack up against its neighbors? Compare key performance metrics like average monthly revenue, ADR, and occupancy rates in surrounding areas to understand the broader regional STR landscape.
| Market | Active Properties | Monthly Revenue | Daily Rate | Avg. Occupancy |
|---|---|---|---|---|
| Whitsunday Regional | 356 | $6,512 | $562.63 | 49% |
| Airlie Beach | 387 | $3,617 | $286.35 | 51% |
| Cannonvale | 71 | $2,398 | $199.16 | 52% |
| Mackay Regional | 44 | $1,874 | $147.34 | 52% |
| Mackay | 94 | $1,861 | $125.17 | 55% |
| Bowen | 17 | $1,761 | $149.83 | 43% |
| Seaforth | 11 | $1,675 | $122.83 | 52% |
| Ayr | 12 | $1,323 | $92.07 | 55% |