Scenic Rim Regional Airbnb Market Analysis 2025: Short Term Rental Data & Vacation Rental Statistics in Queensland, Australia
Is Airbnb profitable in Scenic Rim Regional in 2025? Explore comprehensive Airbnb analytics for Scenic Rim Regional, Queensland, Australia to uncover income potential. This 2025 STR market report for Scenic Rim Regional, based on AirROI data from April 2024 to March 2025, reveals key trends in the market of 284 active listings.
Whether you're considering an Airbnb investment in Scenic Rim Regional, optimizing your existing vacation rental, or exploring rental arbitrage opportunities, understanding the Scenic Rim Regional Airbnb data is crucial. Leveraging the low regulation environment is key to maximizing your short term rental income potential. Let's dive into the specifics.
Key Scenic Rim Regional Airbnb Performance Metrics Overview
Monthly Airbnb Revenue Variations & Income Potential in Scenic Rim Regional (2025)
Understanding the monthly revenue variations for Airbnb listings in Scenic Rim Regional is key to maximizing your short term rental income potential. Seasonality significantly impacts earnings. Our analysis, based on data from the past 12 months, shows that the peak revenue month for STRs in Scenic Rim Regional is typically June, while February often presents the lowest earnings, highlighting opportunities for strategic pricing adjustments during shoulder and low seasons. Explore the typical Airbnb income in Scenic Rim Regional across different performance tiers:
- Best-in-class properties (Top 10%) achieve $7,385+ monthly, often utilizing dynamic pricing and superior guest experiences.
- Strong performing properties (Top 25%) earn $4,630 or more, indicating effective management and desirable locations/amenities.
- Typical properties (Median) generate around $2,819 per month, representing the average market performance.
- Entry-level properties (Bottom 25%) see earnings around $1,618, often with potential for optimization.
Average Monthly Airbnb Earnings Trend in Scenic Rim Regional
Scenic Rim Regional Airbnb Occupancy Rate Trends (2025)
Maximize your bookings by understanding the Scenic Rim Regional STR occupancy trends. Seasonal demand shifts significantly influence how often properties are booked. Typically, Julysees the highest demand (peak season occupancy), while March experiences the lowest (low season). Effective strategies, like adjusting minimum stays or offering promotions, can boost occupancy during slower periods. Here's how different property tiers perform in Scenic Rim Regional:
- Best-in-class properties (Top 10%) achieve 83%+ occupancy, indicating high desirability and potentially optimized availability.
- Strong performing properties (Top 25%) maintain 68% or higher occupancy, suggesting good market fit and guest satisfaction.
- Typical properties (Median) have an occupancy rate around 45%.
- Entry-level properties (Bottom 25%) average 27% occupancy, potentially facing higher vacancy.
Average Monthly Occupancy Rate Trend in Scenic Rim Regional
Average Daily Rate (ADR) Airbnb Trends in Scenic Rim Regional (2025)
Effective short term rental pricing strategy in Scenic Rim Regional involves understanding monthly ADR fluctuations. The Average Daily Rate (ADR) for Airbnb in Scenic Rim Regional typically peaks in December and dips lowest during May. Leveraging Airbnb dynamic pricing tools or strategies based on this seasonality can significantly boost revenue. Here's a look at the typical nightly rates achieved:
- Best-in-class properties (Top 10%) command rates of $408+ per night, often due to premium features or locations.
- Strong performing properties (Top 25%) achieve nightly rates of $275 or more.
- Typical properties (Median) charge around $189 per night.
- Entry-level properties (Bottom 25%) earn around $133 per night.
Average Daily Rate (ADR) Trend by Month in Scenic Rim Regional
Get Live Scenic Rim Regional Market Intelligence 👇

Explore Real-time Analytics
Airbnb Seasonality Analysis & Trends in Scenic Rim Regional (2025)
Peak Season (June, May, April)
- Revenue averages $4,409 per month
- Occupancy rates average 47.2%
- Daily rates average $224
Shoulder Season
- Revenue averages $3,871 per month
- Occupancy maintains around 50.9%
- Daily rates hold near $237
Low Season (February, March, November)
- Revenue drops to average $2,837 per month
- Occupancy decreases to average 40.2%
- Daily rates adjust to average $243
Seasonality Insights for Scenic Rim Regional
- The Airbnb seasonality in Scenic Rim Regional shows moderate seasonality with distinct peak and low periods. While the sections above show seasonal averages, it's also insightful to look at the extremes:
- During the high season, the absolute peak month showcases Scenic Rim Regional's highest earning potential, with monthly revenues capable of climbing to $4,563, occupancy reaching a high of 54.8%, and ADRs peaking at $265.
- Conversely, the slowest single month of the year, typically falling within the low season, marks the market's lowest point. In this month, revenue might dip to $2,523, occupancy could drop to 36.7%, and ADRs may adjust down to $223.
- Understanding both the seasonal averages and these monthly peaks and troughs in revenue, occupancy, and ADR is crucial for maximizing your Airbnb profit potential in Scenic Rim Regional.
Seasonal Strategies for Maximizing Profit
- Peak Season: Maximize revenue through premium pricing and potentially longer minimum stays. Ensure high availability.
- Low Season: Offer competitive pricing, special promotions (e.g., extended stay discounts), and flexible cancellation policies. Target off-season travelers like remote workers or budget-conscious guests.
- Shoulder Seasons: Implement dynamic pricing that balances peak and low rates. Target weekend travelers or specific events. Offer slightly more flexible terms than peak season.
- Regularly analyze your own performance against these Scenic Rim Regional seasonality benchmarks and adjust your pricing and availability strategy accordingly.
Best Areas for Airbnb Investment in Scenic Rim Regional (2025)
Exploring the top neighborhoods for short-term rentals in Scenic Rim Regional? This section highlights key areas, outlining why they are attractive for hosts and guests, along with notable local attractions. Consider these locations based on your target guest profile and investment strategy.
| Neighborhood / Area | Why Host Here? (Target Guests & Appeal) | Key Attractions & Landmarks |
|---|---|---|
| Mount Tamborine | A popular tourist destination known for its natural beauty, wineries, and arts and crafts shops. It attracts visitors seeking a relaxing getaway in a beautiful mountainous environment. | Mount Tamborine Vineyards, Gallery Walk, Tamborine Rainforest Skywalk, Witches Falls Vineyard, Mount Tamborine National Park |
| Canungra | A charming small town surrounded by stunning natural landscapes, Canungra is ideal for those looking for a peaceful retreat with access to outdoor activities. | Canungra Valley Vineyards, O'Reilly's Canungra Valley Vineyard, Lamington National Park, Canungra Heritage Cottage, Canungra Army Barracks |
| Beaudesert | A growing town with a rural feel that appeals to families and those seeking a quieter lifestyle while still being close to urban amenities. | Beaudesert Historical Society Museum, Beaudesert Market Place, Biddaddaba Creek, Cedar Grove Sports Centre, Mason's Fall |
| Hampton | Known for its stunning views and proximity to Main Range National Park, Hampton is attractive for visitors wanting to experience rural life and nature adventures. | Main Range National Park, Hampton Road, Crows Nest National Park, Pechey Nature Reserve, Hampton Heritage Park |
| Darlington | A peaceful area surrounded by picturesque landscapes, it's perfect for those looking for a secluded getaway with easy access to hiking and nature. | Darlington Park, Migrant Trail, Cedar Creek Falls, Eagle Heights Mountain Resort, Mount Tamborine |
| Rathdowney | Located near the scenic Mount Barney, Rathdowney offers a rural lifestyle and outdoor adventure possibilities, ideal for nature lovers and families. | Mount Barney National Park, Rathdowney Historical Museum, Rathdowney Golf Club, Murray-Darling Basin, Barney View |
| Kooralbyn | A tranquil, rural area known for its golf courses and beautiful landscapes. It attracts visitors looking for relaxation and outdoor activities. | Kooralbyn Valley, Kooralbyn International School, Kooralbyn Golf Club, Scenic Rim Adventure Park, Flying Fox Road |
| Tamborine Mountain | Famous for its breathtaking views, rainforests, and vineyards. It's a popular spot for tourists seeking adventure and relaxation. | Tamborine Mountain Distillery, Tamborine Mountain Skywalk, Spiritual Sanctuary, Curtis Falls, Mount Tamborine |
Understanding Airbnb License Requirements & STR Laws in Scenic Rim Regional (2025)
While Scenic Rim Regional, Queensland, Australia currently shows low STR regulations, specific Airbnb license requirements might still exist or change. Always verify the latest short term rental regulations and Airbnb license requirements directly with local government authorities for Scenic Rim Regional to ensure full compliance before hosting.
(Source: AirROI data, 2025, finding no licensed listings among those analyzed)
Top Performing Airbnb Properties in Scenic Rim Regional (2025)
Benchmark your potential! Explore examples of top-performing Airbnb properties in Scenic Rim Regionalbased on Trailing Twelve Month (TTM) revenue. Analyze their characteristics, revenue, occupancy rate, and ADR to understand what drives success in this market.
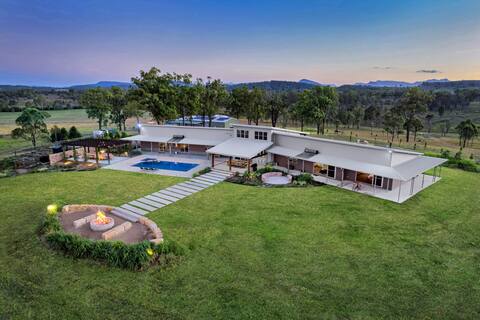
Skyline Farmhouse
Entire Place • 7 bedrooms
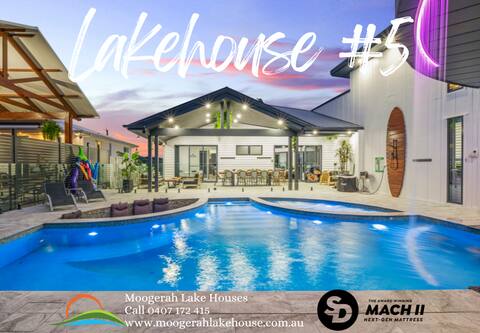
Moogerah Lake House #5 Sleeps 23
Entire Place • 6 bedrooms
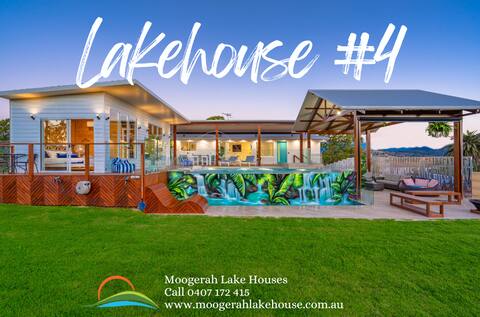
Moogerah Lake House #4 Complete Luxury In Paradise
Entire Place • 5 bedrooms

Lothlórien - A Family Mountain Oasis
Entire Place • 5 bedrooms
Luxury Hinterland Retreat|O'Reilly's Vineyard|Pool
Entire Place • 4 bedrooms
Private luxury in the mountains with running creek
Entire Place • 4 bedrooms
Note: Performance varies based on location, size, amenities, seasonality, and management quality. Data reflects the past 12 months.
Top Performing Airbnb Hosts in Scenic Rim Regional (2025)
Learn from the best! This table showcases top-performing Airbnb hosts in Scenic Rim Regional based on the number of properties managed and estimated total revenue over the past year. Analyze their scale and performance metrics.
| Host Name | Properties | Grossing Revenue | Stay Reviews | Avg Rating |
|---|---|---|---|---|
| Michael & Nicki | 6 | $701,174 | 286 | 4.74/5.0 |
| Skyline Farmhouse | 1 | $290,054 | 69 | 4.88/5.0 |
| Wander | 5 | $274,318 | 54 | 4.86/5.0 |
| Witches Falls Cottages | 3 | $221,840 | 239 | 4.93/5.0 |
| Justin | 2 | $220,902 | 178 | 4.99/5.0 |
| Edges Lodges | 3 | $215,828 | 68 | 4.97/5.0 |
| AirKeeper | 4 | $169,235 | 82 | 4.59/5.0 |
| Amy | 8 | $162,376 | 332 | 2.95/5.0 |
| Kelly | 1 | $162,374 | 72 | 4.96/5.0 |
| Randall | 1 | $160,011 | 23 | 4.96/5.0 |
Analyzing the strategies of top hosts, such as their property selection, pricing, and guest communication, can offer valuable lessons for optimizing your own Airbnb operations in Scenic Rim Regional.
Dive Deeper: Advanced Scenic Rim Regional STR Market Data (2025)
Ready to unlock more insights? AirROI provides access to advanced metrics and comprehensive Airbnb data for Scenic Rim Regional. Explore detailed analytics beyond this report to refine your investment strategy, optimize pricing, and maximize your vacation rental profits.
Explore Advanced MetricsScenic Rim Regional Short-Term Rental Market Composition (2025): Property & Room Types
Room Type Distribution
Property Type Distribution
Market Composition Insights for Scenic Rim Regional
- The Scenic Rim Regional Airbnb market composition is heavily skewed towards Entire Home/Apt listings, which make up 91.9% of the 284 active rentals. This indicates strong guest preference for privacy and space.
- Looking at the property type distribution in Scenic Rim Regional, House properties are the most common (53.5%), reflecting the local real estate landscape.
- Houses represent a significant 53.5% portion, catering likely to families or larger groups.
- The presence of 8.8% Hotel/Boutique listings indicates integration with traditional hospitality.
- Smaller segments like apartment/condo, unique stays (combined 4.2%) offer potential for unique stay experiences.
Scenic Rim Regional Airbnb Room Capacity Analysis (2025): Bedroom Distribution
Distribution of Listings by Number of Bedrooms
Room Capacity Insights for Scenic Rim Regional
- The dominant room capacity in Scenic Rim Regional is 1 bedroom listings, making up 40.5% of the market. This suggests a strong demand for properties suitable for couples or solo travelers.
- Together, 1 bedroom and 3 bedrooms properties represent 60.6% of the active Airbnb listings in Scenic Rim Regional, indicating a high concentration in these sizes.
- A significant 33.8% of listings offer 3+ bedrooms, catering to larger groups and families seeking more space in Scenic Rim Regional.
Scenic Rim Regional Vacation Rental Guest Capacity Trends (2025)
Distribution of Listings by Guest Capacity
Guest Capacity Insights for Scenic Rim Regional
- The most common guest capacity trend in Scenic Rim Regional vacation rentals is listings accommodating 2 guests (35.6%). This suggests the primary traveler segment is likely couples or solo travelers.
- Properties designed for 2 guests and 8+ guests dominate the Scenic Rim Regional STR market, accounting for 54.6% of listings.
- 36.9% of properties accommodate 6+ guests, serving the market segment for larger families or group travel in Scenic Rim Regional.
- On average, properties in Scenic Rim Regional are equipped to host 4.3 guests.
Scenic Rim Regional Airbnb Booking Patterns (2025): Available vs. Booked Days
Available Days Distribution
Booked Days Distribution
Booking Pattern Insights for Scenic Rim Regional
- The most common availability pattern in Scenic Rim Regional falls within the 181-270 days range, representing 33.1% of listings. This suggests many properties have significant open periods on their calendars.
- Approximately 57.0% of listings show high availability (181+ days open annually), indicating potential for increased bookings or specific owner usage patterns.
- For booked days, the 91-180 days range is most frequent in Scenic Rim Regional (33.8%), reflecting common guest stay durations or potential owner blocking patterns.
- A notable 44.4% of properties secure long booking periods (181+ days booked per year), highlighting successful long-term rental strategies or significant owner usage.
Scenic Rim Regional Airbnb Minimum Stay Requirements Analysis
Distribution of Listings by Minimum Night Requirement
1 Night
61 listings
22.8% of total
2 Nights
147 listings
55.1% of total
3 Nights
5 listings
1.9% of total
4-6 Nights
1 listings
0.4% of total
30+ Nights
53 listings
19.9% of total
Key Insights
- The most prevalent minimum stay requirement in Scenic Rim Regional is 2 Nights, adopted by 55.1% of listings. This highlights the market's preference for shorter, flexible bookings.
- A strong majority (77.9%) of the Scenic Rim Regional Airbnb data shows acceptance of very short stays (1-2 nights), indicating a dynamic, high-turnover market.
- A significant segment (19.9%) caters to monthly stays (30+ nights) in Scenic Rim Regional, pointing to opportunities in the extended-stay market.
Recommendations
- Align with the market by considering a 2 Nights minimum stay, as 55.1% of Scenic Rim Regional hosts use this setting.
- If feasible, allowing 1-night stays, especially midweek or during low season, could capture last-minute bookings, as only 22.8% currently do.
- Explore offering discounts for stays of 30+ nights to attract the 19.9% of the market seeking extended stays.
- Adjust minimum nights based on seasonality – potentially shorter during low season and longer during peak demand periods in Scenic Rim Regional.
Scenic Rim Regional Airbnb Cancellation Policy Trends Analysis (2025)
Super Strict 30 Days
1 listings
0.4% of total
Super Strict 60 Days
5 listings
2% of total
Flexible
62 listings
24.5% of total
Moderate
84 listings
33.2% of total
Firm
61 listings
24.1% of total
Strict
40 listings
15.8% of total
Cancellation Policy Insights for Scenic Rim Regional
- The prevailing Airbnb cancellation policy trend in Scenic Rim Regional is Moderate, used by 33.2% of listings.
- There's a relatively balanced mix between guest-friendly (57.7%) and stricter (39.9%) policies, offering choices for different guest needs.
Recommendations for Hosts
- Consider adopting a Moderate policy to align with the 33.2% market standard in Scenic Rim Regional.
- Regularly review your cancellation policy against competitors and market demand shifts in Scenic Rim Regional.
Scenic Rim Regional STR Booking Lead Time Analysis (2025)
Average Booking Lead Time by Month
Booking Lead Time Insights for Scenic Rim Regional
- The overall average booking lead time for vacation rentals in Scenic Rim Regional is 50 days.
- Guests book furthest in advance for stays during June (average 69 days), likely coinciding with peak travel demand or local events.
- The shortest booking windows occur for stays in February (average 44 days), indicating more last-minute travel plans during this time.
- Seasonally, Spring (62 days avg.) sees the longest lead times, while Winter (53 days avg.) has the shortest, reflecting typical travel planning cycles.
Recommendations for Hosts
- Use the overall average lead time (50 days) as a baseline for your pricing and availability strategy in Scenic Rim Regional.
- For June stays, consider implementing length-of-stay discounts or slightly higher rates for bookings made less than 69 days out to capitalize on advance planning.
- Target marketing efforts for the Spring season well in advance (at least 62 days) to capture early planners.
- Monitor your own booking lead times against these Scenic Rim Regional averages to identify opportunities for dynamic pricing adjustments.
Popular & Essential Airbnb Amenities in Scenic Rim Regional (2025)
Amenity Prevalence
Amenity Insights for Scenic Rim Regional
- Essential amenities in Scenic Rim Regional that guests expect include: Free parking on premises, Smoke alarm. Lacking these (any) could significantly impact bookings.
- Popular amenities like Hot water, Kitchen, Heating are common but not universal. Offering these can provide a competitive edge.
- Warning: Wifi is not universally provided but is considered essential globally. Ensure reliable Wifi is offered.
Recommendations for Hosts
- Ensure your listing includes all essential amenities for Scenic Rim Regional: Free parking on premises, Smoke alarm.
- Prioritize adding missing essentials: Free parking on premises, Smoke alarm.
- Consider adding popular differentiators like Hot water or Kitchen to increase appeal.
- Highlight unique or less common amenities you offer (e.g., hot tub, dedicated workspace, EV charger) in your listing description and photos.
- Regularly check competitor amenities in Scenic Rim Regional to stay competitive.
Scenic Rim Regional Airbnb Guest Demographics & Profile Analysis (2025)
Guest Profile Summary for Scenic Rim Regional
- The typical guest profile for Airbnb in Scenic Rim Regional consists of primarily domestic travelers (91%), often arriving from nearby Brisbane, typically belonging to the Post-2000s (Gen Z/Alpha) group (50%), primarily speaking English or French.
- Domestic travelers account for 90.6% of guests.
- Key international markets include Australia (90.6%) and United Kingdom (2.1%).
- Top languages spoken are English (71.2%) followed by French (4.4%).
- A significant demographic segment is the Post-2000s (Gen Z/Alpha) group, representing 50% of guests.
Recommendations for Hosts
- Target domestic marketing efforts towards travelers from Brisbane and Queensland.
- Tailor amenities and listing descriptions to appeal to the dominant Post-2000s (Gen Z/Alpha) demographic (e.g., highlight fast WiFi, smart home features, local guides).
- Highlight unique local experiences or amenities relevant to the primary guest profile.
- Consider seasonal promotions aligned with peak travel times for key origin markets.
Nearby Short-Term Rental Market Comparison
How does the Scenic Rim Regional Airbnb market stack up against its neighbors? Compare key performance metrics like average monthly revenue, ADR, and occupancy rates in surrounding areas to understand the broader regional STR landscape.
| Market | Active Properties | Monthly Revenue | Daily Rate | Avg. Occupancy |
|---|---|---|---|---|
| Castaways Beach | 17 | $5,430 | $517.24 | 47% |
| Byron Bay | 952 | $4,207 | $425.18 | 43% |
| Noosa Heads | 1,002 | $4,142 | $382.10 | 48% |
| Byron Shire Council | 206 | $3,945 | $428.48 | 42% |
| Ewingsdale | 67 | $3,804 | $487.49 | 37% |
| Kingscliff | 336 | $3,683 | $376.49 | 41% |
| Sunrise Beach | 110 | $3,666 | $357.47 | 48% |
| Casuarina Beach | 138 | $3,646 | $407.62 | 42% |
| Sunshine Beach | 289 | $3,550 | $402.94 | 42% |
| Clunes | 18 | $3,531 | $285.32 | 41% |