Maryborough Airbnb Market Analysis 2025: Short Term Rental Data & Vacation Rental Statistics in Queensland, Australia
Is Airbnb profitable in Maryborough in 2025? Explore comprehensive Airbnb analytics for Maryborough, Queensland, Australia to uncover income potential. This 2025 STR market report for Maryborough, based on AirROI data from April 2024 to March 2025, reveals key trends in the niche market of 19 active listings.
Whether you're considering an Airbnb investment in Maryborough, optimizing your existing vacation rental, or exploring rental arbitrage opportunities, understanding the Maryborough Airbnb data is crucial. Leveraging the low regulation environment is key to maximizing your short term rental income potential. Let's dive into the specifics.
Key Maryborough Airbnb Performance Metrics Overview
Monthly Airbnb Revenue Variations & Income Potential in Maryborough (2025)
Understanding the monthly revenue variations for Airbnb listings in Maryborough is key to maximizing your short term rental income potential. Seasonality significantly impacts earnings. Our analysis, based on data from the past 12 months, shows that the peak revenue month for STRs in Maryborough is typically June, while February often presents the lowest earnings, highlighting opportunities for strategic pricing adjustments during shoulder and low seasons. Explore the typical Airbnb income in Maryborough across different performance tiers:
- Best-in-class properties (Top 10%) achieve $3,906+ monthly, often utilizing dynamic pricing and superior guest experiences.
- Strong performing properties (Top 25%) earn $2,321 or more, indicating effective management and desirable locations/amenities.
- Typical properties (Median) generate around $1,344 per month, representing the average market performance.
- Entry-level properties (Bottom 25%) see earnings around $547, often with potential for optimization.
Average Monthly Airbnb Earnings Trend in Maryborough
Maryborough Airbnb Occupancy Rate Trends (2025)
Maximize your bookings by understanding the Maryborough STR occupancy trends. Seasonal demand shifts significantly influence how often properties are booked. Typically, Julysees the highest demand (peak season occupancy), while May experiences the lowest (low season). Effective strategies, like adjusting minimum stays or offering promotions, can boost occupancy during slower periods. Here's how different property tiers perform in Maryborough:
- Best-in-class properties (Top 10%) achieve 83%+ occupancy, indicating high desirability and potentially optimized availability.
- Strong performing properties (Top 25%) maintain 68% or higher occupancy, suggesting good market fit and guest satisfaction.
- Typical properties (Median) have an occupancy rate around 43%.
- Entry-level properties (Bottom 25%) average 15% occupancy, potentially facing higher vacancy.
Average Monthly Occupancy Rate Trend in Maryborough
Average Daily Rate (ADR) Airbnb Trends in Maryborough (2025)
Effective short term rental pricing strategy in Maryborough involves understanding monthly ADR fluctuations. The Average Daily Rate (ADR) for Airbnb in Maryborough typically peaks in December and dips lowest during May. Leveraging Airbnb dynamic pricing tools or strategies based on this seasonality can significantly boost revenue. Here's a look at the typical nightly rates achieved:
- Best-in-class properties (Top 10%) command rates of $200+ per night, often due to premium features or locations.
- Strong performing properties (Top 25%) achieve nightly rates of $140 or more.
- Typical properties (Median) charge around $105 per night.
- Entry-level properties (Bottom 25%) earn around $77 per night.
Average Daily Rate (ADR) Trend by Month in Maryborough
Get Live Maryborough Market Intelligence 👇

Explore Real-time Analytics
Airbnb Seasonality Analysis & Trends in Maryborough (2025)
Peak Season (June, July, January)
- Revenue averages $1,930 per month
- Occupancy rates average 52.0%
- Daily rates average $122
Shoulder Season
- Revenue averages $1,724 per month
- Occupancy maintains around 41.3%
- Daily rates hold near $122
Low Season (February, September, November)
- Revenue drops to average $1,361 per month
- Occupancy decreases to average 41.0%
- Daily rates adjust to average $125
Seasonality Insights for Maryborough
- The Airbnb seasonality in Maryborough shows moderate seasonality with distinct peak and low periods. While the sections above show seasonal averages, it's also insightful to look at the extremes:
- During the high season, the absolute peak month showcases Maryborough's highest earning potential, with monthly revenues capable of climbing to $1,999, occupancy reaching a high of 60.4%, and ADRs peaking at $139.
- Conversely, the slowest single month of the year, typically falling within the low season, marks the market's lowest point. In this month, revenue might dip to $1,213, occupancy could drop to 26.9%, and ADRs may adjust down to $117.
- Understanding both the seasonal averages and these monthly peaks and troughs in revenue, occupancy, and ADR is crucial for maximizing your Airbnb profit potential in Maryborough.
Seasonal Strategies for Maximizing Profit
- Peak Season: Maximize revenue through premium pricing and potentially longer minimum stays. Ensure high availability.
- Low Season: Offer competitive pricing, special promotions (e.g., extended stay discounts), and flexible cancellation policies. Target off-season travelers like remote workers or budget-conscious guests.
- Shoulder Seasons: Implement dynamic pricing that balances peak and low rates. Target weekend travelers or specific events. Offer slightly more flexible terms than peak season.
- Regularly analyze your own performance against these Maryborough seasonality benchmarks and adjust your pricing and availability strategy accordingly.
Best Areas for Airbnb Investment in Maryborough (2025)
Exploring the top neighborhoods for short-term rentals in Maryborough? This section highlights key areas, outlining why they are attractive for hosts and guests, along with notable local attractions. Consider these locations based on your target guest profile and investment strategy.
| Neighborhood / Area | Why Host Here? (Target Guests & Appeal) | Key Attractions & Landmarks |
|---|---|---|
| Daniel Street | A central location close to local amenities, shopping, and parks. Perfect for families and business travelers looking for convenience. | Maryborough City Centre, Queens Park, Heritage Gateway, Mary Ann Steam Locomotive, Maryborough Military & Colonial Museum |
| Water Street | Scenic waterfront views and close proximity to recreational activities. Great for tourists who enjoy nature and outdoor activities. | Mary River, Graham's Creek Conservation Park, Bike paths along the river, Fishing spots, Picnic areas |
| Eli Waters | Family-friendly suburb with access to schools and shopping, making it ideal for longer stays. | Eli Waters Shopping Centre, Local parks, Nearby golf courses, Community events |
| Bourbong Street | Vibrant area in the heart of the city featuring a mix of restaurants, shops, and entertainment venues. | Civic Centre, Local dining, Art galleries, Markets |
| Kent Street | Quiet residential area with historic charm, appealing to visitors who appreciate heritage and local history. | Maryborough Heritage Trail, Historic buildings, Cafe culture, Walking tours |
| Aldershot | Suburban area with a laid-back atmosphere, appealing to families and travelers seeking quiet getaways. | Local parks, Farmers market, Community center |
| Mungar | Rural setting nice for travelers looking to escape the city life, offering a unique taste of Australian countryside. | Rural farms, Nature reserves, Horse riding trails |
| Granville | Growing suburb attracting new residents and investors, providing opportunities for local tourism. | Granville Historic Village, Local parks, Nearby nature trails |
Understanding Airbnb License Requirements & STR Laws in Maryborough (2025)
While Maryborough, Queensland, Australia currently shows low STR regulations, specific Airbnb license requirements might still exist or change. Always verify the latest short term rental regulations and Airbnb license requirements directly with local government authorities for Maryborough to ensure full compliance before hosting.
(Source: AirROI data, 2025, finding no licensed listings among those analyzed)
Top Performing Airbnb Properties in Maryborough (2025)
Benchmark your potential! Explore examples of top-performing Airbnb properties in Maryboroughbased on Trailing Twelve Month (TTM) revenue. Analyze their characteristics, revenue, occupancy rate, and ADR to understand what drives success in this market.

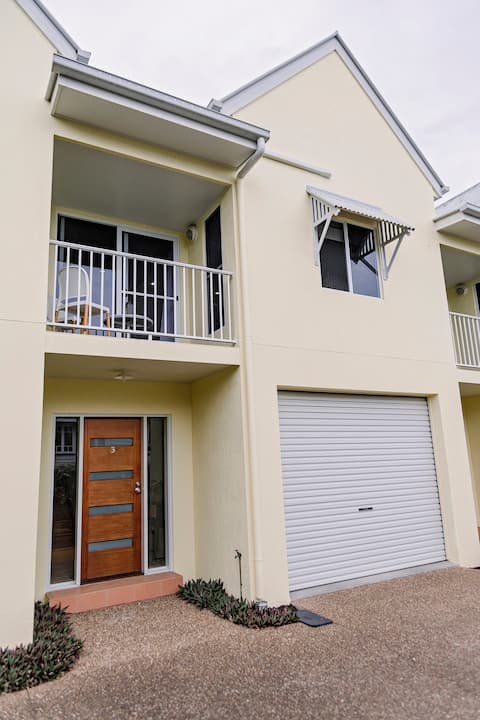
Entire 3 bed-room unit in Maryborough CBD, 10ppl
Entire Place • 3 bedrooms

Home away from Home
Entire Place • 3 bedrooms

Space and character in the heritage hub
Entire Place • 4 bedrooms
Madi's Townhouse
Entire Place • 2 bedrooms
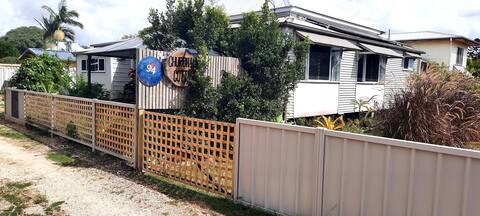
CHURCHILL COTTAGE- 94 Churchill St Maryborough QLD
Entire Place • 3 bedrooms

Churchill Cabin
Entire Place • 1 bedroom
Note: Performance varies based on location, size, amenities, seasonality, and management quality. Data reflects the past 12 months.
Top Performing Airbnb Hosts in Maryborough (2025)
Learn from the best! This table showcases top-performing Airbnb hosts in Maryborough based on the number of properties managed and estimated total revenue over the past year. Analyze their scale and performance metrics.
| Host Name | Properties | Grossing Revenue | Stay Reviews | Avg Rating |
|---|---|---|---|---|
| Thi Yen | 2 | $54,576 | 11 | 2.46/5.0 |
| Daryl & Jackie | 2 | $48,700 | 129 | 4.88/5.0 |
| Bella | 1 | $43,919 | 20 | 4.55/5.0 |
| Alan | 1 | $31,196 | 64 | 4.98/5.0 |
| Madison | 1 | $26,837 | 67 | 4.99/5.0 |
| Wendy | 1 | $21,454 | 40 | 5.00/5.0 |
| Helene | 3 | $20,666 | 19 | 4.86/5.0 |
| Jody | 4 | $19,371 | 121 | 5.00/5.0 |
| Host #255416679 | 1 | $15,188 | 0 | 0.00/5.0 |
| Amanda | 1 | $14,109 | 129 | 4.78/5.0 |
Analyzing the strategies of top hosts, such as their property selection, pricing, and guest communication, can offer valuable lessons for optimizing your own Airbnb operations in Maryborough.
Dive Deeper: Advanced Maryborough STR Market Data (2025)
Ready to unlock more insights? AirROI provides access to advanced metrics and comprehensive Airbnb data for Maryborough. Explore detailed analytics beyond this report to refine your investment strategy, optimize pricing, and maximize your vacation rental profits.
Explore Advanced MetricsMaryborough Short-Term Rental Market Composition (2025): Property & Room Types
Room Type Distribution
Property Type Distribution
Market Composition Insights for Maryborough
- The Maryborough Airbnb market composition is heavily skewed towards Entire Home/Apt listings, which make up 57.9% of the 19 active rentals. This indicates strong guest preference for privacy and space.
- However, a notable 42.1% share for Private Rooms suggests opportunities for budget-conscious travelers or hosts renting out spare rooms.
- Looking at the property type distribution in Maryborough, House properties are the most common (42.1%), reflecting the local real estate landscape.
- Houses represent a significant 42.1% portion, catering likely to families or larger groups.
- The presence of 21.1% Hotel/Boutique listings indicates integration with traditional hospitality.
Maryborough Airbnb Room Capacity Analysis (2025): Bedroom Distribution
Distribution of Listings by Number of Bedrooms
Room Capacity Insights for Maryborough
- The dominant room capacity in Maryborough is 1 bedroom listings, making up 21.1% of the market. This suggests a strong demand for properties suitable for couples or solo travelers.
- Together, 1 bedroom and 2 bedrooms properties represent 36.9% of the active Airbnb listings in Maryborough, indicating a high concentration in these sizes.
- A significant 26.4% of listings offer 3+ bedrooms, catering to larger groups and families seeking more space in Maryborough.
Maryborough Vacation Rental Guest Capacity Trends (2025)
Distribution of Listings by Guest Capacity
Guest Capacity Insights for Maryborough
- The most common guest capacity trend in Maryborough vacation rentals is listings accommodating 6 guests (15.8%). This suggests the primary traveler segment is likely larger groups.
- Properties designed for 6 guests and 5 guests dominate the Maryborough STR market, accounting for 26.3% of listings.
- 26.3% of properties accommodate 6+ guests, serving the market segment for larger families or group travel in Maryborough.
- On average, properties in Maryborough are equipped to host 3.1 guests.
Maryborough Airbnb Booking Patterns (2025): Available vs. Booked Days
Available Days Distribution
Booked Days Distribution
Booking Pattern Insights for Maryborough
- The most common availability pattern in Maryborough falls within the 271-366 days range, representing 52.6% of listings. This suggests many properties have significant open periods on their calendars.
- Approximately 57.9% of listings show high availability (181+ days open annually), indicating potential for increased bookings or specific owner usage patterns.
- For booked days, the 31-90 days range is most frequent in Maryborough (42.1%), reflecting common guest stay durations or potential owner blocking patterns.
- A notable 42.1% of properties secure long booking periods (181+ days booked per year), highlighting successful long-term rental strategies or significant owner usage.
Maryborough Airbnb Minimum Stay Requirements Analysis
Distribution of Listings by Minimum Night Requirement
1 Night
12 listings
66.7% of total
2 Nights
3 listings
16.7% of total
3 Nights
1 listings
5.6% of total
30+ Nights
2 listings
11.1% of total
Key Insights
- The most prevalent minimum stay requirement in Maryborough is 1 Night, adopted by 66.7% of listings. This highlights the market's preference for shorter, flexible bookings.
- A strong majority (83.4%) of the Maryborough Airbnb data shows acceptance of very short stays (1-2 nights), indicating a dynamic, high-turnover market.
- A significant segment (11.1%) caters to monthly stays (30+ nights) in Maryborough, pointing to opportunities in the extended-stay market.
Recommendations
- Align with the market by considering a 1 Night minimum stay, as 66.7% of Maryborough hosts use this setting.
- Explore offering discounts for stays of 30+ nights to attract the 11.1% of the market seeking extended stays.
- Adjust minimum nights based on seasonality – potentially shorter during low season and longer during peak demand periods in Maryborough.
Maryborough Airbnb Cancellation Policy Trends Analysis (2025)
Flexible
14 listings
82.4% of total
Moderate
2 listings
11.8% of total
Firm
1 listings
5.9% of total
Cancellation Policy Insights for Maryborough
- The prevailing Airbnb cancellation policy trend in Maryborough is Flexible, used by 82.4% of listings.
- The market strongly favors guest-friendly terms, with 94.2% of listings offering Flexible or Moderate policies. This suggests guests in Maryborough may expect booking flexibility.
Recommendations for Hosts
- Consider adopting a Flexible policy to align with the 82.4% market standard in Maryborough.
- Given the high prevalence of Flexible policies (82.4%), offering this can enhance booking appeal, especially during shoulder seasons.
- Regularly review your cancellation policy against competitors and market demand shifts in Maryborough.
Maryborough STR Booking Lead Time Analysis (2025)
Average Booking Lead Time by Month
Booking Lead Time Insights for Maryborough
- The overall average booking lead time for vacation rentals in Maryborough is 33 days.
- Guests book furthest in advance for stays during July (average 70 days), likely coinciding with peak travel demand or local events.
- The shortest booking windows occur for stays in September (average 24 days), indicating more last-minute travel plans during this time.
- Seasonally, Winter (46 days avg.) sees the longest lead times, while Fall (31 days avg.) has the shortest, reflecting typical travel planning cycles.
Recommendations for Hosts
- Use the overall average lead time (33 days) as a baseline for your pricing and availability strategy in Maryborough.
- For July stays, consider implementing length-of-stay discounts or slightly higher rates for bookings made less than 70 days out to capitalize on advance planning.
- Target marketing efforts for the Winter season well in advance (at least 46 days) to capture early planners.
- Monitor your own booking lead times against these Maryborough averages to identify opportunities for dynamic pricing adjustments.
Popular & Essential Airbnb Amenities in Maryborough (2025)
Amenity Prevalence
Amenity Insights for Maryborough
- Essential amenities in Maryborough that guests expect include: Hot water, Smoke alarm, Bed linens, TV. Lacking these (any) could significantly impact bookings.
- Popular amenities like Free parking on premises, Wifi, Air conditioning are common but not universal. Offering these can provide a competitive edge.
- Warning: Wifi is not universally provided but is considered essential globally. Ensure reliable Wifi is offered.
Recommendations for Hosts
- Ensure your listing includes all essential amenities for Maryborough: Hot water, Smoke alarm, Bed linens, TV.
- Consider adding popular differentiators like Free parking on premises or Wifi to increase appeal.
- Highlight unique or less common amenities you offer (e.g., hot tub, dedicated workspace, EV charger) in your listing description and photos.
- Regularly check competitor amenities in Maryborough to stay competitive.
Maryborough Airbnb Guest Demographics & Profile Analysis (2025)
Guest Profile Summary for Maryborough
- The typical guest profile for Airbnb in Maryborough consists of primarily domestic travelers (89%), often arriving from nearby Brisbane, typically belonging to the Post-2000s (Gen Z/Alpha) group (50%), primarily speaking English or German.
- Domestic travelers account for 88.6% of guests.
- Key international markets include Australia (88.6%) and United States (2%).
- Top languages spoken are English (67.1%) followed by German (8.9%).
- A significant demographic segment is the Post-2000s (Gen Z/Alpha) group, representing 50% of guests.
Recommendations for Hosts
- Target domestic marketing efforts towards travelers from Brisbane and Queensland.
- Tailor amenities and listing descriptions to appeal to the dominant Post-2000s (Gen Z/Alpha) demographic (e.g., highlight fast WiFi, smart home features, local guides).
- Highlight unique local experiences or amenities relevant to the primary guest profile.
- Consider seasonal promotions aligned with peak travel times for key origin markets.
Nearby Short-Term Rental Market Comparison
How does the Maryborough Airbnb market stack up against its neighbors? Compare key performance metrics like average monthly revenue, ADR, and occupancy rates in surrounding areas to understand the broader regional STR landscape.
| Market | Active Properties | Monthly Revenue | Daily Rate | Avg. Occupancy |
|---|---|---|---|---|
| Castaways Beach | 17 | $5,430 | $517.24 | 47% |
| Noosa Heads | 1,002 | $4,142 | $382.10 | 48% |
| Kingfisher Bay | 29 | $4,002 | $342.74 | 42% |
| Happy Valley | 10 | $3,770 | $222.76 | 57% |
| Sunrise Beach | 110 | $3,666 | $357.47 | 48% |
| Sunshine Beach | 289 | $3,550 | $402.94 | 42% |
| Marcus Beach | 22 | $3,309 | $439.85 | 45% |
| Eurong | 24 | $3,111 | $222.15 | 54% |
| Seventeen Seventy | 29 | $3,032 | $270.56 | 42% |
| Sunshine Coast Regional | 3,453 | $2,894 | $243.73 | 48% |