Kuranda Airbnb Market Analysis 2025: Short Term Rental Data & Vacation Rental Statistics in Queensland, Australia
Is Airbnb profitable in Kuranda in 2025? Explore comprehensive Airbnb analytics for Kuranda, Queensland, Australia to uncover income potential. This 2025 STR market report for Kuranda, based on AirROI data from April 2024 to March 2025, reveals key trends in the niche market of 20 active listings.
Whether you're considering an Airbnb investment in Kuranda, optimizing your existing vacation rental, or exploring rental arbitrage opportunities, understanding the Kuranda Airbnb data is crucial. Leveraging the low regulation environment is key to maximizing your short term rental income potential. Let's dive into the specifics.
Key Kuranda Airbnb Performance Metrics Overview
Monthly Airbnb Revenue Variations & Income Potential in Kuranda (2025)
Understanding the monthly revenue variations for Airbnb listings in Kuranda is key to maximizing your short term rental income potential. Seasonality significantly impacts earnings. Our analysis, based on data from the past 12 months, shows that the peak revenue month for STRs in Kuranda is typically July, while March often presents the lowest earnings, highlighting opportunities for strategic pricing adjustments during shoulder and low seasons. Explore the typical Airbnb income in Kuranda across different performance tiers:
- Best-in-class properties (Top 10%) achieve $3,421+ monthly, often utilizing dynamic pricing and superior guest experiences.
- Strong performing properties (Top 25%) earn $2,446 or more, indicating effective management and desirable locations/amenities.
- Typical properties (Median) generate around $1,521 per month, representing the average market performance.
- Entry-level properties (Bottom 25%) see earnings around $815, often with potential for optimization.
Average Monthly Airbnb Earnings Trend in Kuranda
Kuranda Airbnb Occupancy Rate Trends (2025)
Maximize your bookings by understanding the Kuranda STR occupancy trends. Seasonal demand shifts significantly influence how often properties are booked. Typically, Julysees the highest demand (peak season occupancy), while March experiences the lowest (low season). Effective strategies, like adjusting minimum stays or offering promotions, can boost occupancy during slower periods. Here's how different property tiers perform in Kuranda:
- Best-in-class properties (Top 10%) achieve 78%+ occupancy, indicating high desirability and potentially optimized availability.
- Strong performing properties (Top 25%) maintain 68% or higher occupancy, suggesting good market fit and guest satisfaction.
- Typical properties (Median) have an occupancy rate around 46%.
- Entry-level properties (Bottom 25%) average 29% occupancy, potentially facing higher vacancy.
Average Monthly Occupancy Rate Trend in Kuranda
Average Daily Rate (ADR) Airbnb Trends in Kuranda (2025)
Effective short term rental pricing strategy in Kuranda involves understanding monthly ADR fluctuations. The Average Daily Rate (ADR) for Airbnb in Kuranda typically peaks in October and dips lowest during March. Leveraging Airbnb dynamic pricing tools or strategies based on this seasonality can significantly boost revenue. Here's a look at the typical nightly rates achieved:
- Best-in-class properties (Top 10%) command rates of $210+ per night, often due to premium features or locations.
- Strong performing properties (Top 25%) achieve nightly rates of $144 or more.
- Typical properties (Median) charge around $107 per night.
- Entry-level properties (Bottom 25%) earn around $64 per night.
Average Daily Rate (ADR) Trend by Month in Kuranda
Get Live Kuranda Market Intelligence 👇

Explore Real-time Analytics
Airbnb Seasonality Analysis & Trends in Kuranda (2025)
Peak Season (July, June, August)
- Revenue averages $2,565 per month
- Occupancy rates average 64.4%
- Daily rates average $131
Shoulder Season
- Revenue averages $1,764 per month
- Occupancy maintains around 48.5%
- Daily rates hold near $126
Low Season (January, February, March)
- Revenue drops to average $1,137 per month
- Occupancy decreases to average 30.8%
- Daily rates adjust to average $115
Seasonality Insights for Kuranda
- The Airbnb seasonality in Kuranda shows highly seasonal trends requiring careful strategy. While the sections above show seasonal averages, it's also insightful to look at the extremes:
- During the high season, the absolute peak month showcases Kuranda's highest earning potential, with monthly revenues capable of climbing to $2,883, occupancy reaching a high of 70.8%, and ADRs peaking at $132.
- Conversely, the slowest single month of the year, typically falling within the low season, marks the market's lowest point. In this month, revenue might dip to $1,028, occupancy could drop to 23.7%, and ADRs may adjust down to $112.
- Understanding both the seasonal averages and these monthly peaks and troughs in revenue, occupancy, and ADR is crucial for maximizing your Airbnb profit potential in Kuranda.
Seasonal Strategies for Maximizing Profit
- Peak Season: Maximize revenue through premium pricing and potentially longer minimum stays. Ensure high availability.
- Low Season: Offer competitive pricing, special promotions (e.g., extended stay discounts), and flexible cancellation policies. Target off-season travelers like remote workers or budget-conscious guests.
- Shoulder Seasons: Implement dynamic pricing that balances peak and low rates. Target weekend travelers or specific events. Offer slightly more flexible terms than peak season.
- Regularly analyze your own performance against these Kuranda seasonality benchmarks and adjust your pricing and availability strategy accordingly.
Best Areas for Airbnb Investment in Kuranda (2025)
Exploring the top neighborhoods for short-term rentals in Kuranda? This section highlights key areas, outlining why they are attractive for hosts and guests, along with notable local attractions. Consider these locations based on your target guest profile and investment strategy.
| Neighborhood / Area | Why Host Here? (Target Guests & Appeal) | Key Attractions & Landmarks |
|---|---|---|
| Kuranda Village | A charming rainforest village known for its vibrant markets, art galleries, and stunning natural scenery. Highly attractive for tourists seeking a unique cultural experience in a natural setting. | Kuranda Scenic Railway, Skyrail Rainforest Cableway, Kuranda Koala Gardens, Kuranda Markets, Birdworld Kuranda |
| Barron Falls National Park | Renowned for the spectacular Barron Falls and lush rainforest. An ideal location for nature lovers and adventure seekers looking to explore hiking trails and scenic views. | Barron Falls, Kuranda National Park, Hiking trails, Lookout points, Picnic areas |
| Milla Milla Lookout | A popular lookout spot offering panoramic views of the surrounding landscapes. Attracts visitors for photography and sightseeing, as well as for its nearby waterfalls and rainforest. | Milla Milla Falls, Josephine Falls, Elinjaa Falls, Scenic walks, Photography spots |
| Lake Barrine | A picturesque volcanic crater lake known for its tranquil waters and surrounding rainforest. Perfect for visitors looking for relaxation and natural beauty, as well as water activities. | Lake Barrine, Canoeing, Picnic areas, Tea House, Wildlife spotting |
| Kuranda Rainforest Markets | A vibrant market area featuring local crafts, food, and unique souvenirs. An attractive spot for tourists looking to experience local culture and artistry. | Local artisan stalls, Food vendors, Cultural performances, Craft workshops, Souvenir shops |
| Heritage Markets | A unique marketplace that showcases local artisans and products in a lush rainforest setting. Popular among visitors for its eclectic mix and cultural experiences. | Arts and crafts, Local foods, Cultural experiences, Rainforest setting, Live music |
| Kuranda Eco Village | A community focused on sustainable living and eco-friendly practices. Appeals to environmentally conscious travelers interested in workshops and eco-tourism experiences. | Sustainable living practices, Eco-friendly workshops, Organic garden, Natural beauty, Community events |
| Barbecue Area in Kuranda | A designated area for picnics and barbecues, offering a family-friendly environment for visitors. Ideal for groups and families looking to enjoy outdoor dining and leisure activities. | Picnic tables, Barbecue facilities, Natural setting, Family activities, Wildlife spotting |
Understanding Airbnb License Requirements & STR Laws in Kuranda (2025)
While Kuranda, Queensland, Australia currently shows low STR regulations, specific Airbnb license requirements might still exist or change. Always verify the latest short term rental regulations and Airbnb license requirements directly with local government authorities for Kuranda to ensure full compliance before hosting.
(Source: AirROI data, 2025, finding no licensed listings among those analyzed)
Top Performing Airbnb Properties in Kuranda (2025)
Benchmark your potential! Explore examples of top-performing Airbnb properties in Kurandabased on Trailing Twelve Month (TTM) revenue. Analyze their characteristics, revenue, occupancy rate, and ADR to understand what drives success in this market.

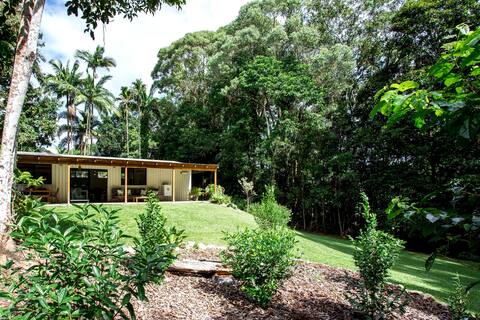
Rainforest Sunsets by Tiny Away
Entire Place • 1 bedroom
Jum Rum Place, Kuranda QLD
Entire Place • 2 bedrooms
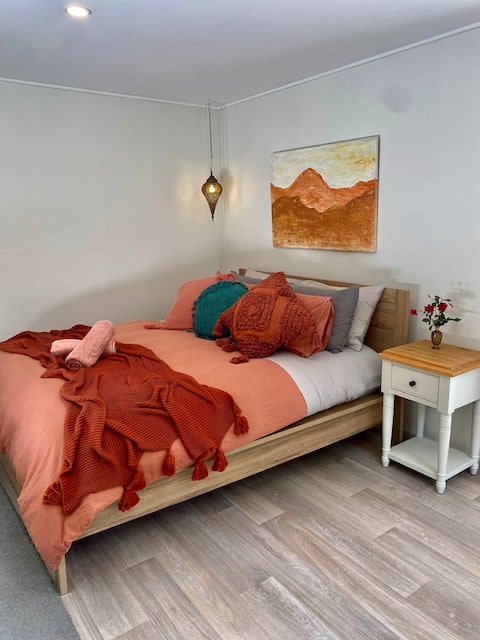
Relaxing haven by the creek
Entire Place • 2 bedrooms
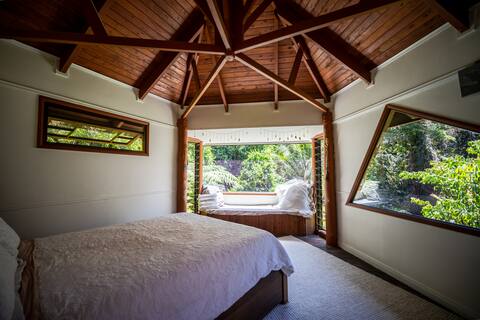
Wake up to Rainforest sounds
Entire Place • 4 bedrooms
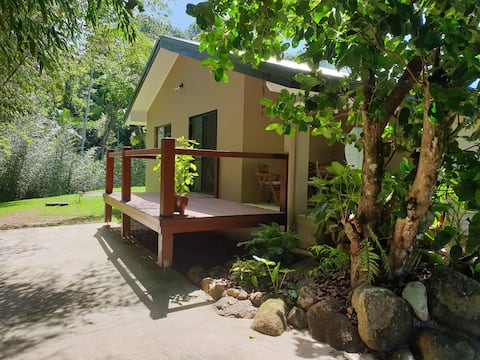
Tranquil Rainforest Studio
Entire Place • 1 bedroom
Tropical Kuranda Modern Retreat
Entire Place • 3 bedrooms
Note: Performance varies based on location, size, amenities, seasonality, and management quality. Data reflects the past 12 months.
Top Performing Airbnb Hosts in Kuranda (2025)
Learn from the best! This table showcases top-performing Airbnb hosts in Kuranda based on the number of properties managed and estimated total revenue over the past year. Analyze their scale and performance metrics.
| Host Name | Properties | Grossing Revenue | Stay Reviews | Avg Rating |
|---|---|---|---|---|
| Susan And Dave | 2 | $50,606 | 78 | 4.92/5.0 |
| Tiny Away | 1 | $47,972 | 76 | 4.89/5.0 |
| Casey | 2 | $30,879 | 418 | 4.79/5.0 |
| Julie | 1 | $25,929 | 182 | 4.95/5.0 |
| Lee-Anne | 1 | $25,613 | 49 | 5.00/5.0 |
| Eva | 1 | $21,426 | 11 | 4.82/5.0 |
| Majella | 1 | $21,349 | 99 | 4.93/5.0 |
| John | 1 | $21,259 | 227 | 4.94/5.0 |
| Jay | 1 | $17,973 | 15 | 4.93/5.0 |
| Elizabeth | 2 | $11,289 | 36 | 4.72/5.0 |
Analyzing the strategies of top hosts, such as their property selection, pricing, and guest communication, can offer valuable lessons for optimizing your own Airbnb operations in Kuranda.
Dive Deeper: Advanced Kuranda STR Market Data (2025)
Ready to unlock more insights? AirROI provides access to advanced metrics and comprehensive Airbnb data for Kuranda. Explore detailed analytics beyond this report to refine your investment strategy, optimize pricing, and maximize your vacation rental profits.
Explore Advanced MetricsKuranda Short-Term Rental Market Composition (2025): Property & Room Types
Room Type Distribution
Property Type Distribution
Market Composition Insights for Kuranda
- The Kuranda Airbnb market composition is heavily skewed towards Entire Home/Apt listings, which make up 70% of the 20 active rentals. This indicates strong guest preference for privacy and space.
- Looking at the property type distribution in Kuranda, House properties are the most common (50%), reflecting the local real estate landscape.
- Houses represent a significant 50% portion, catering likely to families or larger groups.
Kuranda Airbnb Room Capacity Analysis (2025): Bedroom Distribution
Distribution of Listings by Number of Bedrooms
Room Capacity Insights for Kuranda
- The dominant room capacity in Kuranda is 1 bedroom listings, making up 50% of the market. This suggests a strong demand for properties suitable for couples or solo travelers.
- Together, 1 bedroom and 2 bedrooms properties represent 70.0% of the active Airbnb listings in Kuranda, indicating a high concentration in these sizes.
Kuranda Vacation Rental Guest Capacity Trends (2025)
Distribution of Listings by Guest Capacity
Guest Capacity Insights for Kuranda
- The most common guest capacity trend in Kuranda vacation rentals is listings accommodating 2 guests (40%). This suggests the primary traveler segment is likely couples or solo travelers.
- Properties designed for 2 guests and 4 guests dominate the Kuranda STR market, accounting for 60.0% of listings.
- 15.0% of properties accommodate 6+ guests, serving the market segment for larger families or group travel in Kuranda.
- On average, properties in Kuranda are equipped to host 2.9 guests.
Kuranda Airbnb Booking Patterns (2025): Available vs. Booked Days
Available Days Distribution
Booked Days Distribution
Booking Pattern Insights for Kuranda
- The most common availability pattern in Kuranda falls within the 181-270 days range, representing 40% of listings. This suggests many properties have significant open periods on their calendars.
- Approximately 65.0% of listings show high availability (181+ days open annually), indicating potential for increased bookings or specific owner usage patterns.
- For booked days, the 91-180 days range is most frequent in Kuranda (40%), reflecting common guest stay durations or potential owner blocking patterns.
- A notable 35.0% of properties secure long booking periods (181+ days booked per year), highlighting successful long-term rental strategies or significant owner usage.
Kuranda Airbnb Minimum Stay Requirements Analysis
Distribution of Listings by Minimum Night Requirement
1 Night
7 listings
35% of total
2 Nights
6 listings
30% of total
3 Nights
2 listings
10% of total
4-6 Nights
2 listings
10% of total
30+ Nights
3 listings
15% of total
Key Insights
- The most prevalent minimum stay requirement in Kuranda is 1 Night, adopted by 35% of listings. This highlights the market's preference for shorter, flexible bookings.
- A strong majority (65.0%) of the Kuranda Airbnb data shows acceptance of very short stays (1-2 nights), indicating a dynamic, high-turnover market.
- A significant segment (15%) caters to monthly stays (30+ nights) in Kuranda, pointing to opportunities in the extended-stay market.
Recommendations
- Align with the market by considering a 1 Night minimum stay, as 35% of Kuranda hosts use this setting.
- Explore offering discounts for stays of 30+ nights to attract the 15% of the market seeking extended stays.
- Adjust minimum nights based on seasonality – potentially shorter during low season and longer during peak demand periods in Kuranda.
Kuranda Airbnb Cancellation Policy Trends Analysis (2025)
Flexible
5 listings
27.8% of total
Moderate
4 listings
22.2% of total
Firm
5 listings
27.8% of total
Strict
4 listings
22.2% of total
Cancellation Policy Insights for Kuranda
- The prevailing Airbnb cancellation policy trend in Kuranda is Flexible, used by 27.8% of listings.
- There's a relatively balanced mix between guest-friendly (50.0%) and stricter (50.0%) policies, offering choices for different guest needs.
Recommendations for Hosts
- Consider adopting a Flexible policy to align with the 27.8% market standard in Kuranda.
- Regularly review your cancellation policy against competitors and market demand shifts in Kuranda.
Kuranda STR Booking Lead Time Analysis (2025)
Average Booking Lead Time by Month
Booking Lead Time Insights for Kuranda
- The overall average booking lead time for vacation rentals in Kuranda is 43 days.
- Guests book furthest in advance for stays during July (average 91 days), likely coinciding with peak travel demand or local events.
- The shortest booking windows occur for stays in February (average 23 days), indicating more last-minute travel plans during this time.
- Seasonally, Summer (65 days avg.) sees the longest lead times, while Winter (38 days avg.) has the shortest, reflecting typical travel planning cycles.
Recommendations for Hosts
- Use the overall average lead time (43 days) as a baseline for your pricing and availability strategy in Kuranda.
- For July stays, consider implementing length-of-stay discounts or slightly higher rates for bookings made less than 91 days out to capitalize on advance planning.
- Target marketing efforts for the Summer season well in advance (at least 65 days) to capture early planners.
- Monitor your own booking lead times against these Kuranda averages to identify opportunities for dynamic pricing adjustments.
Popular & Essential Airbnb Amenities in Kuranda (2025)
Amenity Prevalence
Amenity Insights for Kuranda
- Essential amenities in Kuranda that guests expect include: Free parking on premises, Hot water, Kitchen. Lacking these (any) could significantly impact bookings.
- Popular amenities like Wifi, Bed linens, Hangers are common but not universal. Offering these can provide a competitive edge.
- Warning: Wifi is not universally provided but is considered essential globally. Ensure reliable Wifi is offered.
Recommendations for Hosts
- Ensure your listing includes all essential amenities for Kuranda: Free parking on premises, Hot water, Kitchen.
- Prioritize adding missing essentials: Hot water, Kitchen.
- Consider adding popular differentiators like Wifi or Bed linens to increase appeal.
- Highlight unique or less common amenities you offer (e.g., hot tub, dedicated workspace, EV charger) in your listing description and photos.
- Regularly check competitor amenities in Kuranda to stay competitive.
Kuranda Airbnb Guest Demographics & Profile Analysis (2025)
Guest Profile Summary for Kuranda
- The typical guest profile for Airbnb in Kuranda consists of primarily domestic travelers (73%), often arriving from nearby Queensland, typically belonging to the Post-2000s (Gen Z/Alpha) group (50%), primarily speaking English or German.
- Domestic travelers account for 73.4% of guests.
- Key international markets include Australia (73.4%) and United States (6%).
- Top languages spoken are English (59.1%) followed by German (9.4%).
- A significant demographic segment is the Post-2000s (Gen Z/Alpha) group, representing 50% of guests.
Recommendations for Hosts
- Target domestic marketing efforts towards travelers from Queensland and Brisbane.
- Tailor amenities and listing descriptions to appeal to the dominant Post-2000s (Gen Z/Alpha) demographic (e.g., highlight fast WiFi, smart home features, local guides).
- Highlight unique local experiences or amenities relevant to the primary guest profile.
- Consider seasonal promotions aligned with peak travel times for key origin markets.
Nearby Short-Term Rental Market Comparison
How does the Kuranda Airbnb market stack up against its neighbors? Compare key performance metrics like average monthly revenue, ADR, and occupancy rates in surrounding areas to understand the broader regional STR landscape.
| Market | Active Properties | Monthly Revenue | Daily Rate | Avg. Occupancy |
|---|---|---|---|---|
| Cairns Regional | 798 | $3,196 | $270.26 | 47% |
| Port Douglas | 628 | $3,131 | $326.85 | 42% |
| Douglas Shire | 156 | $2,839 | $285.24 | 43% |
| Tablelands Regional | 50 | $2,714 | $218.21 | 47% |
| Mission Beach | 60 | $2,544 | $262.59 | 40% |
| Cairns | 929 | $2,484 | $164.58 | 57% |
| Yungaburra | 50 | $2,284 | $187.52 | 43% |
| South Mission Beach | 36 | $1,957 | $242.65 | 31% |
| Mareeba Shire | 40 | $1,949 | $160.23 | 42% |
| Wongaling Beach | 52 | $1,759 | $244.38 | 36% |