Greater Brisbane Airbnb Market Analysis 2025: Short Term Rental Data & Vacation Rental Statistics in Queensland, Australia
Is Airbnb profitable in Greater Brisbane in 2025? Explore comprehensive Airbnb analytics for Greater Brisbane, Queensland, Australia to uncover income potential. This 2025 STR market report for Greater Brisbane, based on AirROI data from April 2024 to March 2025, reveals key trends in the bustling market of 5,142 active listings.
Whether you're considering an Airbnb investment in Greater Brisbane, optimizing your existing vacation rental, or exploring rental arbitrage opportunities, understanding the Greater Brisbane Airbnb data is crucial. Leveraging the low regulation environment is key to maximizing your short term rental income potential. Let's dive into the specifics.
Key Greater Brisbane Airbnb Performance Metrics Overview
Monthly Airbnb Revenue Variations & Income Potential in Greater Brisbane (2025)
Understanding the monthly revenue variations for Airbnb listings in Greater Brisbane is key to maximizing your short term rental income potential. Seasonality significantly impacts earnings. Our analysis, based on data from the past 12 months, shows that the peak revenue month for STRs in Greater Brisbane is typically December, while March often presents the lowest earnings, highlighting opportunities for strategic pricing adjustments during shoulder and low seasons. Explore the typical Airbnb income in Greater Brisbane across different performance tiers:
- Best-in-class properties (Top 10%) achieve $5,835+ monthly, often utilizing dynamic pricing and superior guest experiences.
- Strong performing properties (Top 25%) earn $3,979 or more, indicating effective management and desirable locations/amenities.
- Typical properties (Median) generate around $2,469 per month, representing the average market performance.
- Entry-level properties (Bottom 25%) see earnings around $1,288, often with potential for optimization.
Average Monthly Airbnb Earnings Trend in Greater Brisbane
Greater Brisbane Airbnb Occupancy Rate Trends (2025)
Maximize your bookings by understanding the Greater Brisbane STR occupancy trends. Seasonal demand shifts significantly influence how often properties are booked. Typically, Julysees the highest demand (peak season occupancy), while June experiences the lowest (low season). Effective strategies, like adjusting minimum stays or offering promotions, can boost occupancy during slower periods. Here's how different property tiers perform in Greater Brisbane:
- Best-in-class properties (Top 10%) achieve 90%+ occupancy, indicating high desirability and potentially optimized availability.
- Strong performing properties (Top 25%) maintain 79% or higher occupancy, suggesting good market fit and guest satisfaction.
- Typical properties (Median) have an occupancy rate around 58%.
- Entry-level properties (Bottom 25%) average 30% occupancy, potentially facing higher vacancy.
Average Monthly Occupancy Rate Trend in Greater Brisbane
Average Daily Rate (ADR) Airbnb Trends in Greater Brisbane (2025)
Effective short term rental pricing strategy in Greater Brisbane involves understanding monthly ADR fluctuations. The Average Daily Rate (ADR) for Airbnb in Greater Brisbane typically peaks in December and dips lowest during August. Leveraging Airbnb dynamic pricing tools or strategies based on this seasonality can significantly boost revenue. Here's a look at the typical nightly rates achieved:
- Best-in-class properties (Top 10%) command rates of $328+ per night, often due to premium features or locations.
- Strong performing properties (Top 25%) achieve nightly rates of $210 or more.
- Typical properties (Median) charge around $136 per night.
- Entry-level properties (Bottom 25%) earn around $81 per night.
Average Daily Rate (ADR) Trend by Month in Greater Brisbane
Get Live Greater Brisbane Market Intelligence 👇

Explore Real-time Analytics
Airbnb Seasonality Analysis & Trends in Greater Brisbane (2025)
Peak Season (December, November, April)
- Revenue averages $3,469 per month
- Occupancy rates average 56.0%
- Daily rates average $193
Shoulder Season
- Revenue averages $3,121 per month
- Occupancy maintains around 53.9%
- Daily rates hold near $173
Low Season (February, March, August)
- Revenue drops to average $2,596 per month
- Occupancy decreases to average 53.1%
- Daily rates adjust to average $175
Seasonality Insights for Greater Brisbane
- The Airbnb seasonality in Greater Brisbane shows moderate seasonality with distinct peak and low periods. While the sections above show seasonal averages, it's also insightful to look at the extremes:
- During the high season, the absolute peak month showcases Greater Brisbane's highest earning potential, with monthly revenues capable of climbing to $3,851, occupancy reaching a high of 59.4%, and ADRs peaking at $221.
- Conversely, the slowest single month of the year, typically falling within the low season, marks the market's lowest point. In this month, revenue might dip to $2,376, occupancy could drop to 46.4%, and ADRs may adjust down to $161.
- Understanding both the seasonal averages and these monthly peaks and troughs in revenue, occupancy, and ADR is crucial for maximizing your Airbnb profit potential in Greater Brisbane.
Seasonal Strategies for Maximizing Profit
- Peak Season: Maximize revenue through premium pricing and potentially longer minimum stays. Ensure high availability.
- Low Season: Offer competitive pricing, special promotions (e.g., extended stay discounts), and flexible cancellation policies. Target off-season travelers like remote workers or budget-conscious guests.
- Shoulder Seasons: Implement dynamic pricing that balances peak and low rates. Target weekend travelers or specific events. Offer slightly more flexible terms than peak season.
- Regularly analyze your own performance against these Greater Brisbane seasonality benchmarks and adjust your pricing and availability strategy accordingly.
Best Areas for Airbnb Investment in Greater Brisbane (2025)
Exploring the top neighborhoods for short-term rentals in Greater Brisbane? This section highlights key areas, outlining why they are attractive for hosts and guests, along with notable local attractions. Consider these locations based on your target guest profile and investment strategy.
| Neighborhood / Area | Why Host Here? (Target Guests & Appeal) | Key Attractions & Landmarks |
|---|---|---|
| South Bank | A cultural hub with stunning parklands, riverside walkways, and an array of dining options. It's popular among tourists for its proximity to attractions like the Queensland Art Gallery and the South Bank Parklands. | South Bank Parklands, Queensland Art Gallery, Cultural Forecourt, Streets Beach, Brisbane Skyneedle, Shop til you drop at Little Stanley Street |
| Fortitude Valley | Known for its vibrant nightlife, trendy bars, and live music scene. A hotspot for younger crowds and those looking for entertainment and culture. | Brunswick Street, Cloudland, Valley Metro, Fortitude Valley Music Hall, James Street, Live music venues |
| West End | A bohemian neighborhood with a diverse culture, known for its eclectic market and vibrant arts scene. Appeals to those seeking a unique, local experience. | Boundary Street Markets, West End Markets, Theatre Republic, Gumboots Cafe, Local art galleries, South Bank nearby |
| Paddington | A charming suburb with beautiful Queenslander homes, boutique shops, and local cafes. It's an attractive area for families and tourists looking for character. | Given Terrace, Paddington Antique Centre, Suncorp Stadium nearby, Local cafes and eateries, Parks and green spaces, Shopping precincts |
| New Farm | A trendy area known for its parks and proximity to the Brisbane River. Provides an urban lifestyle with a mix of modern and classic architecture. | New Farm Park, Brisbane Powerhouse, Emporium, Riverwalk, James Street, Local markets |
| Taringa | A quiet and leafy suburb that offers great access to University of Queensland and is popular with students and families alike. | University of Queensland, Toowong Village, Indooroopilly Shopping Centre nearby, Local parks, Cafes and eateries |
| Cleveland | A coastal suburb that offers beautiful bayside views and a relaxed atmosphere. Attractive for those wanting beach proximity without being far from the city. | Raby Bay, Cleveland Markets, Moreton Bay, Cleveland Point, Local beaches, Jet skiing and boating activities |
| Brisbane CBD | The heart of the city, offering a range of shops, dining, and entertainment options. Ideal for business travelers and tourists alike. | Queen Street Mall, Brisbane Riverwalk, Story Bridge, South Bank nearby, Botanic Gardens, Cultural precinct |
Understanding Airbnb License Requirements & STR Laws in Greater Brisbane (2025)
While Greater Brisbane, Queensland, Australia currently shows low STR regulations, specific Airbnb license requirements might still exist or change. Always verify the latest short term rental regulations and Airbnb license requirements directly with local government authorities for Greater Brisbane to ensure full compliance before hosting.
(Source: AirROI data, 2025, based on 0% licensed listings)
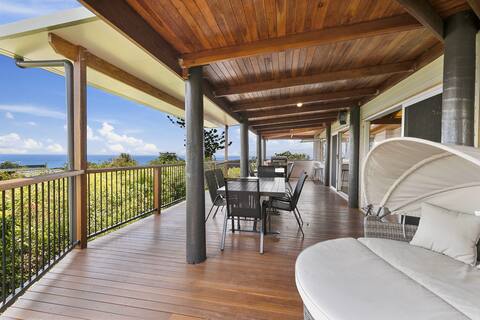
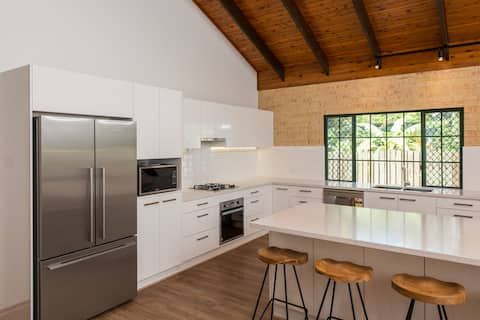
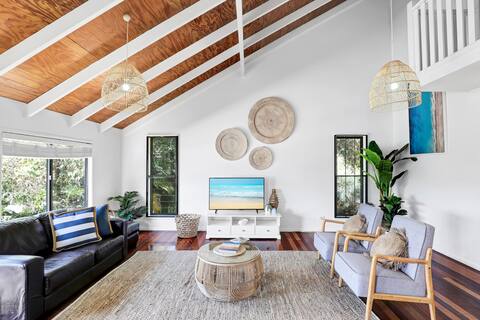
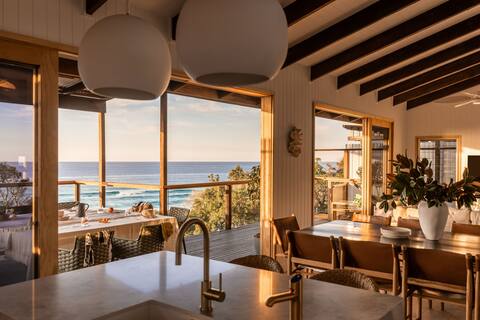
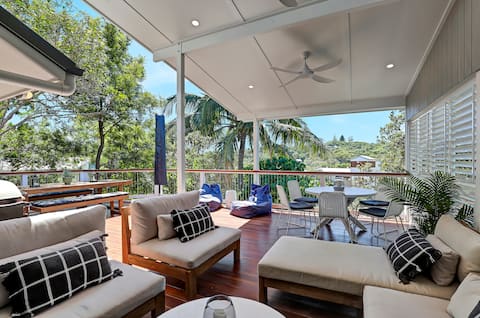
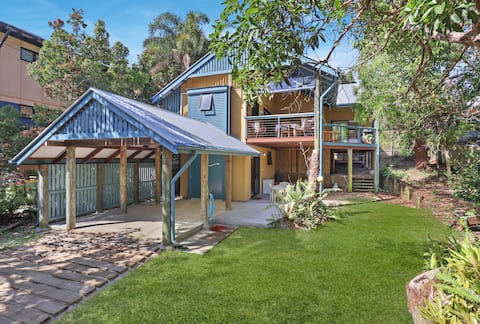
Top Performing Airbnb Properties in Greater Brisbane (2025)
Benchmark your potential! Explore examples of top-performing Airbnb properties in Greater Brisbanebased on Trailing Twelve Month (TTM) revenue. Analyze their characteristics, revenue, occupancy rate, and ADR to understand what drives success in this market.
8 Yarrong Road | 4 Bedroom, 3 Bathroom, Sleeps 8
Entire Place • 4 bedrooms
Bedella | 6 Bedroom, 2 Bathroom, Sleeps 12
Entire Place • 6 bedrooms
My Island Home
Entire Place • 5 bedrooms
Green House on Cutter
Entire Place • 6 bedrooms
Grevillea
Entire Place • 3 bedrooms
70 Mooloomba Rd Straddie Hideout | 4 Bd 3 Bt sps 8
Entire Place • 4 bedrooms
Note: Performance varies based on location, size, amenities, seasonality, and management quality. Data reflects the past 12 months.
Top Performing Airbnb Hosts in Greater Brisbane (2025)
Learn from the best! This table showcases top-performing Airbnb hosts in Greater Brisbane based on the number of properties managed and estimated total revenue over the past year. Analyze their scale and performance metrics.
| Host Name | Properties | Grossing Revenue | Stay Reviews | Avg Rating |
|---|---|---|---|---|
| Lee And Bella | 229 | $11,055,079 | 24620 | 4.70/5.0 |
| Ray White Straddie | 92 | $9,081,202 | 1000 | 3.98/5.0 |
| Olivia | 90 | $4,421,359 | 3052 | 4.39/5.0 |
| Andy | 95 | $4,378,461 | 5748 | 4.89/5.0 |
| MadeComfy | 83 | $2,739,971 | 1937 | 4.08/5.0 |
| Melanie | 37 | $2,576,464 | 891 | 4.72/5.0 |
| Dolphin Accommodation | 43 | $2,232,983 | 915 | 4.36/5.0 |
| First | 101 | $2,114,660 | 575 | 3.31/5.0 |
| Holiday Hub Bribie Island | 79 | $1,813,995 | 1004 | 3.96/5.0 |
| Colin | 39 | $1,733,634 | 271 | 3.55/5.0 |
Analyzing the strategies of top hosts, such as their property selection, pricing, and guest communication, can offer valuable lessons for optimizing your own Airbnb operations in Greater Brisbane.
Dive Deeper: Advanced Greater Brisbane STR Market Data (2025)
Ready to unlock more insights? AirROI provides access to advanced metrics and comprehensive Airbnb data for Greater Brisbane. Explore detailed analytics beyond this report to refine your investment strategy, optimize pricing, and maximize your vacation rental profits.
Explore Advanced MetricsGreater Brisbane Short-Term Rental Market Composition (2025): Property & Room Types
Room Type Distribution
Property Type Distribution
Market Composition Insights for Greater Brisbane
- The Greater Brisbane Airbnb market composition is heavily skewed towards Entire Home/Apt listings, which make up 80.8% of the 5,142 active rentals. This indicates strong guest preference for privacy and space.
- Looking at the property type distribution in Greater Brisbane, Apartment/Condo properties are the most common (45.6%), reflecting the local real estate landscape.
- Houses represent a significant 41.4% portion, catering likely to families or larger groups.
- The presence of 5.8% Hotel/Boutique listings indicates integration with traditional hospitality.
- Smaller segments like outdoor/unique, unique stays (combined 1.8%) offer potential for unique stay experiences.
Greater Brisbane Airbnb Room Capacity Analysis (2025): Bedroom Distribution
Distribution of Listings by Number of Bedrooms
Room Capacity Insights for Greater Brisbane
- The dominant room capacity in Greater Brisbane is 1 bedroom listings, making up 31.4% of the market. This suggests a strong demand for properties suitable for couples or solo travelers.
- Together, 1 bedroom and 2 bedrooms properties represent 58.9% of the active Airbnb listings in Greater Brisbane, indicating a high concentration in these sizes.
- A significant 26.9% of listings offer 3+ bedrooms, catering to larger groups and families seeking more space in Greater Brisbane.
Greater Brisbane Vacation Rental Guest Capacity Trends (2025)
Distribution of Listings by Guest Capacity
Guest Capacity Insights for Greater Brisbane
- The most common guest capacity trend in Greater Brisbane vacation rentals is listings accommodating 2 guests (24.5%). This suggests the primary traveler segment is likely couples or solo travelers.
- Properties designed for 2 guests and 4 guests dominate the Greater Brisbane STR market, accounting for 47.2% of listings.
- 28.4% of properties accommodate 6+ guests, serving the market segment for larger families or group travel in Greater Brisbane.
- On average, properties in Greater Brisbane are equipped to host 3.8 guests.
Greater Brisbane Airbnb Booking Patterns (2025): Available vs. Booked Days
Available Days Distribution
Booked Days Distribution
Booking Pattern Insights for Greater Brisbane
- The most common availability pattern in Greater Brisbane falls within the 91-180 days range, representing 28.6% of listings. This suggests many properties have significant open periods on their calendars.
- Approximately 51.2% of listings show high availability (181+ days open annually), indicating potential for increased bookings or specific owner usage patterns.
- For booked days, the 181-270 days range is most frequent in Greater Brisbane (28.5%), reflecting common guest stay durations or potential owner blocking patterns.
- A notable 50.3% of properties secure long booking periods (181+ days booked per year), highlighting successful long-term rental strategies or significant owner usage.
Greater Brisbane Airbnb Minimum Stay Requirements Analysis
Distribution of Listings by Minimum Night Requirement
1 Night
1115 listings
23.6% of total
2 Nights
1188 listings
25.2% of total
3 Nights
650 listings
13.8% of total
4-6 Nights
457 listings
9.7% of total
7-29 Nights
251 listings
5.3% of total
30+ Nights
1059 listings
22.4% of total
Key Insights
- The most prevalent minimum stay requirement in Greater Brisbane is 2 Nights, adopted by 25.2% of listings. This highlights the market's preference for shorter, flexible bookings.
- A significant segment (22.4%) caters to monthly stays (30+ nights) in Greater Brisbane, pointing to opportunities in the extended-stay market.
Recommendations
- Align with the market by considering a 2 Nights minimum stay, as 25.2% of Greater Brisbane hosts use this setting.
- If feasible, allowing 1-night stays, especially midweek or during low season, could capture last-minute bookings, as only 23.6% currently do.
- Explore offering discounts for stays of 30+ nights to attract the 22.4% of the market seeking extended stays.
- Adjust minimum nights based on seasonality – potentially shorter during low season and longer during peak demand periods in Greater Brisbane.
Greater Brisbane Airbnb Cancellation Policy Trends Analysis (2025)
Super Strict 30 Days
196 listings
4.4% of total
Super Strict 60 Days
133 listings
3% of total
Flexible
809 listings
18% of total
Moderate
1518 listings
33.8% of total
Firm
932 listings
20.7% of total
Strict
904 listings
20.1% of total
Cancellation Policy Insights for Greater Brisbane
- The prevailing Airbnb cancellation policy trend in Greater Brisbane is Moderate, used by 33.8% of listings.
- There's a relatively balanced mix between guest-friendly (51.8%) and stricter (40.8%) policies, offering choices for different guest needs.
Recommendations for Hosts
- Consider adopting a Moderate policy to align with the 33.8% market standard in Greater Brisbane.
- Regularly review your cancellation policy against competitors and market demand shifts in Greater Brisbane.
Greater Brisbane STR Booking Lead Time Analysis (2025)
Average Booking Lead Time by Month
Booking Lead Time Insights for Greater Brisbane
- The overall average booking lead time for vacation rentals in Greater Brisbane is 45 days.
- Guests book furthest in advance for stays during May (average 66 days), likely coinciding with peak travel demand or local events.
- The shortest booking windows occur for stays in August (average 41 days), indicating more last-minute travel plans during this time.
- Seasonally, Spring (55 days avg.) sees the longest lead times, while Summer (49 days avg.) has the shortest, reflecting typical travel planning cycles.
Recommendations for Hosts
- Use the overall average lead time (45 days) as a baseline for your pricing and availability strategy in Greater Brisbane.
- For May stays, consider implementing length-of-stay discounts or slightly higher rates for bookings made less than 66 days out to capitalize on advance planning.
- Target marketing efforts for the Spring season well in advance (at least 55 days) to capture early planners.
- Monitor your own booking lead times against these Greater Brisbane averages to identify opportunities for dynamic pricing adjustments.
Popular & Essential Airbnb Amenities in Greater Brisbane (2025)
Amenity Prevalence
Amenity Insights for Greater Brisbane
- Essential amenities in Greater Brisbane that guests expect include: Smoke alarm. Lacking these (this) could significantly impact bookings.
- Popular amenities like Kitchen, TV, Wifi are common but not universal. Offering these can provide a competitive edge.
- Warning: Wifi is not universally provided but is considered essential globally. Ensure reliable Wifi is offered.
Recommendations for Hosts
- Ensure your listing includes all essential amenities for Greater Brisbane: Smoke alarm.
- Prioritize adding missing essentials: Smoke alarm.
- Consider adding popular differentiators like Kitchen or TV to increase appeal.
- Highlight unique or less common amenities you offer (e.g., hot tub, dedicated workspace, EV charger) in your listing description and photos.
- Regularly check competitor amenities in Greater Brisbane to stay competitive.
Greater Brisbane Airbnb Guest Demographics & Profile Analysis (2025)
Guest Profile Summary for Greater Brisbane
- The typical guest profile for Airbnb in Greater Brisbane consists of primarily domestic travelers (75%), often arriving from nearby Brisbane, typically belonging to the Post-2000s (Gen Z/Alpha) group (50%), primarily speaking English or Chinese.
- Domestic travelers account for 75.2% of guests.
- Key international markets include Australia (75.2%) and New Zealand (4.9%).
- Top languages spoken are English (66.8%) followed by Chinese (4.9%).
- A significant demographic segment is the Post-2000s (Gen Z/Alpha) group, representing 50% of guests.
Recommendations for Hosts
- Target domestic marketing efforts towards travelers from Brisbane and Melbourne.
- Tailor amenities and listing descriptions to appeal to the dominant Post-2000s (Gen Z/Alpha) demographic (e.g., highlight fast WiFi, smart home features, local guides).
- Highlight unique local experiences or amenities relevant to the primary guest profile.
- Consider seasonal promotions aligned with peak travel times for key origin markets.
Nearby Short-Term Rental Market Comparison
How does the Greater Brisbane Airbnb market stack up against its neighbors? Compare key performance metrics like average monthly revenue, ADR, and occupancy rates in surrounding areas to understand the broader regional STR landscape.
| Market | Active Properties | Monthly Revenue | Daily Rate | Avg. Occupancy |
|---|---|---|---|---|
| Castaways Beach | 17 | $5,430 | $517.24 | 47% |
| Byron Bay | 952 | $4,207 | $425.18 | 43% |
| Noosa Heads | 1,002 | $4,142 | $382.10 | 48% |
| Byron Shire Council | 206 | $3,945 | $428.48 | 42% |
| Ewingsdale | 67 | $3,804 | $487.49 | 37% |
| Kingscliff | 336 | $3,683 | $376.49 | 41% |
| Sunrise Beach | 110 | $3,666 | $357.47 | 48% |
| Casuarina Beach | 138 | $3,646 | $407.62 | 42% |
| Sunshine Beach | 289 | $3,550 | $402.94 | 42% |
| Clunes | 18 | $3,531 | $285.32 | 41% |