Glen Aplin Airbnb Market Analysis 2025: Short Term Rental Data & Vacation Rental Statistics in Queensland, Australia
Is Airbnb profitable in Glen Aplin in 2025? Explore comprehensive Airbnb analytics for Glen Aplin, Queensland, Australia to uncover income potential. This 2025 STR market report for Glen Aplin, based on AirROI data from April 2024 to March 2025, reveals key trends in the niche market of 19 active listings.
Whether you're considering an Airbnb investment in Glen Aplin, optimizing your existing vacation rental, or exploring rental arbitrage opportunities, understanding the Glen Aplin Airbnb data is crucial. Leveraging the low regulation environment is key to maximizing your short term rental income potential. Let's dive into the specifics.
Key Glen Aplin Airbnb Performance Metrics Overview
Monthly Airbnb Revenue Variations & Income Potential in Glen Aplin (2025)
Understanding the monthly revenue variations for Airbnb listings in Glen Aplin is key to maximizing your short term rental income potential. Seasonality significantly impacts earnings. Our analysis, based on data from the past 12 months, shows that the peak revenue month for STRs in Glen Aplin is typically April, while February often presents the lowest earnings, highlighting opportunities for strategic pricing adjustments during shoulder and low seasons. Explore the typical Airbnb income in Glen Aplin across different performance tiers:
- Best-in-class properties (Top 10%) achieve $3,567+ monthly, often utilizing dynamic pricing and superior guest experiences.
- Strong performing properties (Top 25%) earn $2,826 or more, indicating effective management and desirable locations/amenities.
- Typical properties (Median) generate around $1,417 per month, representing the average market performance.
- Entry-level properties (Bottom 25%) see earnings around $677, often with potential for optimization.
Average Monthly Airbnb Earnings Trend in Glen Aplin
Glen Aplin Airbnb Occupancy Rate Trends (2025)
Maximize your bookings by understanding the Glen Aplin STR occupancy trends. Seasonal demand shifts significantly influence how often properties are booked. Typically, Julysees the highest demand (peak season occupancy), while February experiences the lowest (low season). Effective strategies, like adjusting minimum stays or offering promotions, can boost occupancy during slower periods. Here's how different property tiers perform in Glen Aplin:
- Best-in-class properties (Top 10%) achieve 61%+ occupancy, indicating high desirability and potentially optimized availability.
- Strong performing properties (Top 25%) maintain 37% or higher occupancy, suggesting good market fit and guest satisfaction.
- Typical properties (Median) have an occupancy rate around 24%.
- Entry-level properties (Bottom 25%) average 12% occupancy, potentially facing higher vacancy.
Average Monthly Occupancy Rate Trend in Glen Aplin
Average Daily Rate (ADR) Airbnb Trends in Glen Aplin (2025)
Effective short term rental pricing strategy in Glen Aplin involves understanding monthly ADR fluctuations. The Average Daily Rate (ADR) for Airbnb in Glen Aplin typically peaks in January and dips lowest during February. Leveraging Airbnb dynamic pricing tools or strategies based on this seasonality can significantly boost revenue. Here's a look at the typical nightly rates achieved:
- Best-in-class properties (Top 10%) command rates of $283+ per night, often due to premium features or locations.
- Strong performing properties (Top 25%) achieve nightly rates of $228 or more.
- Typical properties (Median) charge around $169 per night.
- Entry-level properties (Bottom 25%) earn around $138 per night.
Average Daily Rate (ADR) Trend by Month in Glen Aplin
Get Live Glen Aplin Market Intelligence 👇

Explore Real-time Analytics
Airbnb Seasonality Analysis & Trends in Glen Aplin (2025)
Peak Season (April, May, July)
- Revenue averages $2,800 per month
- Occupancy rates average 36.5%
- Daily rates average $187
Shoulder Season
- Revenue averages $1,806 per month
- Occupancy maintains around 29.1%
- Daily rates hold near $189
Low Season (January, February, March)
- Revenue drops to average $974 per month
- Occupancy decreases to average 20.2%
- Daily rates adjust to average $188
Seasonality Insights for Glen Aplin
- The Airbnb seasonality in Glen Aplin shows highly seasonal trends requiring careful strategy. While the sections above show seasonal averages, it's also insightful to look at the extremes:
- During the high season, the absolute peak month showcases Glen Aplin's highest earning potential, with monthly revenues capable of climbing to $3,053, occupancy reaching a high of 44.2%, and ADRs peaking at $194.
- Conversely, the slowest single month of the year, typically falling within the low season, marks the market's lowest point. In this month, revenue might dip to $743, occupancy could drop to 17.4%, and ADRs may adjust down to $185.
- Understanding both the seasonal averages and these monthly peaks and troughs in revenue, occupancy, and ADR is crucial for maximizing your Airbnb profit potential in Glen Aplin.
Seasonal Strategies for Maximizing Profit
- Peak Season: Maximize revenue through premium pricing and potentially longer minimum stays. Ensure high availability.
- Low Season: Offer competitive pricing, special promotions (e.g., extended stay discounts), and flexible cancellation policies. Target off-season travelers like remote workers or budget-conscious guests.
- Shoulder Seasons: Implement dynamic pricing that balances peak and low rates. Target weekend travelers or specific events. Offer slightly more flexible terms than peak season.
- Regularly analyze your own performance against these Glen Aplin seasonality benchmarks and adjust your pricing and availability strategy accordingly.
Best Areas for Airbnb Investment in Glen Aplin (2025)
Exploring the top neighborhoods for short-term rentals in Glen Aplin? This section highlights key areas, outlining why they are attractive for hosts and guests, along with notable local attractions. Consider these locations based on your target guest profile and investment strategy.
| Neighborhood / Area | Why Host Here? (Target Guests & Appeal) | Key Attractions & Landmarks |
|---|---|---|
| Stanley | A popular location near the picturesque wineries and beautiful landscapes of the Granite Belt. Ideal for tourists interested in wine tasting and outdoor activities. | Granite Belt Wine Country, Girraween National Park, Storm King Dam, Ballandean Estate Wines, Symphony Hill Wines |
| Belford | A quiet rural area surrounded by nature, perfect for guests seeking tranquility and a peaceful retreat. Close to various national parks and scenic spots. | Belford Valley, Bald Rock National Park, Sundown National Park, Waterfall Creek, local farms |
| Tenterfield | Known for its historical significance and quaint charm, this town attracts visitors interested in Australian history and regional culture. | Tenterfield Railway Station, Sir Henry Parkes School of Arts, the Tenterfield Golf Club, historic pubs and shops, the local market |
| Stanthorpe | A vibrant town famous for its cool climate and wineries, it offers a perfect experience for food and wine lovers. | Stanthorpe Heritage Museum, Apple Thief Wines, Ricca's Woodfire Pizzas, Stanthorpe Plaza, Botanical Gardens |
| Killarney | Lies near natural wonders, ideal for hiking and outdoor activities. A hidden gem for those escaping city life. | Queen Mary Falls, Binalong Falls, Killarney State Forest, local hiking trails, picnic areas |
| Warwick | A larger regional center with diverse attractions, appealing to families and business travelers alike. Offers good amenities and local events. | Warwick Cultural Centre, Rose City Shopping World, Wirral Creek, local festivals, historic architecture |
| Inglewood | A peaceful rural community popular with visitors looking to experience country life and the beautiful natural environment. | Inglewood Historical Society, local agricultural shows, nature walks, Queensland parks, community events |
| Allora | A small, charming town with friendly locals and a rich agricultural background. Great for visitors wanting to experience local culture. | Allora Heritage Centre, local markets, Allora State School Museum, community parks, events throughout the year |
Understanding Airbnb License Requirements & STR Laws in Glen Aplin (2025)
While Glen Aplin, Queensland, Australia currently shows low STR regulations, specific Airbnb license requirements might still exist or change. Always verify the latest short term rental regulations and Airbnb license requirements directly with local government authorities for Glen Aplin to ensure full compliance before hosting.
(Source: AirROI data, 2025, finding no licensed listings among those analyzed)
Top Performing Airbnb Properties in Glen Aplin (2025)
Benchmark your potential! Explore examples of top-performing Airbnb properties in Glen Aplinbased on Trailing Twelve Month (TTM) revenue. Analyze their characteristics, revenue, occupancy rate, and ADR to understand what drives success in this market.

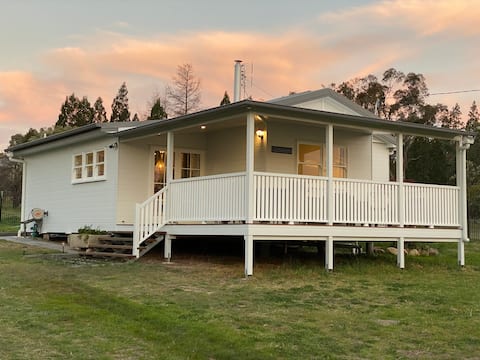
Hamlyn Farmhouse, Broadwater near Stanthorpe
Entire Place • 3 bedrooms

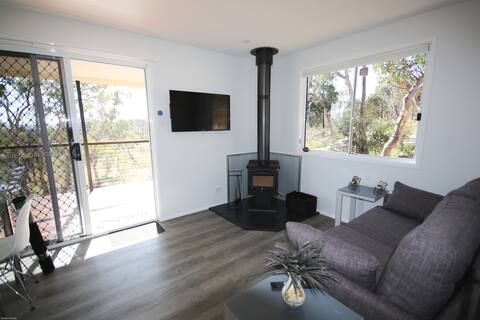
Glen Lough Cabins Teach na Pooka
Entire Place • 1 bedroom
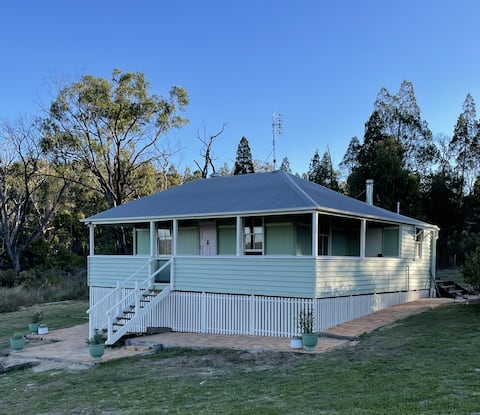
Stanthorpe - Glenview Cottage
Entire Place • 3 bedrooms
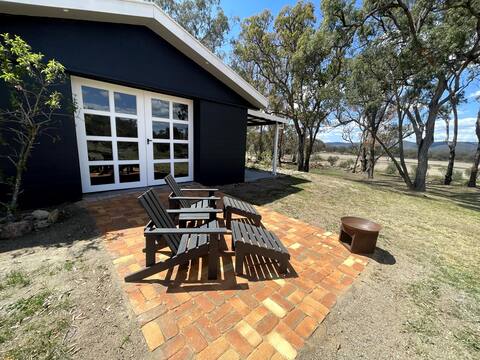
Glen Lough Cabins - Teach Bean Si
Entire Place • 1 bedroom
The Packing Shed - Glen Aplin
Entire Place • 1 bedroom
The Nurses Quarters
Entire Place • 2 bedrooms
Note: Performance varies based on location, size, amenities, seasonality, and management quality. Data reflects the past 12 months.
Top Performing Airbnb Hosts in Glen Aplin (2025)
Learn from the best! This table showcases top-performing Airbnb hosts in Glen Aplin based on the number of properties managed and estimated total revenue over the past year. Analyze their scale and performance metrics.
| Host Name | Properties | Grossing Revenue | Stay Reviews | Avg Rating |
|---|---|---|---|---|
| Sheila | 4 | $86,666 | 7 | 1.25/5.0 |
| Lou | 3 | $65,428 | 130 | 4.96/5.0 |
| Rob | 1 | $47,009 | 169 | 4.96/5.0 |
| Lizzie & Joe | 4 | $31,979 | 22 | 4.92/5.0 |
| Nathan | 1 | $28,507 | 277 | 4.94/5.0 |
| Richard | 3 | $25,264 | 90 | 4.90/5.0 |
| Harrington | 1 | $18,118 | 46 | 4.93/5.0 |
| Sandy | 1 | $15,039 | 15 | 4.93/5.0 |
| Host #33798444 | 1 | $9,988 | 307 | 4.99/5.0 |
Analyzing the strategies of top hosts, such as their property selection, pricing, and guest communication, can offer valuable lessons for optimizing your own Airbnb operations in Glen Aplin.
Dive Deeper: Advanced Glen Aplin STR Market Data (2025)
Ready to unlock more insights? AirROI provides access to advanced metrics and comprehensive Airbnb data for Glen Aplin. Explore detailed analytics beyond this report to refine your investment strategy, optimize pricing, and maximize your vacation rental profits.
Explore Advanced MetricsGlen Aplin Short-Term Rental Market Composition (2025): Property & Room Types
Room Type Distribution
Property Type Distribution
Market Composition Insights for Glen Aplin
- The Glen Aplin Airbnb market composition is heavily skewed towards Entire Home/Apt listings, which make up 78.9% of the 19 active rentals. This indicates strong guest preference for privacy and space.
- Looking at the property type distribution in Glen Aplin, House properties are the most common (63.2%), reflecting the local real estate landscape.
- Houses represent a significant 63.2% portion, catering likely to families or larger groups.
Glen Aplin Airbnb Room Capacity Analysis (2025): Bedroom Distribution
Distribution of Listings by Number of Bedrooms
Room Capacity Insights for Glen Aplin
- The dominant room capacity in Glen Aplin is 1 bedroom listings, making up 42.1% of the market. This suggests a strong demand for properties suitable for couples or solo travelers.
- Together, 1 bedroom and 3 bedrooms properties represent 63.2% of the active Airbnb listings in Glen Aplin, indicating a high concentration in these sizes.
- A significant 21.1% of listings offer 3+ bedrooms, catering to larger groups and families seeking more space in Glen Aplin.
Glen Aplin Vacation Rental Guest Capacity Trends (2025)
Distribution of Listings by Guest Capacity
Guest Capacity Insights for Glen Aplin
- The most common guest capacity trend in Glen Aplin vacation rentals is listings accommodating 2 guests (42.1%). This suggests the primary traveler segment is likely couples or solo travelers.
- Properties designed for 2 guests and 6 guests dominate the Glen Aplin STR market, accounting for 63.2% of listings.
- A significant 42.1% of listings cater specifically to 1-2 guests, highlighting strong demand from couples and solo travelers in Glen Aplin.
- 21.1% of properties accommodate 6+ guests, serving the market segment for larger families or group travel in Glen Aplin.
- On average, properties in Glen Aplin are equipped to host 2.8 guests.
Glen Aplin Airbnb Booking Patterns (2025): Available vs. Booked Days
Available Days Distribution
Booked Days Distribution
Booking Pattern Insights for Glen Aplin
- The most common availability pattern in Glen Aplin falls within the 271-366 days range, representing 63.2% of listings. This suggests many properties have significant open periods on their calendars.
- Approximately 89.5% of listings show high availability (181+ days open annually), indicating potential for increased bookings or specific owner usage patterns.
- For booked days, the 31-90 days range is most frequent in Glen Aplin (57.9%), reflecting common guest stay durations or potential owner blocking patterns.
- A notable 10.6% of properties secure long booking periods (181+ days booked per year), highlighting successful long-term rental strategies or significant owner usage.
Glen Aplin Airbnb Minimum Stay Requirements Analysis
Distribution of Listings by Minimum Night Requirement
1 Night
1 listings
5.6% of total
2 Nights
16 listings
88.9% of total
30+ Nights
1 listings
5.6% of total
Key Insights
- The most prevalent minimum stay requirement in Glen Aplin is 2 Nights, adopted by 88.9% of listings. This highlights the market's preference for shorter, flexible bookings.
- A strong majority (94.5%) of the Glen Aplin Airbnb data shows acceptance of very short stays (1-2 nights), indicating a dynamic, high-turnover market.
Recommendations
- Align with the market by considering a 2 Nights minimum stay, as 88.9% of Glen Aplin hosts use this setting.
- If feasible, allowing 1-night stays, especially midweek or during low season, could capture last-minute bookings, as only 5.6% currently do.
- A 2-night minimum appears standard (88.9%). Consider this for weekends or peak periods.
- Explore offering discounts for stays of 30+ nights to attract the 5.6% of the market seeking extended stays.
- Adjust minimum nights based on seasonality – potentially shorter during low season and longer during peak demand periods in Glen Aplin.
Glen Aplin Airbnb Cancellation Policy Trends Analysis (2025)
Flexible
5 listings
31.3% of total
Moderate
2 listings
12.5% of total
Firm
6 listings
37.5% of total
Strict
3 listings
18.8% of total
Cancellation Policy Insights for Glen Aplin
- The prevailing Airbnb cancellation policy trend in Glen Aplin is Firm, used by 37.5% of listings.
- A majority (56.3%) of hosts in Glen Aplin utilize Firm or Strict policies, indicating a market where hosts prioritize booking security.
Recommendations for Hosts
- Consider adopting a Firm policy to align with the 37.5% market standard in Glen Aplin.
- Regularly review your cancellation policy against competitors and market demand shifts in Glen Aplin.
Glen Aplin STR Booking Lead Time Analysis (2025)
Average Booking Lead Time by Month
Booking Lead Time Insights for Glen Aplin
- The overall average booking lead time for vacation rentals in Glen Aplin is 69 days.
- Guests book furthest in advance for stays during November (average 108 days), likely coinciding with peak travel demand or local events.
- The shortest booking windows occur for stays in January (average 30 days), indicating more last-minute travel plans during this time.
- Seasonally, Summer (94 days avg.) sees the longest lead times, while Winter (59 days avg.) has the shortest, reflecting typical travel planning cycles.
Recommendations for Hosts
- Use the overall average lead time (69 days) as a baseline for your pricing and availability strategy in Glen Aplin.
- For November stays, consider implementing length-of-stay discounts or slightly higher rates for bookings made less than 108 days out to capitalize on advance planning.
- Target marketing efforts for the Summer season well in advance (at least 94 days) to capture early planners.
- Monitor your own booking lead times against these Glen Aplin averages to identify opportunities for dynamic pricing adjustments.
Popular & Essential Airbnb Amenities in Glen Aplin (2025)
Amenity Prevalence
Amenity Insights for Glen Aplin
- Popular amenities like Hot water, Smoke alarm, Free parking on premises are common but not universal. Offering these can provide a competitive edge.
Recommendations for Hosts
- Consider adding popular differentiators like Hot water or Smoke alarm to increase appeal.
- Highlight unique or less common amenities you offer (e.g., hot tub, dedicated workspace, EV charger) in your listing description and photos.
- Regularly check competitor amenities in Glen Aplin to stay competitive.
Glen Aplin Airbnb Guest Demographics & Profile Analysis (2025)
Guest Profile Summary for Glen Aplin
- The typical guest profile for Airbnb in Glen Aplin consists of primarily domestic travelers (96%), often arriving from nearby Brisbane, typically belonging to the Post-2000s (Gen Z/Alpha) group (50%), primarily speaking English or German.
- Domestic travelers account for 96.3% of guests.
- Key international markets include Australia (96.3%) and Singapore (1.5%).
- Top languages spoken are English (70%) followed by German (8%).
- A significant demographic segment is the Post-2000s (Gen Z/Alpha) group, representing 50% of guests.
Recommendations for Hosts
- Target domestic marketing efforts towards travelers from Brisbane and Queensland.
- Tailor amenities and listing descriptions to appeal to the dominant Post-2000s (Gen Z/Alpha) demographic (e.g., highlight fast WiFi, smart home features, local guides).
- Highlight unique local experiences or amenities relevant to the primary guest profile.
- Consider seasonal promotions aligned with peak travel times for key origin markets.
Nearby Short-Term Rental Market Comparison
How does the Glen Aplin Airbnb market stack up against its neighbors? Compare key performance metrics like average monthly revenue, ADR, and occupancy rates in surrounding areas to understand the broader regional STR landscape.
| Market | Active Properties | Monthly Revenue | Daily Rate | Avg. Occupancy |
|---|---|---|---|---|
| Tenterfield Shire Council | 10 | $2,863 | $188.34 | 50% |
| Somerset Regional | 54 | $2,748 | $217.48 | 43% |
| Ballandean | 22 | $2,719 | $288.70 | 34% |
| Boonah | 14 | $2,635 | $155.84 | 54% |
| Stanthorpe | 70 | $2,575 | $206.85 | 43% |
| Warwick | 28 | $2,541 | $184.46 | 53% |
| Tenterfield | 42 | $2,382 | $194.65 | 40% |
| Southern Downs Regional | 91 | $2,288 | $229.21 | 40% |
| Lockyer Valley Regional | 20 | $2,208 | $148.83 | 55% |
| Toowoomba | 279 | $2,196 | $136.95 | 56% |