Eurong Airbnb Market Analysis 2025: Short Term Rental Data & Vacation Rental Statistics in Queensland, Australia
Is Airbnb profitable in Eurong in 2025? Explore comprehensive Airbnb analytics for Eurong, Queensland, Australia to uncover income potential. This 2025 STR market report for Eurong, based on AirROI data from April 2024 to March 2025, reveals key trends in the niche market of 24 active listings.
Whether you're considering an Airbnb investment in Eurong, optimizing your existing vacation rental, or exploring rental arbitrage opportunities, understanding the Eurong Airbnb data is crucial. Leveraging the low regulation environment is key to maximizing your short term rental income potential. Let's dive into the specifics.
Key Eurong Airbnb Performance Metrics Overview
Monthly Airbnb Revenue Variations & Income Potential in Eurong (2025)
Understanding the monthly revenue variations for Airbnb listings in Eurong is key to maximizing your short term rental income potential. Seasonality significantly impacts earnings. Our analysis, based on data from the past 12 months, shows that the peak revenue month for STRs in Eurong is typically December, while March often presents the lowest earnings, highlighting opportunities for strategic pricing adjustments during shoulder and low seasons. Explore the typical Airbnb income in Eurong across different performance tiers:
- Best-in-class properties (Top 10%) achieve $6,452+ monthly, often utilizing dynamic pricing and superior guest experiences.
- Strong performing properties (Top 25%) earn $5,274 or more, indicating effective management and desirable locations/amenities.
- Typical properties (Median) generate around $3,708 per month, representing the average market performance.
- Entry-level properties (Bottom 25%) see earnings around $2,411, often with potential for optimization.
Average Monthly Airbnb Earnings Trend in Eurong
Eurong Airbnb Occupancy Rate Trends (2025)
Maximize your bookings by understanding the Eurong STR occupancy trends. Seasonal demand shifts significantly influence how often properties are booked. Typically, Decembersees the highest demand (peak season occupancy), while June experiences the lowest (low season). Effective strategies, like adjusting minimum stays or offering promotions, can boost occupancy during slower periods. Here's how different property tiers perform in Eurong:
- Best-in-class properties (Top 10%) achieve 83%+ occupancy, indicating high desirability and potentially optimized availability.
- Strong performing properties (Top 25%) maintain 74% or higher occupancy, suggesting good market fit and guest satisfaction.
- Typical properties (Median) have an occupancy rate around 53%.
- Entry-level properties (Bottom 25%) average 33% occupancy, potentially facing higher vacancy.
Average Monthly Occupancy Rate Trend in Eurong
Average Daily Rate (ADR) Airbnb Trends in Eurong (2025)
Effective short term rental pricing strategy in Eurong involves understanding monthly ADR fluctuations. The Average Daily Rate (ADR) for Airbnb in Eurong typically peaks in January and dips lowest during March. Leveraging Airbnb dynamic pricing tools or strategies based on this seasonality can significantly boost revenue. Here's a look at the typical nightly rates achieved:
- Best-in-class properties (Top 10%) command rates of $352+ per night, often due to premium features or locations.
- Strong performing properties (Top 25%) achieve nightly rates of $231 or more.
- Typical properties (Median) charge around $198 per night.
- Entry-level properties (Bottom 25%) earn around $186 per night.
Average Daily Rate (ADR) Trend by Month in Eurong
Get Live Eurong Market Intelligence 👇

Explore Real-time Analytics
Airbnb Seasonality Analysis & Trends in Eurong (2025)
Peak Season (December, May, January)
- Revenue averages $5,163 per month
- Occupancy rates average 64.1%
- Daily rates average $238
Shoulder Season
- Revenue averages $4,017 per month
- Occupancy maintains around 55.0%
- Daily rates hold near $226
Low Season (February, March, July)
- Revenue drops to average $2,484 per month
- Occupancy decreases to average 39.6%
- Daily rates adjust to average $213
Seasonality Insights for Eurong
- The Airbnb seasonality in Eurong shows highly seasonal trends requiring careful strategy. While the sections above show seasonal averages, it's also insightful to look at the extremes:
- During the high season, the absolute peak month showcases Eurong's highest earning potential, with monthly revenues capable of climbing to $5,667, occupancy reaching a high of 72.2%, and ADRs peaking at $250.
- Conversely, the slowest single month of the year, typically falling within the low season, marks the market's lowest point. In this month, revenue might dip to $2,295, occupancy could drop to 28.3%, and ADRs may adjust down to $210.
- Understanding both the seasonal averages and these monthly peaks and troughs in revenue, occupancy, and ADR is crucial for maximizing your Airbnb profit potential in Eurong.
Seasonal Strategies for Maximizing Profit
- Peak Season: Maximize revenue through premium pricing and potentially longer minimum stays. Ensure high availability.
- Low Season: Offer competitive pricing, special promotions (e.g., extended stay discounts), and flexible cancellation policies. Target off-season travelers like remote workers or budget-conscious guests.
- Shoulder Seasons: Implement dynamic pricing that balances peak and low rates. Target weekend travelers or specific events. Offer slightly more flexible terms than peak season.
- Regularly analyze your own performance against these Eurong seasonality benchmarks and adjust your pricing and availability strategy accordingly.
Best Areas for Airbnb Investment in Eurong (2025)
Exploring the top neighborhoods for short-term rentals in Eurong? This section highlights key areas, outlining why they are attractive for hosts and guests, along with notable local attractions. Consider these locations based on your target guest profile and investment strategy.
| Neighborhood / Area | Why Host Here? (Target Guests & Appeal) | Key Attractions & Landmarks |
|---|---|---|
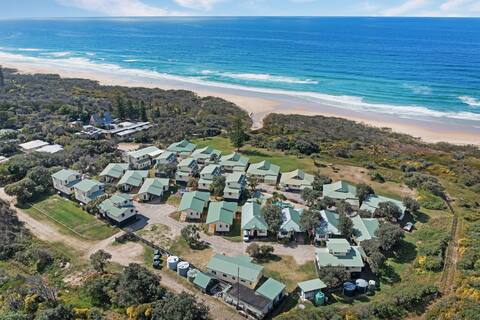
| Eurong Beach | A stunning beach location offering direct access to the waters of the Great Sandy Strait and the beautiful Fraser Island. | Fraser Island, Rainbow Beach, Lake McKenzie, Eurong Beach Resort, Maheno Shipwreck, Central Station |
| Fraser Island | The world's largest sand island, famous for its natural beauty and unique ecosystems, attractive for nature lovers and adventure seekers. | Eli Creek, Garry's Lighthouse, Champagne Pools, The Pinnacles, Lake Wabby, Cathedrals |
| Rainbow Beach | Known for its colorful sand dunes and access to the Cooloola National Park, popular with outdoor enthusiasts and beachgoers. | Rainbow Beach Sand Blow, Inskip Point, Cooloola National Park, Cooroy - Noosa Golf Club, Great Sandy National Park, Surfing and fishing spots |
| Paddle Board at Eurong | A popular activity spot for tourists looking to explore the serene beaches of Eurong through paddle boarding. | Paddle boarding tours, Kayaking, Wildlife viewing, Scenic beaches |
| Great Sandy National Park | A vast expanse of natural beauty, attracting tourists for hiking and outdoor activities, perfect for nature lovers. | Hiking trails, Wildlife viewing, Scenic viewpoints, Camping areas |
| Kingfisher Bay Resort | A resort that offers luxurious accommodations and adventure tours, appealing to travelers seeking comfort and nature. | Resort amenities, Guided tours, Eco tours, Wildlife experiences |
| Bayside Beach | A quieter beach area that provides relaxation and beautiful sunsets, making it great for family vacations. | Picnic areas, Swimming spots, Bayside walking trails, Scenic views |
| Wangoolba Creek | A tranquil spot ideal for fishing and kayaking, perfect for those seeking serenity in nature. | Fishing spots, Kayaking activities, Nature walks, Wildlife |
Understanding Airbnb License Requirements & STR Laws in Eurong (2025)
While Eurong, Queensland, Australia currently shows low STR regulations, specific Airbnb license requirements might still exist or change. Always verify the latest short term rental regulations and Airbnb license requirements directly with local government authorities for Eurong to ensure full compliance before hosting.
(Source: AirROI data, 2025, finding no licensed listings among those analyzed)
Top Performing Airbnb Properties in Eurong (2025)
Benchmark your potential! Explore examples of top-performing Airbnb properties in Eurongbased on Trailing Twelve Month (TTM) revenue. Analyze their characteristics, revenue, occupancy rate, and ADR to understand what drives success in this market.
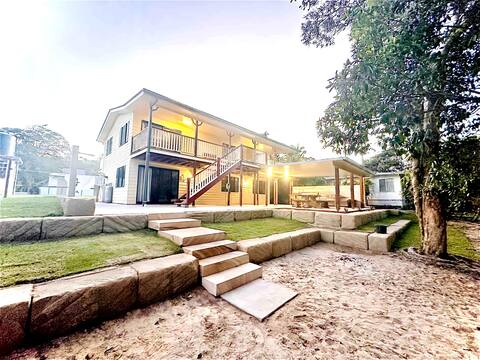
“Sandstone Hideaway” K'Gari- Fraser Island
Entire Place • 5 bedrooms
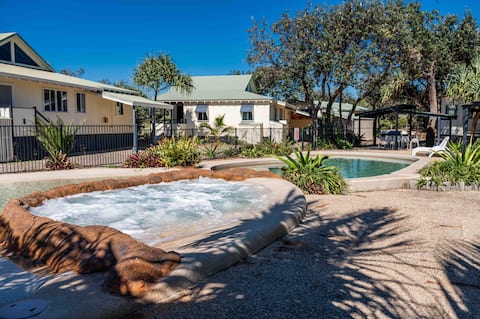
Ocean view house with communal pool & spa
Entire Place • 3 bedrooms

"Happy Days Beach House" K'Gari-Fraser Island
Entire Place • 4 bedrooms

Kgari beachhouse 3 BR / pool. Absolute beachfront
Entire Place • 3 bedrooms
E.V. - Eurong Beach Villa
Entire Place • 3 bedrooms
Seabreeze -Brand new beach house
Entire Place • 3 bedrooms
Note: Performance varies based on location, size, amenities, seasonality, and management quality. Data reflects the past 12 months.
Top Performing Airbnb Hosts in Eurong (2025)
Learn from the best! This table showcases top-performing Airbnb hosts in Eurong based on the number of properties managed and estimated total revenue over the past year. Analyze their scale and performance metrics.
| Host Name | Properties | Grossing Revenue | Stay Reviews | Avg Rating |
|---|---|---|---|---|
| Kerry | 8 | $229,851 | 32 | 3.66/5.0 |
| Clarissa | 2 | $152,680 | 103 | 4.80/5.0 |
| Michael | 3 | $149,107 | 40 | 4.90/5.0 |
| Bow-Allum Place | 2 | $90,191 | 89 | 4.92/5.0 |
| Jeffrey | 1 | $54,956 | 9 | 5.00/5.0 |
| Nicole | 1 | $54,118 | 17 | 4.94/5.0 |
| Carolyn | 2 | $37,721 | 57 | 4.86/5.0 |
| Tanya | 1 | $34,237 | 54 | 4.70/5.0 |
| Jaye | 1 | $29,962 | 45 | 4.89/5.0 |
| Derek | 1 | $25,395 | 24 | 4.88/5.0 |
Analyzing the strategies of top hosts, such as their property selection, pricing, and guest communication, can offer valuable lessons for optimizing your own Airbnb operations in Eurong.
Dive Deeper: Advanced Eurong STR Market Data (2025)
Ready to unlock more insights? AirROI provides access to advanced metrics and comprehensive Airbnb data for Eurong. Explore detailed analytics beyond this report to refine your investment strategy, optimize pricing, and maximize your vacation rental profits.
Explore Advanced MetricsEurong Short-Term Rental Market Composition (2025): Property & Room Types
Room Type Distribution
Property Type Distribution
Market Composition Insights for Eurong
- The Eurong Airbnb market composition is heavily skewed towards Entire Home/Apt listings, which make up 100% of the 24 active rentals. This indicates strong guest preference for privacy and space.
- Looking at the property type distribution in Eurong, House properties are the most common (91.7%), reflecting the local real estate landscape.
- Houses represent a significant 91.7% portion, catering likely to families or larger groups.
Eurong Airbnb Room Capacity Analysis (2025): Bedroom Distribution
Distribution of Listings by Number of Bedrooms
Room Capacity Insights for Eurong
- The dominant room capacity in Eurong is 3 bedrooms listings, making up 83.3% of the market. This suggests a strong demand for properties suitable for families or small groups.
- Together, 3 bedrooms and 2 bedrooms properties represent 91.6% of the active Airbnb listings in Eurong, indicating a high concentration in these sizes.
- A significant 91.7% of listings offer 3+ bedrooms, catering to larger groups and families seeking more space in Eurong.
Eurong Vacation Rental Guest Capacity Trends (2025)
Distribution of Listings by Guest Capacity
Guest Capacity Insights for Eurong
- The most common guest capacity trend in Eurong vacation rentals is listings accommodating 6 guests (66.7%). This suggests the primary traveler segment is likely larger groups.
- Properties designed for 6 guests and 8+ guests dominate the Eurong STR market, accounting for 95.9% of listings.
- 100.1% of properties accommodate 6+ guests, serving the market segment for larger families or group travel in Eurong.
- On average, properties in Eurong are equipped to host 6.6 guests.
Eurong Airbnb Booking Patterns (2025): Available vs. Booked Days
Available Days Distribution
Booked Days Distribution
Booking Pattern Insights for Eurong
- The most common availability pattern in Eurong falls within the 181-270 days range, representing 33.3% of listings. This suggests many properties have significant open periods on their calendars.
- Approximately 54.1% of listings show high availability (181+ days open annually), indicating potential for increased bookings or specific owner usage patterns.
- For booked days, the 181-270 days range is most frequent in Eurong (33.3%), reflecting common guest stay durations or potential owner blocking patterns.
- A notable 50.0% of properties secure long booking periods (181+ days booked per year), highlighting successful long-term rental strategies or significant owner usage.
Eurong Airbnb Minimum Stay Requirements Analysis
Distribution of Listings by Minimum Night Requirement
2 Nights
1 listings
4.3% of total
3 Nights
5 listings
21.7% of total
4-6 Nights
3 listings
13% of total
30+ Nights
14 listings
60.9% of total
Key Insights
- The most prevalent minimum stay requirement in Eurong is 30+ Nights, adopted by 60.9% of listings. This highlights the market's preference for longer commitments.
- Very short stays (1-2 nights) are less common (4.3%), suggesting hosts prefer slightly longer bookings to optimize turnover.
- A significant segment (60.9%) caters to monthly stays (30+ nights) in Eurong, pointing to opportunities in the extended-stay market.
Recommendations
- Align with the market by considering a 30+ Nights minimum stay, as 60.9% of Eurong hosts use this setting.
- Explore offering discounts for stays of 30+ nights to attract the 60.9% of the market seeking extended stays.
- Adjust minimum nights based on seasonality – potentially shorter during low season and longer during peak demand periods in Eurong.
Eurong Airbnb Cancellation Policy Trends Analysis (2025)
Flexible
1 listings
4.5% of total
Moderate
1 listings
4.5% of total
Firm
11 listings
50% of total
Strict
9 listings
40.9% of total
Cancellation Policy Insights for Eurong
- The prevailing Airbnb cancellation policy trend in Eurong is Firm, used by 50% of listings.
- A majority (90.9%) of hosts in Eurong utilize Firm or Strict policies, indicating a market where hosts prioritize booking security.
Recommendations for Hosts
- Consider adopting a Firm policy to align with the 50% market standard in Eurong.
- With 40.9% using Strict terms, this is a viable option in Eurong, particularly for high-value properties or during peak demand periods.
- Regularly review your cancellation policy against competitors and market demand shifts in Eurong.
Eurong STR Booking Lead Time Analysis (2025)
Average Booking Lead Time by Month
Booking Lead Time Insights for Eurong
- The overall average booking lead time for vacation rentals in Eurong is 76 days.
- Guests book furthest in advance for stays during December (average 115 days), likely coinciding with peak travel demand or local events.
- The shortest booking windows occur for stays in February (average 37 days), indicating more last-minute travel plans during this time.
- Seasonally, Fall (93 days avg.) sees the longest lead times, while Summer (63 days avg.) has the shortest, reflecting typical travel planning cycles.
Recommendations for Hosts
- Use the overall average lead time (76 days) as a baseline for your pricing and availability strategy in Eurong.
- For December stays, consider implementing length-of-stay discounts or slightly higher rates for bookings made less than 115 days out to capitalize on advance planning.
- Target marketing efforts for the Fall season well in advance (at least 93 days) to capture early planners.
- Monitor your own booking lead times against these Eurong averages to identify opportunities for dynamic pricing adjustments.
Popular & Essential Airbnb Amenities in Eurong (2025)
Amenity Prevalence
Amenity Insights for Eurong
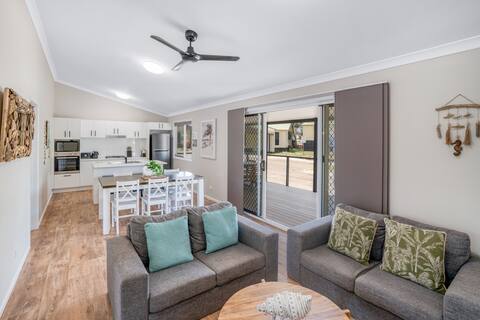
- Essential amenities in Eurong that guests expect include: Kitchen, Smoke alarm, Washer, TV, Free parking on premises, Dishes and silverware, Hot water. Lacking these (any) could significantly impact bookings.
- Popular amenities like Refrigerator, BBQ grill, Patio or balcony are common but not universal. Offering these can provide a competitive edge.
Recommendations for Hosts
- Ensure your listing includes all essential amenities for Eurong: Kitchen, Smoke alarm, Washer, TV, Free parking on premises, Dishes and silverware, Hot water.
- Prioritize adding missing essentials: TV, Free parking on premises, Dishes and silverware, Hot water.
- Consider adding popular differentiators like Refrigerator or BBQ grill to increase appeal.
- Highlight unique or less common amenities you offer (e.g., hot tub, dedicated workspace, EV charger) in your listing description and photos.
- Regularly check competitor amenities in Eurong to stay competitive.
Eurong Airbnb Guest Demographics & Profile Analysis (2025)
Guest Profile Summary for Eurong
- The typical guest profile for Airbnb in Eurong consists of primarily domestic travelers (92%), often arriving from nearby Brisbane, typically belonging to the Post-2000s (Gen Z/Alpha) group (50%), primarily speaking English or Spanish.
- Domestic travelers account for 91.9% of guests.
- Key international markets include Australia (91.9%) and Germany (3%).
- Top languages spoken are English (77.1%) followed by Spanish (8.6%).
- A significant demographic segment is the Post-2000s (Gen Z/Alpha) group, representing 50% of guests.
Recommendations for Hosts
- Target domestic marketing efforts towards travelers from Brisbane and Queensland.
- Tailor amenities and listing descriptions to appeal to the dominant Post-2000s (Gen Z/Alpha) demographic (e.g., highlight fast WiFi, smart home features, local guides).
- Highlight unique local experiences or amenities relevant to the primary guest profile.
- Consider seasonal promotions aligned with peak travel times for key origin markets.
Nearby Short-Term Rental Market Comparison
How does the Eurong Airbnb market stack up against its neighbors? Compare key performance metrics like average monthly revenue, ADR, and occupancy rates in surrounding areas to understand the broader regional STR landscape.
| Market | Active Properties | Monthly Revenue | Daily Rate | Avg. Occupancy |
|---|---|---|---|---|
| Castaways Beach | 17 | $5,430 | $517.24 | 47% |
| Noosa Heads | 1,002 | $4,142 | $382.10 | 48% |
| Kingfisher Bay | 29 | $4,002 | $342.74 | 42% |
| Happy Valley | 10 | $3,770 | $222.76 | 57% |
| Sunrise Beach | 110 | $3,666 | $357.47 | 48% |
| Sunshine Beach | 289 | $3,550 | $402.94 | 42% |
| Marcus Beach | 22 | $3,309 | $439.85 | 45% |
| Sunshine Coast Regional | 3,453 | $2,894 | $243.73 | 48% |
| Orchid Beach | 15 | $2,746 | $219.78 | 47% |
| Burnett Heads | 18 | $2,734 | $189.60 | 46% |